. 2021 Jul 29:12:692606.
doi: 10.3389/fpls.2021.692606. eCollection 2021.

Overexpression of F-Box Nictaba Promotes Defense and Anthocyanin Accumulation in Arabidopsis thaliana After Pseudomonas syringae Infection

Affiliations

Overexpression of F-Box Nictaba Promotes Defense and Anthocyanin Accumulation in Arabidopsis thaliana After Pseudomonas syringae Infection

Andrea Romero-Pérez et al. Front Plant Sci. .

Abstract

Pseudomonas syringae pv. tomato DC3000 (Pst DC3000) is a well-known pathogen and model organism used to study plant-pathogen interactions and subsequent plant immune responses. Numerous studies have demonstrated the effect of Pst DC3000 on Arabidopsis plants and how type III effectors are required to promote bacterial virulence and pathogenesis. F-Box Nictaba (encoded by At2g02360) is a stress-inducible lectin that is upregulated in Arabidopsis thaliana leaves after Pst DC3000 infection. In this study, a flood inoculation assay was optimized to check the performance of transgenic Arabidopsis seedlings with different expression levels of F-Box Nictaba after bacterial infection. Using a combination of multispectral and fluorescent imaging combined with molecular techniques, disease symptoms, transcript levels for F-Box Nictaba, and disease-related genes were studied in Arabidopsis leaves infected with two virulent strains: Pst DC3000 and its mutant strain, deficient in flagellin ΔfliC. Analyses of plants infected with fluorescently labeled Pst DC3000 allowed us to study the differences in bacterial colonization between plant lines. Overexpression plants showed a reduced bacterial content during the later stages of the infection. Our results show that overexpression of F-Box Nictaba resulted in reduced leaf damage after bacterial infections, whereas knockdown and knockout lines were not more susceptible to Pseudomonas infection than wild-type plants. In contrast to wild-type and knockout plants, overexpressing lines for F-Box Nictaba revealed a significant increase in anthocyanin content, better efficiency of photosystem II (Fv/Fm), and higher chlorophyll content after Pst DC3000 infection. Overexpression of F-Box Nictaba coincided with increased expression of salicylic acid (SA) related defense genes, confirming earlier data that showed that F-Box Nictaba is part of the SA-dependent defense against Pst DC3000 infection. Knockout lines yielded no discernible effects on plant symptoms after Pseudomonas infection suggesting possible gene redundancy between F-Box Nictaba genes.

Keywords: F-Box Nictaba; Pseudomonas; glycosylation; lectin; plant-pathogen interaction.


Conflict of interest statement

The authors declare that the research was conducted in the absence of any commercial or financial relationships that could be construed as a potential conflict of interest.

Figures

Figure 1
Figure 1
F-Box Nictaba transcript levels in transgenic lines. Results represent the fold change (and SE) for FBN60 transcripts in transgenic lines compared with WT plants. Asterisks indicate statistically significant differences between WT and transgenic lines (**p ≤ 0.01; ***p ≤ 0.001). WT, wild-type plants.
Figure 2
Figure 2
Effect of Pst DC3000 infection on rosette size, the efficiency of photosystem II (Fv/Fm), and chlorophyll content (ChlIdx) in 17-day-old Arabidopsis plants at 3 days after inoculation compared with mock-treated plants. Graphs show mean values with error bars representing standard deviation. For this graph, values of all plant lines and treatments were normalized to the WT mock of each experiment, allowing us to represent two different experiments together in one graph. White boxes represent Mock-treated samples and gray boxes Pst DC3000 infected samples. Comparison of Arabidopsis lines within mock-treated plants (black letters) or Pst DC3000 infected plants (red letters) was done with a one-way ANOVA analysis followed by a post-hoc Tukey test. Significant letters indicate differences at a level of p < 0.05. The comparison between mock and Pst DC3000 treated plants within a plant genotype was done using independent samples T-test for normally distributed data and Mann-Whitney test for non-normally distributed samples. Asterisks indicate statistically significant differences between treatments within the same transgenic line (*p ≤ 0.1; **p ≤ 0.05; ***p ≤ 0.001). Number of observations (individual rosettes) in mock treatment: WT = 36, KO2 = 18, KO5 = 18, KD = 10 OE4 = 12, OE6 = 18, npr1-1 = 18. Number of observations (individual rosettes) in Pst DC3000 infection treatment: WT = 48, KO2 = 18, KO5 = 18, KD = 10, OE4 = 12, OE6 = 24, npr1-1 = 17.
Figure 3
Figure 3
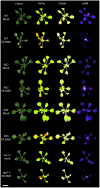
Multispectral images of Arabidopsis rosettes at 3 days after mock treatment and Pst DC3000 inoculation. The different images represent the RGB Color image; Fv/Fm: efficiency of photosystem II; ChlIdx: chlorophyll index, a measure for chlorophyll; mARI: modified anthocyanin reflectance index, a measure for the amount of anthocyanin content. Scale bar represents 1 cm.
Figure 4
Figure 4
Multispectral images of Arabidopsis rosettes 3 days after mock treatment and Pst DC3000 inoculation. The different images represent the rosette measuring the following traits: RGB Color image; Fv/Fm: efficiency of photosystem II; ChlIdx: chlorophyll index, a measure for the amount of chlorophyll; mARI: modified anthocyanin reflectance index, a measure for the amount of anthocyanin content. Scale bar represents 1 cm.
Figure 5
Figure 5
Quantification of damaged leaf area after Pst DC3000 infection in WT, KO2, KO5, OE6, and KD plants. Leaf damage was measured as chlorotic lesion area in total leaf area and normalized to the WT lesion area. These results are based on three independent biological replicates. For this graph, values of all plant lines were normalized to the WT of each experiment, allowing us to represent two different experiments together in one graph. Comparison of Arabidopsis lines was done with a one-way ANOVA analysis followed by a post hoc Tukey test. Significant letters indicate differences at a level of p < 0.05.
Figure 6
Figure 6
Fluorescence measured in 2-week-old Arabidopsis thaliana plants infected with GFP-labeled Pst DC3000 strain at 1-, 3-, and 5-days post-infection. Fluorescence was calculated using the log of the ratio cGFP/cm2 in order to represent the fluorescence in the plant. Comparison between wild-type plants and transgenic lines was performed using independent samples T-test for normally distributed data and Mann-Whitney test for non-normally distributed. Asterisks indicate statistically significant differences between WT and transgenic lines (*p ≤ 0.05; **p ≤ 0.01; ***p ≤ 0.001). cGFP: corrected Green Fluorescent Protein fluorescence.
Figure 7
Figure 7
Anthocyanin content (AriIdx) in 17-day-old Arabidopsis plants at 3 days after Pst DC3000 inoculation. Graphs show mean values with error bars representing standard deviation. For this graph, values of all plant lines and treatments were normalized to the WT Mock of each experiment, allowing us to represent two different experiments together in one graph. White boxes represent mock-treated samples and gray boxes Pst DC3000 infected samples. Comparison of Arabidopsis lines within Pst DC3000 treated plants (red letters), or mock-infected plants (black letters) was done with a one-way ANOVA analysis followed by a post-hoc Tukey test. Significant letters indicate differences at a level of p < 0.05. The comparison between mock and Pst DC3000 infected plants within a plant genotype was done using independent samples T-test for normally distributed data and Mann-Whitney test for non-normally distributed samples. Asterisks indicate statistically significant differences between treatments within the same transgenic line (*p ≤ 0.1; **p ≤ 0.05; ***p ≤ 0.001). Number of observations (individual rosettes) in mock treatment: WT = 36, OE6 = 18, OE4 = 12, KD = 10, KO2 = 18, KO5 = 18, npr1-1 = 18. Number of observations (individual rosettes) in Pst DC3000 infection treatment: WT = 48, OE6 = 24, OE4 = 12, KD = 10, KO2 = 18, KO5 = 18, npr1-1 = 17.
Figure 8
Figure 8
Damaged leaf area after Pst DC3000 ΔfliC mutant infection in WT, OE6, and KD plants and comparison with Pst DC3000 strain. Quantification of lesion area (A). The leaf damage was measured as chlorotic lesion area in total leaf area and normalized to the WT lesion area. These results are based on three independent biological replicates. For this graph, values of all plant lines and treatments were normalized to the WT of each experiment, allowing us to represent two different experiments together in one graph. White boxes represent Pst DC3000 infected plants and gray boxes ΔfliC-infected plants. Comparison of Arabidopsis lines within Pst DC3000 treated plants (black letters) or ΔfliC infected plants (red letters) was done with a one-way ANOVA analysis followed by a post hoc Tukey test. Significant letters indicate differences at a level of p < 0.05. Comparing mock and Pst DC3000 infected plants within a plant genotype was done using independent samples T-test for normally distributed data and Mann–Whitney test for non-normally distributed samples. Asterisks indicate statistically significant differences between treatments within the same transgenic line (*p ≤ 0.1; ***p ≤ 0.001). Phenotype of Arabidopsis lines after mock treatment and infection with Pst DC3000 and ΔfliC mutant (B).
Figure 9
Figure 9
Relative transcript levels for F-Box Nictaba (FBN60, At2g02360) and SA-defense pathway-related genes WRKY70 (At3g56400), PR1 (At2g14610), and PR2 (At3g57260) in Arabidopsis thaliana plants after inoculation with Pst DC3000 or Pst DC3000 ΔfliC mutant. Results were determined by qPCR analysis for three independent biological replicates. Error bars represent standard errors. Asterisks indicate the significance of statistical differences of the samples compared with wild-type mock-treated plants (*p < 0.05; **p < 0.01; ***p < 0.001). Graphs are shown on a logarithmic scale.

References

    1. Baker N. R. (2008). Chlorophyll fluorescence: a probe of photosynthesis in vivo. Annu. Rev. Plant Biol. 59, 89–113. 10.1146/annurev.arplant.59.032607.092759 - DOI - PubMed
    1. Bellande K., Bono J. J., Savelli B., Jamet E., Canut H. (2017). Plant lectins and lectin receptor-like kinases: how do they sense the outside? Int. J. Mol. Sci. 18:1164. 10.3390/ijms18061164 - DOI - PMC - PubMed
    1. Beneteau J., Renard D., Marché L., Douville E., Lavenant L., Rahbé Y., et al. . (2010). Binding properties of the N-acetylglucosamine and high-mannose N-glycan PP2-A1 phloem lectin in Arabidopsis. Plant Physiol. 153, 1345–1361. 10.1104/pp.110.153882 - DOI - PMC - PubMed
    1. Brinkman E. K., Chen T., Amendola M., Van Steensel B. (2014). Easy quantitative assessment of genome editing by sequence trace decomposition. Nucleic Acids Res. 42:e168. 10.1093/nar/gku936 - DOI - PMC - PubMed
    1. Brooks D. M., Bender C. L., Kunkel B. N. (2005). The Pseudomonas syringae phytotoxin coronatine promotes virulence by overcoming salicylic acid-dependent defences in Arabidopsis thaliana. Mol. Plant Pathol. 6, 629–639. 10.1111/j.1364-3703.2005.00311.x - DOI - PubMed

LinkOut - more resources