. 2021 Jul 28:9:688272.
doi: 10.3389/fped.2021.688272. eCollection 2021.

A Novel Framework for Phenotyping Children With Suspected or Confirmed Infection for Future Biomarker Studies

Affiliations

A Novel Framework for Phenotyping Children With Suspected or Confirmed Infection for Future Biomarker Studies

Ruud G Nijman et al. Front Pediatr. .

Abstract

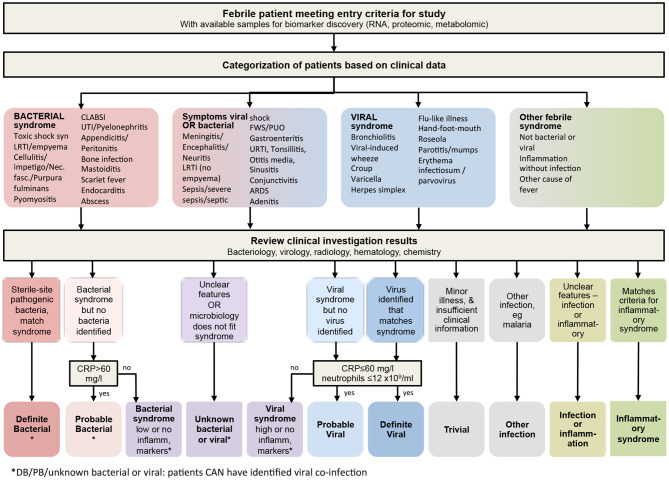
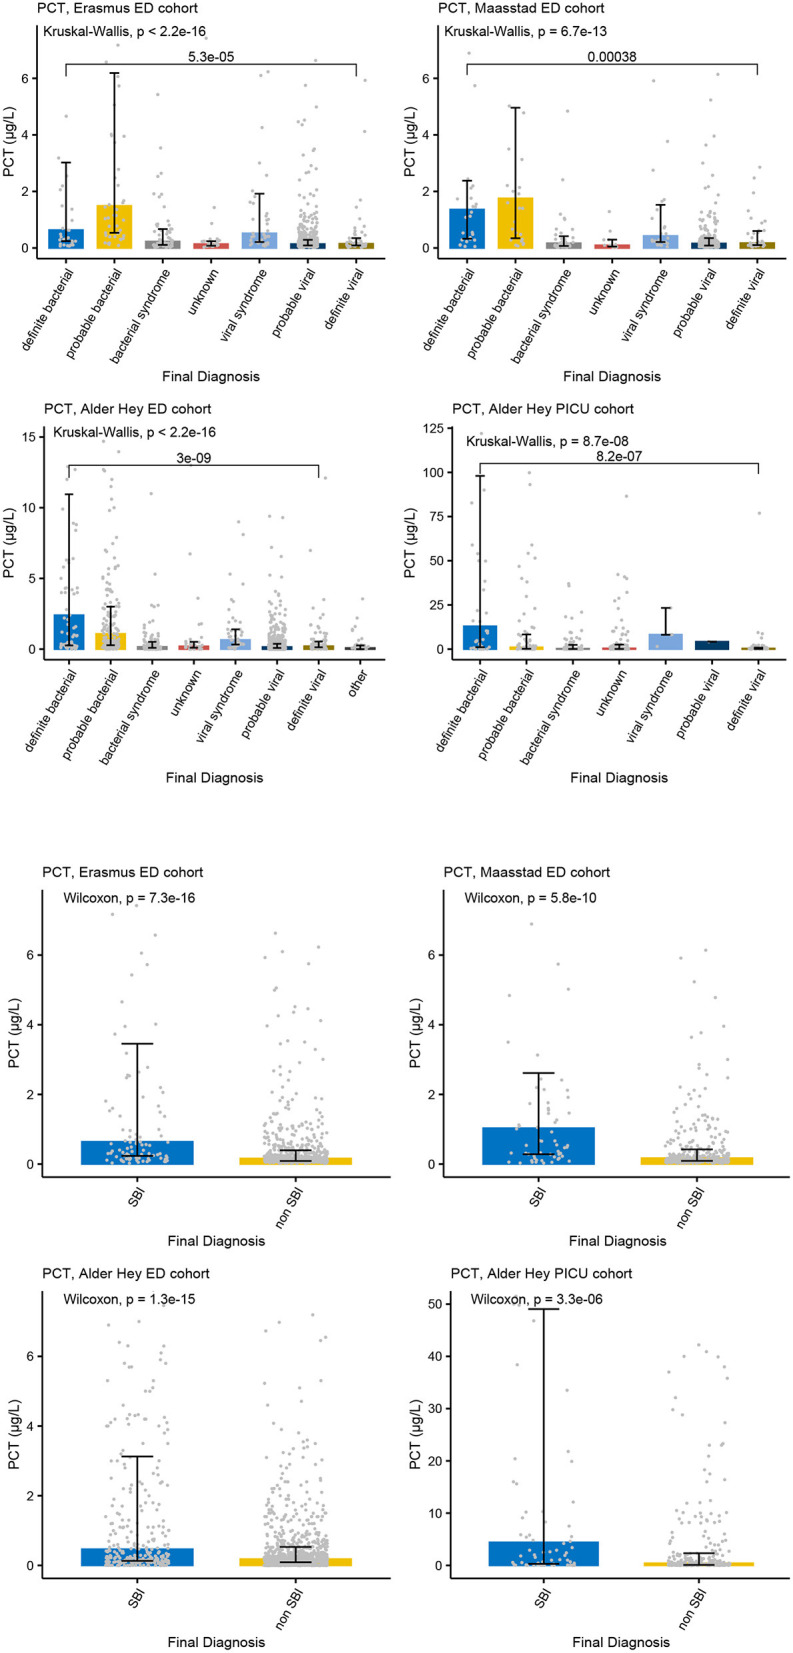
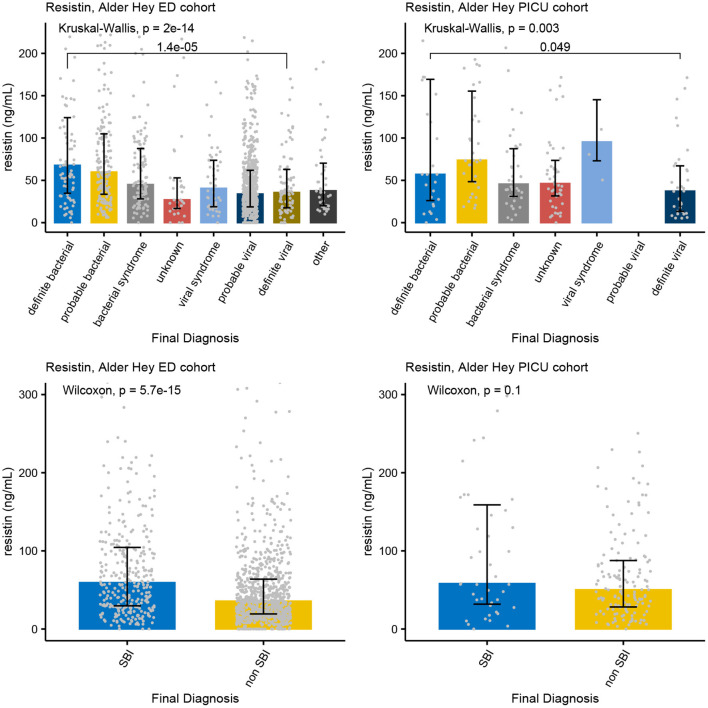
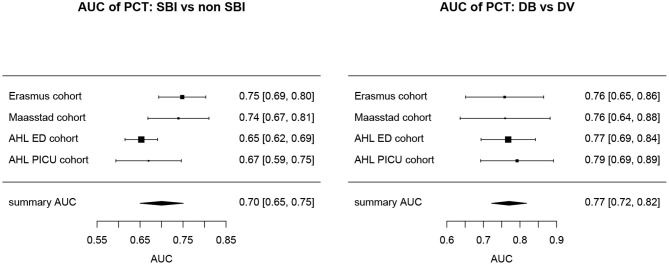
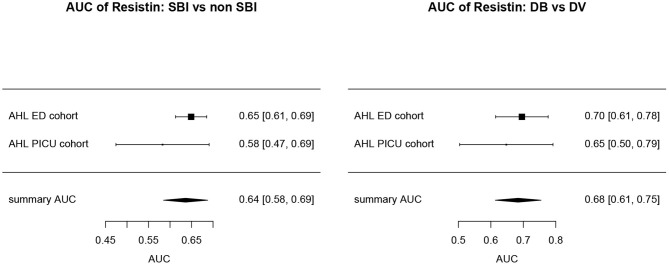
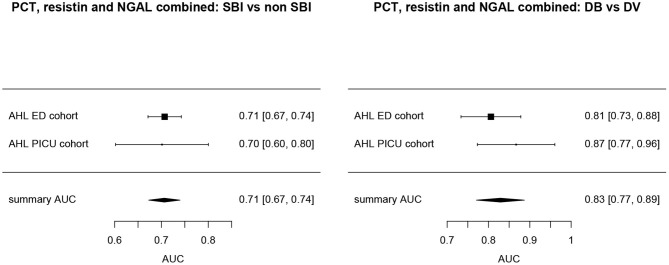
Background: The limited diagnostic accuracy of biomarkers in children at risk of a serious bacterial infection (SBI) might be due to the imperfect reference standard of SBI. We aimed to evaluate the diagnostic performance of a new classification algorithm for biomarker discovery in children at risk of SBI. Methods: We used data from five previously published, prospective observational biomarker discovery studies, which included patients aged 0- <16 years: the Alder Hey emergency department (n = 1,120), Alder Hey pediatric intensive care unit (n = 355), Erasmus emergency department (n = 1,993), Maasstad emergency department (n = 714) and St. Mary's hospital (n = 200) cohorts. Biomarkers including procalcitonin (PCT) (4 cohorts), neutrophil gelatinase-associated lipocalin-2 (NGAL) (3 cohorts) and resistin (2 cohorts) were compared for their ability to classify patients according to current standards (dichotomous classification of SBI vs. non-SBI), vs. a proposed PERFORM classification algorithm that assign patients to one of eleven categories. These categories were based on clinical phenotype, test outcomes and C-reactive protein level and accounted for the uncertainty of final diagnosis in many febrile children. The success of the biomarkers was measured by the Area under the receiver operating Curves (AUCs) when they were used individually or in combination. Results: Using the new PERFORM classification system, patients with clinically confident bacterial diagnosis ("definite bacterial" category) had significantly higher levels of PCT, NGAL and resistin compared with those with a clinically confident viral diagnosis ("definite viral" category). Patients with diagnostic uncertainty had biomarker concentrations that varied across the spectrum. AUCs were higher for classification of "definite bacterial" vs. "definite viral" following the PERFORM algorithm than using the "SBI" vs. "non-SBI" classification; summary AUC for PCT was 0.77 (95% CI 0.72-0.82) vs. 0.70 (95% CI 0.65-0.75); for NGAL this was 0.80 (95% CI 0.69-0.91) vs. 0.70 (95% CI 0.58-0.81); for resistin this was 0.68 (95% CI 0.61-0.75) vs. 0.64 (0.58-0.69) The three biomarkers combined had summary AUC of 0.83 (0.77-0.89) for "definite bacterial" vs. "definite viral" infections and 0.71 (0.67-0.74) for "SBI" vs. "non-SBI." Conclusion: Biomarkers of bacterial infection were strongly associated with the diagnostic categories using the PERFORM classification system in five independent cohorts. Our proposed algorithm provides a novel framework for phenotyping children with suspected or confirmed infection for future biomarker studies.

Keywords: biomarkers; children; clinical phenotypes; sepsis; serious bacterial infection.


Conflict of interest statement

CF is affiliated with Micropathology Ltd., an Independent Rapid Diagnosis & Biomedical Research Company. Micropathology Ltd. provides a clinically supported service for the rapid diagnosis and management of infectious and genetic disease. It is a formal partner of the PERFORM research consortium. The remaining authors declare that the research was conducted in the absence of any commercial or financial relationships that could be construed as a potential conflict of interest.

Figures

Figure 1
Figure 1
Child with fever: patient journey in order of likely outcome. A small proportion of children presenting to the ED with a febrile illness have a confirmed Serious Bacterial Infection (SBI), and of these a smaller number require admission to hospital or PICU, as shown in the pyramid as a percentage of the total number of febrile children in ED. The data were collected in the MOFICHE study (Management and Outcome of Fever in Children in Europe, n = 38,480) as part of the EU Horizon 2020-funded PERFORM study (Personalized Risk assessment in Febrile illness to Optimize Real-life Management across the European Union, www.perform2020.org). The MOFICHE study was an observational study in twelve EDs in eight different European countries [Austria, Germany, Greece, Latvia, the Netherlands (n = 3), Spain, Slovenia and the United Kingdom (n = 3)], which recorded clinical data on consecutive children with febrile illness in 2017–2018 (78). There were no fatal cases of SBI in the MOFICHE study, but 1 case of fatal viral gastro-enteritis; PICU admission with SBI: 39 (25%) out of total of 158 PICU admissions; hospital admission with SBI: 1,947 (20%) out of total of 9.893 admissions; *the MOFICHE study reflects death in ED, not overall mortality. ED, emergency department; SBI, serious bacterial infection; PICU, pediatric intensive care unit.
Figure 2
Figure 2
Algorithm for classifying children at risk of serious infection. Following discharge, clinical phenotypes were assigned after review of all available clinical and laboratory data including biochemistry, hematology, radiology and microbiology. Children allocated to the “other infection,” “infection or inflammation,” or “inflammatory syndrome” boxes at the bottom right would normally be analyzed as its component parts individually, so that studies can recruit and meaningfully analyze data from these type of patients alongside the infection patients. CRP, C-reactive protein.
Figure 3
Figure 3
PCT and serious bacterial infections. Each graph shows the concentrations of PCT (microgr/L) for each of the categories of the PERFORM classification algorithm (top two rows) and of the SBI classification algorithm (bottom two rows) in the Erasmus cohort (left, 1st and 3nd row), Maasstad cohort (right, 1st and 3rd row), Alder Hey ED cohort (left, 2nd and 4th row), and the Alder Hey PICU cohort (right, 2nd and 4th row). Each bar represents median concentration values, with the black lines representing the interquartile range, and the gray dots representing individual values. Overall significance for the PERFORM classification algorithm is given using the Kruskal Wallis test, and for the SBI classification using the Wilcoxon rank sum test. In addition, significance value for “definite bacterial” vs. “definite viral” of the PERFORM algorithm was calculated using the Wilcoxon rank sum test.
Figure 4
Figure 4
Concentrations of NGAL. Each graph shows the concentrations of NGAL (ng/L) for each of the categories of the PERFORM classification algorithm (top row) and of the SBI classification algorithm (bottom row) in the Alder Hey ED cohort (left), the Alder Hey PICU cohort (middle) and the St. Mary's hospital cohort (right). Each bar represents median concentration values, with the black lines representing the interquartile range, and the gray dots representing individual values. Overall significance for the PERFORM classification algorithm is given using the Kruskal Wallis test, and for the SBI classification using the Wilcoxon rank sum test. In addition, significance value for “definite bacterial” vs. “definite viral” of the PERFORM algorithm was calculated using the Wilcoxon rank sum test.
Figure 5
Figure 5
Concentrations of Resistin. Each graph shows the concentrations of Resistin (ng/L) for each of the categories of the PERFORM classification algorithm (top row) and of the SBI classification algorithm (bottom row) in the Alder Hey ED cohort (left) and the Alder Hey PICU cohort (right). Each bar represents median concentration values, with the black lines representing the interquartile range, and the gray dots representing individual values. Overall significance for the PERFORM classification algorithm is given using the Kruskal Wallis test, and for the SBI classification using the Wilcoxon rank sum test. In addition, significance value for “definite bacterial” vs. “definite viral” of the PERFORM algorithm was calculated using the Wilcoxon rank sum test.
Figure 6
Figure 6
Forest plot of summary AUC: PCT. Forest plot of random effects model of the AUCs of PCT predicting SBI vs. non-SBI (left) and Definite Bacterial (DB) vs. Definite Viral (DV) (right) for our four cohorts with PCT available (y-axis). The black squares show the mean AUC values with the 95% confidence intervals on the x-axis. Overall summary AUC and confidence interval are shows as black diamond. For SBI vs. non-SBI: model I2 = 67.26%, test for heterogeneity Q (df = 3) = 101,349, p-value 0.0175; for DB vs. DV: model I2 = 0.00%, test for heterogeneity Q (df = 3) = 0.2694, p-value 0.9657.
Figure 7
Figure 7
Forest plot of summary AUC: NGAL. Forest plot of random effects model of the AUCs of NGAL predicting SBI vs. non-SBI (left) and Definite Bacterial (DB) vs. Definite Viral (DV) (right) for our three cohorts with NGAL available (y-axis). The black squares show the mean AUC values with the 95% confidence intervals on the x-axis. Overall summary AUC and confidence interval are shows as black diamond. For SBI vs. non-SBI: model I2 = 89.14%, test for heterogeneity Q (df = 2) = 18.4711, p-value < 0.001; for DB vs. DV: model I2 = 76.23%, test for heterogeneity Q (df = 2) = 9.5315, p-value 0.0085.
Figure 8
Figure 8
Forest plot of summary AUC: Resistin. Forest plot of random effects model of the AUCs of Resistin predicting SBI vs. non-SBI (left) and Definite Bacterial (DB) vs. Definite Viral (DV) (right) for our two cohorts with Resisting available (y-axis). The black squares show the mean AUC values with the 95% confidence intervals on the x-axis. Overall summary AUC and confidence interval are shows as black diamond. For SBI vs. non-SBI: model I2 = 23.13%, test for heterogeneity Q (df = 1) = 1.3009, p-value 0.2540; for DB vs. DV: model I2 = 0.00%, test for heterogeneity Q (df = 1) = 0.3248, p-value 0.5687.
Figure 9
Figure 9
Forest plot of summary AUC: PCT, Resistin and NGAL combined. Forest plot of random effects model of the AUCs of PCT, Resistin and NGAL combined predicting SBI vs. non-SBI (left) and Definite Bacterial (DB) vs. Definite Viral (DV) (right) for our two cohorts with all three biomarkers available (y-axis). The black squares show the mean AUC values with the 95% confidence intervals on the x-axis. Overall summary AUC and confidence interval are shows as black diamond. For SBI vs. non-SBI: model I2 = 0.00%, test for heterogeneity Q (df = 1) = 0.0112, p-value 0.9156; for DB vs. DV: model I2 = 2.02%, test for heterogeneity Q (df = 1) = 1.0206, p-value 0.3124.

References

    1. Van den Bruel A, Haj-Hassan T, Thompson M, Buntinx F, Mant D. Diagnostic value of clinical features at presentation to identify serious infection in children in developed countries: a systematic review. Lancet. (2010) 375:834–45. 10.1016/S0140-6736(09)62000-6 - DOI - PubMed
    1. Wolfe I, Thompson M, Gill P, Tamburlini G, Blair M, Van Den Bruel A, et al. . Health services for children in western Europe. Lancet. (2013) 381:1224–34. 10.1016/S0140-6736(12)62085-6 - DOI - PubMed
    1. Bryce J, Boschi-Pinto C, Shibuya K, Black RE. WHO estimates of the causes of death in children. Lancet. (2005) 365:1147–52. 10.1016/S0140-6736(05)71877-8 - DOI - PubMed
    1. National Institute of Health and Care Excellence (NICE) . NICE Clinical Guideline 51: Sepsis: Recognition, Diagnosis, and Early Management. London: National Institute of Health and Care Excellence; (2016). - PubMed
    1. Freitag A, Constanti M, O'Flynn N, Faust SN. Suspected sepsis: summary of NICE guidance. BMJ. (2016) 354:i4030. 10.1136/bmj.i4030 - DOI - PubMed