

Trends in epidemiology: the role of denominator fluctuation in population based estimates
- PMID: 34395700
- PMCID: PMC8334628
- DOI: 10.3934/publichealth.2021040
Trends in epidemiology: the role of denominator fluctuation in population based estimates
Abstract
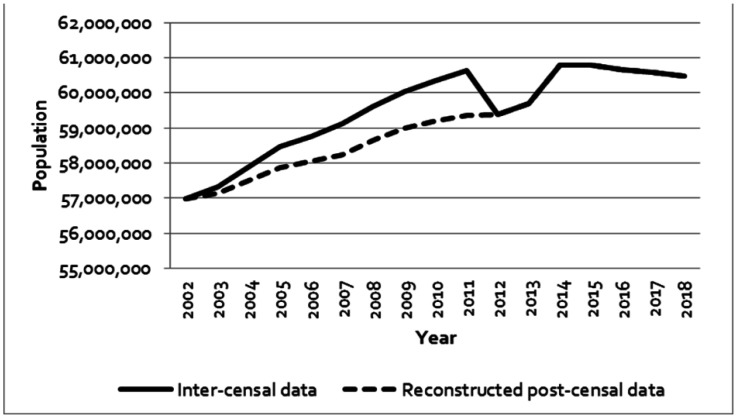
Background: Population estimates are of paramount importance for calculating occurrence and association measures although they can be affected by problems of accuracy and completeness. This study has performed a simulation of the impact of Italian population size variability on incidence rates.
Methods: Data have been obtained by the Italian National Institute of Statistics. For each year expected cases were calculated at increasing fixed rates (up to 1,000/100,000) and were considered constant in the "following year", calculating statistical differences (P < 0.05).
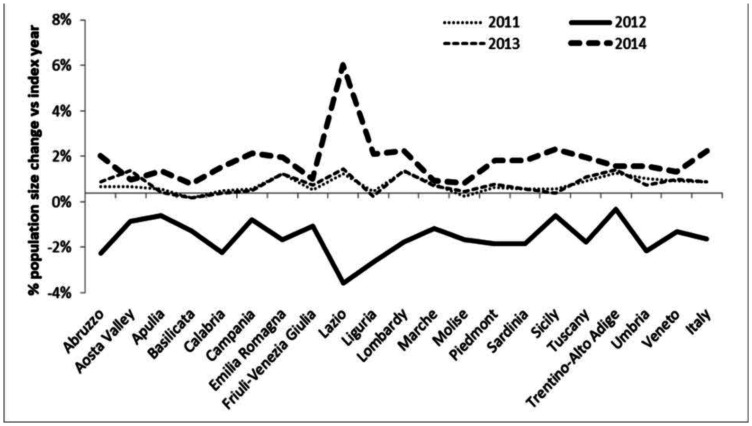
Results: In Italy and in other regions, statistically significant higher RRs were found in 2012 vs. 2011 whereas statistically significant lower RRs were found in 2013 vs. 2012 and in 2014 vs. 2013.
Contribution: The simulation confirms that significant differences due to population fluctuation could be found between consecutive years when investigating diseases with medium-high rates. Researchers should be encouraged to implement actions for reducing the risk of biased population denominators.
Keywords: censal data; population estimates; public health.
© 2021 the Author(s), licensee AIMS Press.
Conflict of interest statement
Conflict of interest: The authors declare no conflicts of interest.
Figures
References
-
- United Nations. World Population Prospects: The 2017 Revision. 2019. Available from: https://www.un.org/development/desa/publications/world-population-prospe....
-
- Eurostat. 2019. Available from: https://ec.europa.eu/eurostat/statistics-explained/index.php/Population_....
-
- Italian National Institute of Statistics. 2019. Available from: https://www.istat.it/en/
-
- Italian National Institute of Statistics. La revisione post-censuaria. 2019. Available from: https://www.istat.it/it/files/2016/09/LA-REVISIONE-POST-CENSUARIA.pdf.
-
- Italian National Institute of Statistics. 2019. Available from: http://demo.istat.it/archive.html.
LinkOut - more resources
Full Text Sources