. 2021 Jul;8(3):035005.
doi: 10.1117/1.NPh.8.3.035005. Epub 2021 Aug 12.

Optimization of time domain diffuse correlation spectroscopy parameters for measuring brain blood flow

Affiliations

Optimization of time domain diffuse correlation spectroscopy parameters for measuring brain blood flow

Dibbyan Mazumder et al. Neurophotonics. 2021 Jul.

Abstract

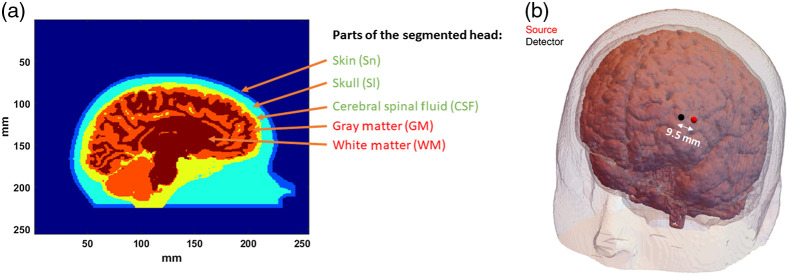
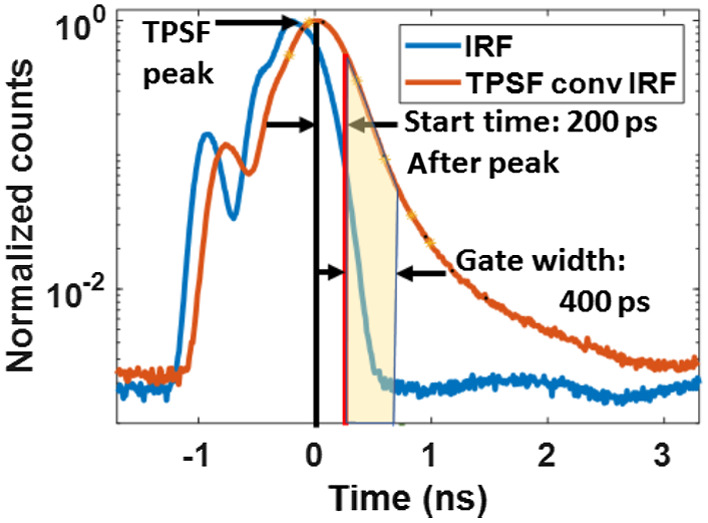
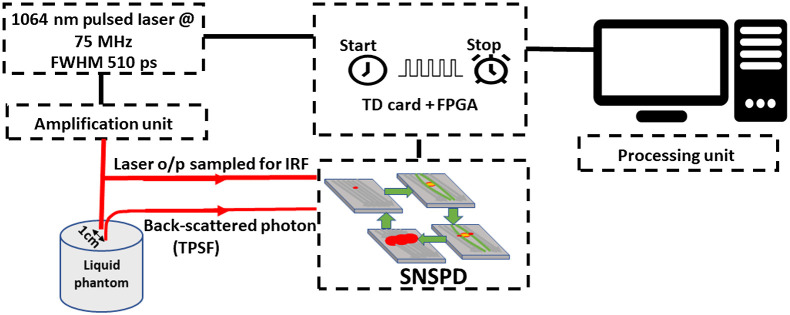
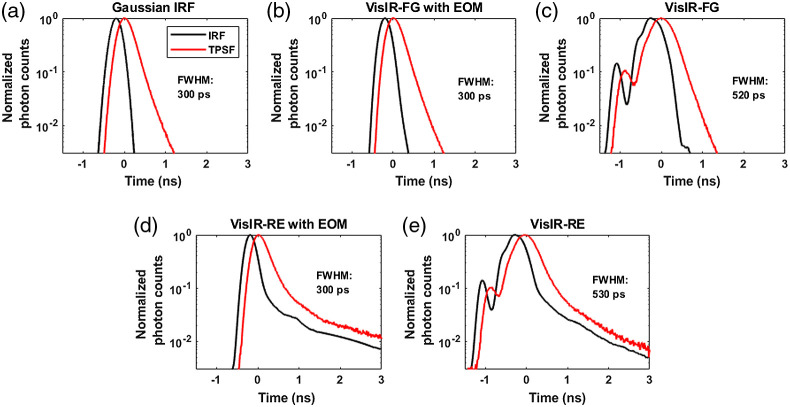
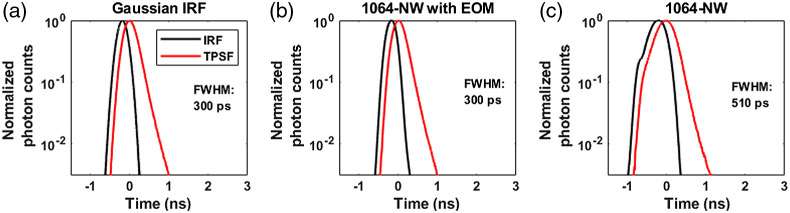
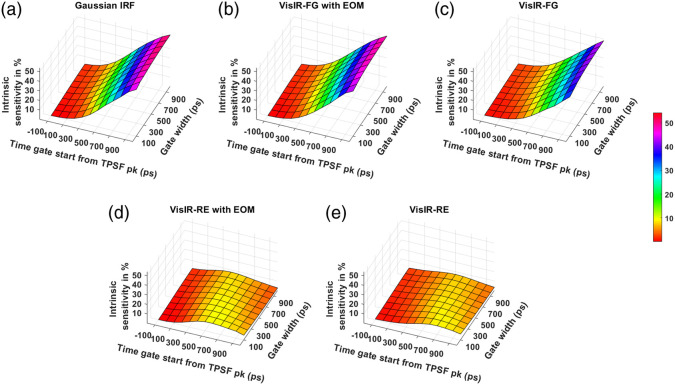
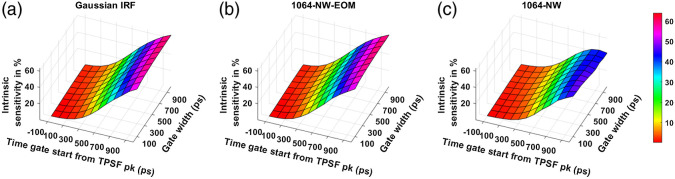
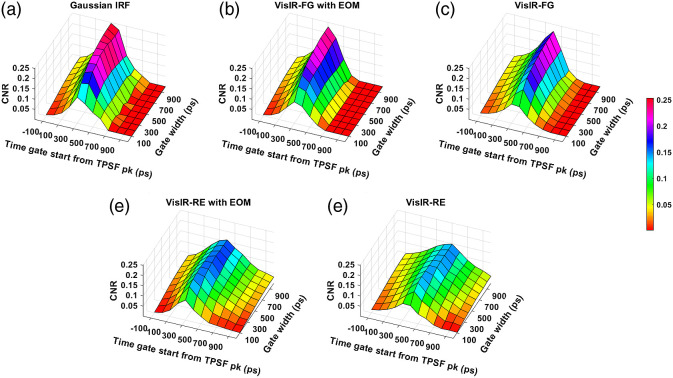
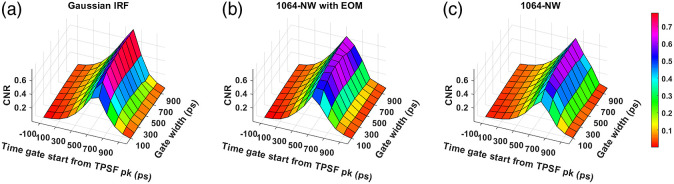
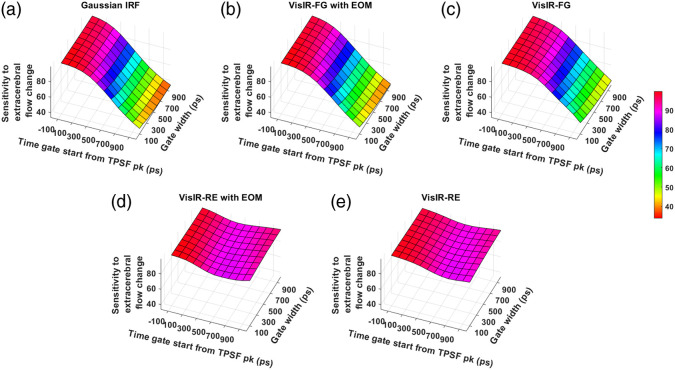
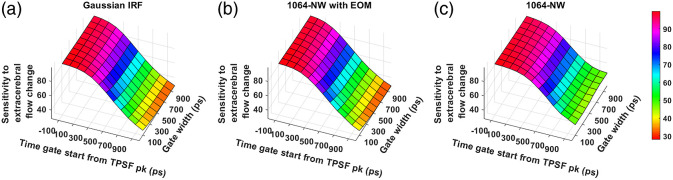
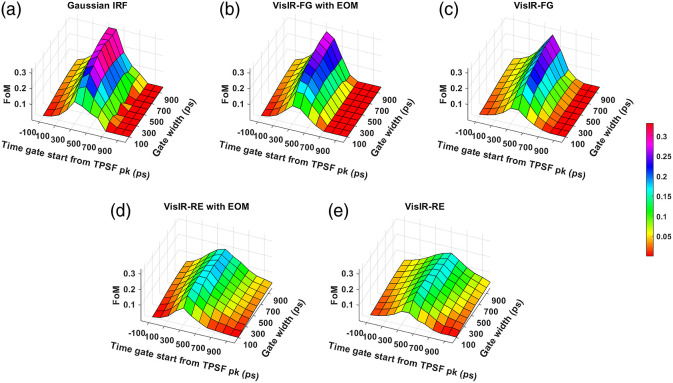
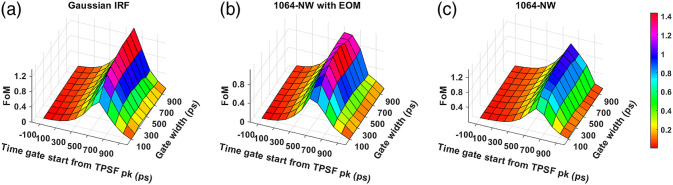
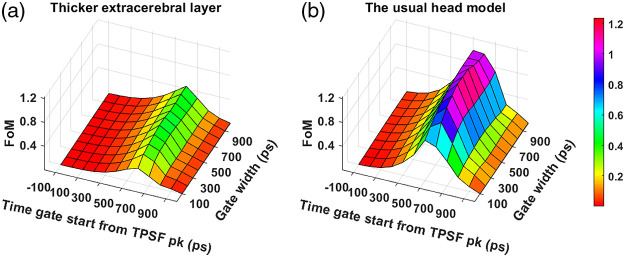
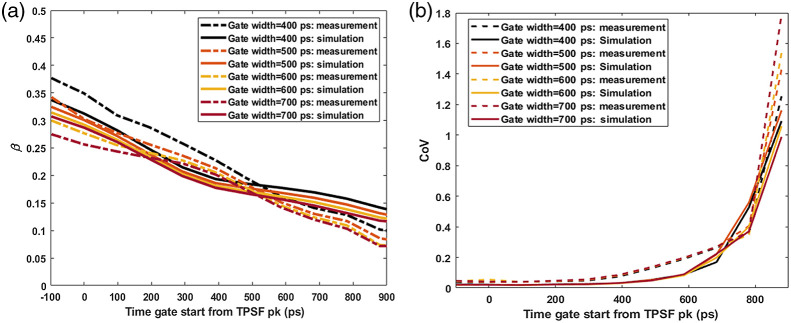
Significance: Time domain diffuse correlation spectroscopy (TD-DCS) can offer increased sensitivity to cerebral hemodynamics and reduced contamination from extracerebral layers by differentiating photons based on their travel time in tissue. We have developed rigorous simulation and evaluation procedures to determine the optimal time gate parameters for monitoring cerebral perfusion considering instrumentation characteristics and realistic measurement noise. Aim: We simulate TD-DCS cerebral perfusion monitoring performance for different instrument response functions (IRFs) in the presence of realistic experimental noise and evaluate metrics of sensitivity to brain blood flow, signal-to-noise ratio (SNR), and ability to reject the influence of extracerebral blood flow across a variety of time gates to determine optimal operating parameters. Approach: Light propagation was modeled on an MRI-derived human head geometry using Monte Carlo simulations for 765- and 1064-nm excitation wavelengths. We use a virtual probe with a source-detector separation of 1 cm placed in the pre-frontal region. Performance metrics described above were evaluated to determine optimal time gate(s) for different IRFs. Validation of simulation noise estimates was done with experiments conducted on an intralipid-based liquid phantom. Results: We find that TD-DCS performance strongly depends on the system IRF. Among Gaussian pulse shapes, 300 ps pulse length appears to offer the best performance, at wide gates (500 ps and larger) with start times 400 and 600 ps after the peak of the TPSF at 765 and 1064 nm, respectively, for a 1-s integration time at photon detection rates seen experimentally (600 kcps at 765 nm and 4 Mcps at 1064 nm). Conclusions: Our work shows that optimal time gates satisfy competing requirements for sufficient sensitivity and sufficient SNR. The achievable performance is further impacted by system IRF with 300 ps quasi-Gaussian pulse obtained using electro-optic laser shaping providing the best results.

Keywords: Monte Carlo simulation; cerebral blood flow measurement; instrument response function; optimization; time domain diffuse correlation spectroscopy.


Figures

Fig. 1
Fig. 1
(a) Human head cross section from MRI structural scan, showing different parts of the head. The Sn, Sl, and CSF have been considered extracerebral layers, with GM and WM combined as brain. The dynamics in the Sl and CSF region were considered to be zero. (b) The position of the source and detector locations on the forehead, away from the midline of the brain.
Fig. 2
Fig. 2
Photon allocation in time gates: showing IRF (blue) of an S–D pair with corresponding overall TPSF (orange) after convolution with IRF. The photons that fall in the transparent yellow area of the convolved TPSF are allocated to the time gate with start time of 200 ps and gate width of 400 ps. The ratio of this yellow area to the area under the convolved TPSF (orange) was used to determine the photon counts per second for the time gate, as mentioned in Sec. 2.1.6.
Fig. 3
Fig. 3
The optical TD configuration. The amplified seed laser illuminated the phantom, one NW channel collects the TPSF and the second one collects the IRF. The readout data are transferred to the TDC cards and are analyzed via a processing unit.
Fig. 4
Fig. 4
Showing all the IRFs [all measured except (a)] at 765 nm and the corresponding TPSFs: (a) Gaussian IRF, (b) VisIR-FG with EOM, (c) VisIR-FG, (d) VisIR-RE with EOM, and (e) VisIR-RE.
Fig. 5
Fig. 5
IRFs [all measured except (a)] at 1064-nm excitation wavelengths: (a) Gaussian IRF, (b) 1064-NW with EOM, and (c) 1064-NW.
Fig. 6
Fig. 6
ToF distribution within tissue at different time gates with gate width of 300 ps for experimental IRFs at 765 nm and the “perfect” δ function IRF. Legend: solid blue for VisIR-FG with EOM, dotted blue for VisIR-FG, solid magenta for VisIR-RE with EOM, dotted magenta for VisIR-RE, and green shade for the δ function IRF.
Fig. 7
Fig. 7
Variation of β across times gates for different IRFs at 765 nm: (a) Gaussian IRF, (b) VisIR-FG with EOM, (c) VisIR-FG, (d) VisIR-RE with EOM, and (e) VisIR-RE.
Fig. 8
Fig. 8
Variation of β across times gates for different IRFs at 1064 nm: (a) Gaussian IRF, (b) 1064-NW with EOM, and (c) 1064-NW.
Fig. 9
Fig. 9
Intrinsic sensitivities across time gates for different IRFs at 765 nm: (a) Gaussian IRF, (b) VisIR-FG with EOM, (c) VisIR-FG, (d) VisIR-RE with EOM, and (e) VisIR-RE.
Fig. 10
Fig. 10
Intrinsic sensitivities across time gates for different IRFs at 1064 nm: (a) Gaussian IRF, (b) 1064-NW with EOM, and (c) 1064-NW.
Fig. 11
Fig. 11
CNR across time gates for different IRFs at 765 nm: (a) Gaussian IRF, (b) VisIR-FG with EOM, (c) VisIR-FG, (d) VisIR-RE with EOM, and (e) VisIR-RE.
Fig. 12
Fig. 12
CNR across time gates for different IRFs at 1064 nm: (a) Gaussian IRF, (b) 1064-NW with EOM, and (c) 1064-NW.
Fig. 13
Fig. 13
Sensitivity to change in extracerebral across time gates for different IRFs at 765 nm: (a) Gaussian IRF, (b) VisIR-FG with EOM, (c) VisIR-FG, (d) VisIR-RE with EOM, and (e) VisIR-RE.
Fig. 14
Fig. 14
Sensitivity to change in extracerebral across time gates for different IRFs at 1064 nm: (a) Gaussian IRF, (b) 1064-NW with EOM, and (c) 1064-NW.
Fig. 15
Fig. 15
FoM across time gates for different IRFs at 765 nm: (a) Gaussian IRF, (b) VisIR-FG with EOM, (c) VisIR-FG, (d) VisIR-RE with EOM, and (e) VisIR-RE.
Fig. 16
Fig. 16
FoM across time gates for different IRFs at 1064 nm: (a) Gaussian IRF, (b) 1064-NW with EOM, and (c) 1064-NW.
Fig. 17
Fig. 17
Comparison of FoM across various time gates for 1064-NW with EOM IRF at 1064 nm on human head model with (a) thicker extracerebral layer and (b) usual extracerebral layer.
Fig. 18
Fig. 18
Comparison of (a) β and (b) CoV across various time gates from the measurements (dotted lines) and the corresponding gates from the simulations (solid lines).

References

    1. Williams L. R., Leggett R. W., “Reference values for resting blood flow to organs of man,” Clin. Phys. Physiol. Meas. 10, 187 (1989).CPPMD510.1088/0143-0815/10/3/001 - DOI - PubMed
    1. Budohoski K. P., et al. , “Impairment of cerebral autoregulation predicts delayed cerebral ischemia after subarachnoid hemorrhage: a prospective observational study,” Stroke 43, 3230–3237 (2012).SJCCA710.1161/STROKEAHA.112.669788 - DOI - PubMed
    1. Jaeger M., et al. , “Continuous monitoring of cerebrovascular autoregulation after subarachnoid hemorrhage by brain tissue oxygen pressure reactivity and its relation to delayed cerebral infarction,” Stroke 38, 981–986 (2007).SJCCA710.1161/01.STR.0000257964.65743.99 - DOI - PubMed
    1. Tzeng Y.-C., Ainslie P. N., “Blood pressure regulation IX: cerebral autoregulation under blood pressure challenges,” Eur. J. Appl. Physiol. 114, 545–559 (2014).EJAPFN10.1007/s00421-013-2667-y - DOI - PMC - PubMed
    1. Dagal A., Lam A. M., “Cerebral blood flow and the injured brain: how should we monitor and manipulate it?” Curr. Opin. Anesthesiol. 24, 131–137 (2011).10.1097/ACO.0b013e3283445898 - DOI - PubMed