. 2021 Jul 9;3(3):fcab148.
doi: 10.1093/braincomms/fcab148. eCollection 2021.

Analysis of circulating protein aggregates as a route of investigation into neurodegenerative disorders

Affiliations

Analysis of circulating protein aggregates as a route of investigation into neurodegenerative disorders

Rocco Adiutori et al. Brain Commun. .

Abstract

Plasma proteome composition reflects the inflammatory and metabolic state of the organism and can be predictive of system-level and organ-specific pathologies. Circulating protein aggregates are enriched with neurofilament heavy chain-axonal proteins involved in brain aggregate formation and recently identified as biomarkers of the fatal neuromuscular disorder amyotrophic lateral sclerosis. Using unbiased proteomic methods, we have fully characterized the content in neuronal proteins of circulating protein aggregates from amyotrophic lateral sclerosis patients and healthy controls, with reference to brain protein aggregate composition. We also investigated circulating protein aggregate protein aggregation propensity, stability to proteolytic digestion and toxicity for neuronal and endothelial cell lines. Circulating protein aggregates separated by ultracentrifugation are visible as electron-dense macromolecular particles appearing as either large globular or as small filamentous formations. Analysis by mass spectrometry revealed that circulating protein aggregates obtained from patients are enriched with proteins involved in the proteasome system, possibly reflecting the underlying basis of dysregulated proteostasis seen in the disease, while those from healthy controls show enrichment of proteins involved in metabolism. Compared to the whole human proteome, proteins within circulating protein aggregates and brain aggregates show distinct chemical features of aggregation propensity, which appear dependent on the tissue or fluid of origin and not on the health status. Neurofilaments' two high-mass isoforms (460 and 268 kDa) showed a strong differential expression in amyotrophic lateral sclerosis compared to healthy control circulating protein aggregates, while aggregated neurofilament heavy chain was also partially resistant to enterokinase proteolysis in patients, demonstrated by immunoreactive bands at 171 and 31 kDa fragments not seen in digested healthy controls samples. Unbiased proteomics revealed that a total of 4973 proteins were commonly detected in circulating protein aggregates and brain, including 24 expressed from genes associated with amyotrophic lateral sclerosis. Interestingly, 285 circulating protein aggregate proteins (5.7%) were regulated (P < 0.05) and are present in biochemical pathways linked to disease pathogenesis and protein aggregation. Biologically, circulating protein aggregates from both patients and healthy controls had a more pronounced effect on the viability of hCMEC/D3 endothelial and PC12 neuronal cells compared to immunoglobulins extracted from the same plasma samples. Furthermore, circulating protein aggregates from patients exerted a more toxic effect than healthy control circulating protein aggregates on both cell lines at lower concentrations (P: 0.03, in both cases). This study demonstrates that circulating protein aggregates are significantly enriched with brain proteins which are representative of amyotrophic lateral sclerosis pathology and a potential source of biomarkers and therapeutic targets for this incurable disorder.

Keywords: biomarkers; neurodegeneration; neurofilaments; protein aggregates; proteomics.


Figures

Graphical Abstract
Graphical Abstract
Figure 1
Figure 1
Micrographs of circulating protein aggregates (CPAs) and brain protein aggregates (BPAs) taken by transmission electron microscopy. (A) grid micrograph after CPAs sample loading showing an amorphous globular formation with adjacent and/or superimposed smaller rounded particles (which may be formed of lipoproteins; cyan arrows). (B) grid micrograph of BPAs (left-hand side) showing amorphous electron-dense as well as short filamentous and small round formations (red and yellow arrows, respectively). (C) Details of filamentous and of donut-like particles detected in BPA micrographs (red and yellow arrows, respectively). (D, E, F) Micrograph grids of CPAs showing 13–20 nm thick and 70–360 nm long fragments. Scale bar on the lower right-hand corner of each micrograph.
Figure 2
Figure 2
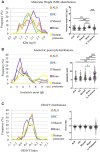
Aggregation propensity of proteins in blood and brain aggregates from ALS and HC compared to the Human proteome. Molecular weight (MW) (A), isoelectric point (pI) (B) and hydrophobicity (GRAVY index) (C), known to affect aggregation propensity of proteins, are compared across those expressed only in ALS and HC CPAs (ALS and HC, respectively), those shared between ALS and HC CPA datasets (shared), those within brain aggregates (brain) and in the entire human proteome. The distribution plots show the dispersion of the samples with relative frequency, while the violin plots show median and interquartile ranges of the measures. Statistical analysis was performed using one-way ANOVA, Kruskal–Wallis test with Dunn's multiple comparison as post-test for group analysis (*: P = 0.0251; ****: P < 0.0001); proteins listed in Supplementary Files Protein list.
Figure 3
Figure 3
Western blot analysis of neurofilament heavy chain (NfH) within circulating (CPAs) and brain (BPAs) protein aggregates after proteases digestion. (A) shows a 49 kDa band uniformly expressed across samples and additional 171 and 31 kDa bands only in ALS patients (blue arrows). (B) Undigested NfH in ALS brain protein aggregates (BPAs; lane 1) and after digestion with chymotrypsin (lane 2), enterokinase (lane 3), calpain (lane 4) and brain lysate lane 5. To maximize band visualization, time exposure was for lane 1 at 10.1 s, lane 4 and 5 at 58.4 s and lane 2 and 3 at 278.8 s. See Supplementary information for full-size blots.
Figure 4
Figure 4
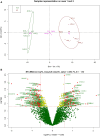
TMTcalibrator™ proteomic analysis. (A) Principal component analysis (PCA) showing a separation between the ALS and HC experimental groups regulated features at protein level. Dimension 1 or the variance between the two experimental groups (ALS and HC) is 41.17% of the entire variance; dimension 2 or variance between 10plexes (TMT01 and TMT02) is 9.45% of the entire variance. (B) The volcano plot shows the distribution of the proteins identified by TMT proteomic study according to their fold change (FC) expressed as log2 (fold change ALS/HC) (logFC) in the x-axis and according to P-value expressed as –log10 (P-value) in the y-axis. Protein groups were considered regulated if P-value < 0.05 and logFC < −0.58 or > 0.58. Red dots are regulated features, yellow dots are features with a significant P-value (P < 0.05) and logFC between −0.58 and 0.58 while green dots are not regulated protein groups (P > 0.05). Uniprot IDs are reported beside the dots with significant P-value.
Figure 5
Figure 5
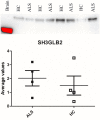
Western blot analysis of Endophilin-B2 (SH3GLB2) in plasma CPAs from ALS patients and healthy controls. Samples were normalized to HC density and the average values with relative standard deviation for the ALS (n = 4) and Control (n = 4) groups were plotted onto the chart. A brain lysate sample is also included (1st lane, red band, indicating signal saturation) which showed an endophilin-B2 band at a lower molecular weight than the bands detected in CPAs. Immunodetection confirmed the SH3GLB2 higher level of expression in the ALS CPAs compared to control (logFC = 0.34), but no statistically significant regulation (P = 0.57). As stated in the materials and methods section, no loading control was included for lack of constitutively expressed proteins in CPAs, as well as differential regulation presented in ALS literature for those proteins normally used in plasma and serum western blotting (e.g. albumin, transferrin, etc.). See Supplementary information for full-sizeblots.
Figure 6
Figure 6
Cell viability after treatment with aggregates, solubilized aggregates and immunoglobulins extracted from plasma samples. The figure shows the percentage of endothelial (hCMEC/D3) and PC12 living cells (A and B) after treatment with different concentrations of CPAs and IgG from ALS and HC. Cells treated with ALS CPAs showed a statistically significant lower cell viability compared to HC CPAs treated cells at 0.05 µg/ml (P = 0.031; endothelial cells, A) and at 0.1 µg/ml (P = 0.029; PC12 cells, B). IgG had minor effect on all cell type viability with no difference between ALS and HC. CPA proteins were solubilized with 8 M urea before PC12 cells treatment. Significance was tested by two-way ANOVA and Tukey HSD test.

References

    1. Lee S, Kim HJ.. Prion-like mechanism in amyotrophic lateral sclerosis: Are protein aggregates the key? Exp Neurobiol. 2015;24(1):1–7. - PMC - PubMed
    1. Polymenidou M, Cleveland DW.. The seeds of neurodegeneration: Prion-like spreading in ALS. Cell. 2011;147(3):498–508. - PMC - PubMed
    1. Friedrich RP, Tepper K, Rönicke R, et al.Mechanism of amyloid plaque formation suggests an intracellular basis of Abeta pathogenicity. Proc Natl Acad Sci U S A. 2010;107(5):1942–1947. - PMC - PubMed
    1. Lu CH, Macdonald-Wallis C, Gray E, et al.Neurofilament light chain: A prognostic biomarker in amyotrophic lateral sclerosis. Neurology. 2015;84(22):2247–2257. - PMC - PubMed
    1. Lu CH, Petzold A, Topping J, et al.Plasma neurofilament heavy chain levels and disease progression in amyotrophic lateral sclerosis: Insights from a longitudinal study. J Neurol Neurosurg Psychiatry. 2015;86(5):565–573. - PMC - PubMed

LinkOut - more resources