. 2021:4:163-176.
doi: 10.1016/j.crphys.2021.03.005. Epub 2021 Apr 1.

Effect of crista morphology on mitochondrial ATP output: A computational study

Affiliations

Effect of crista morphology on mitochondrial ATP output: A computational study

Nasrin Afzal et al. Curr Res Physiol. 2021.

Abstract

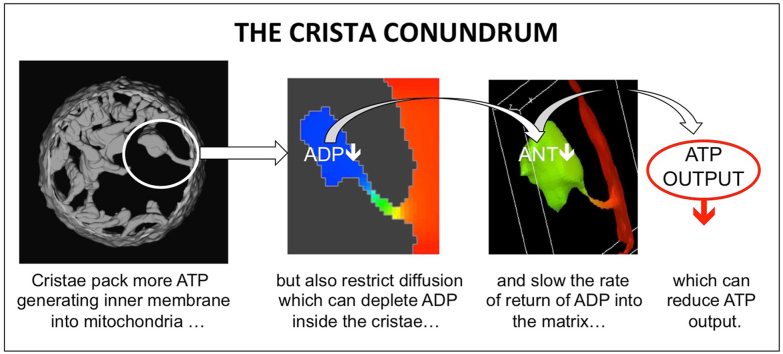
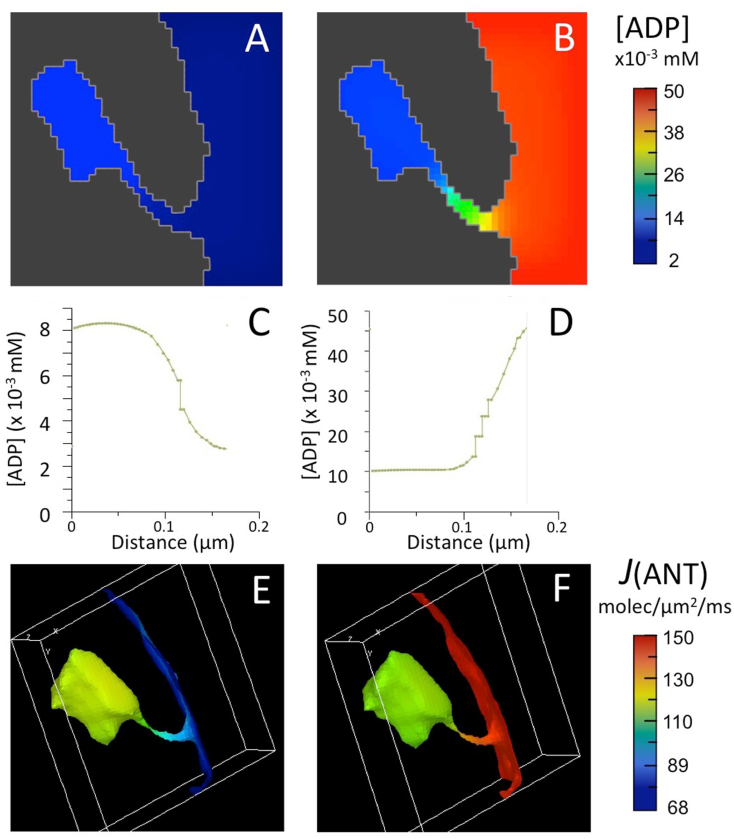
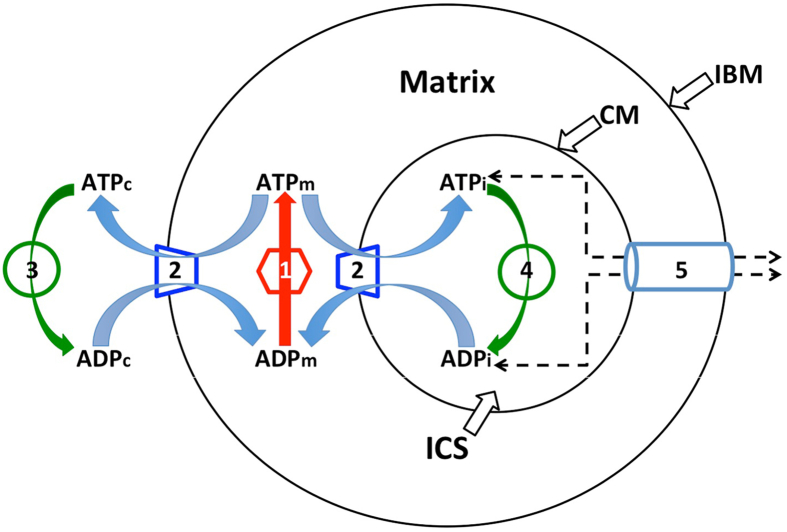
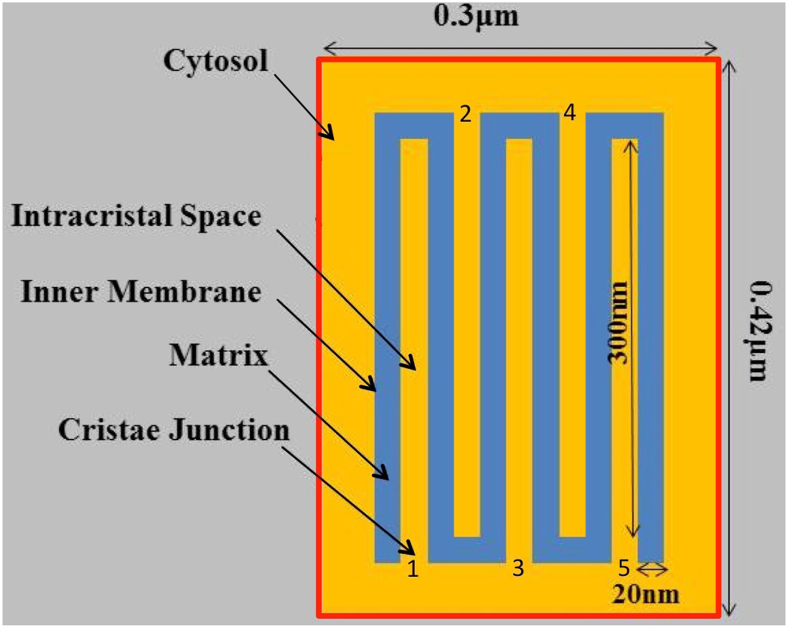
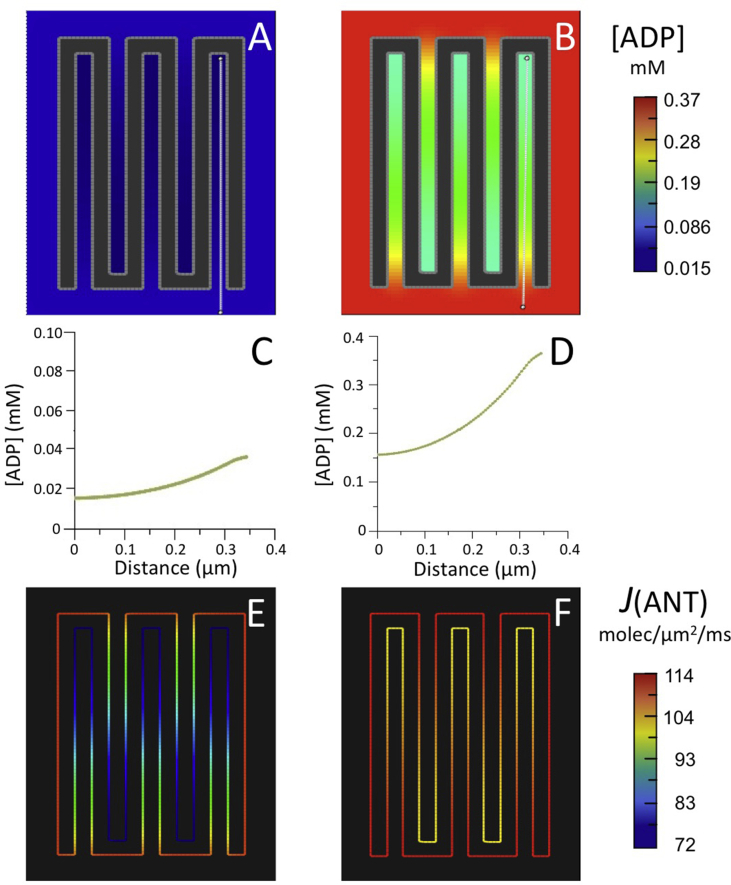
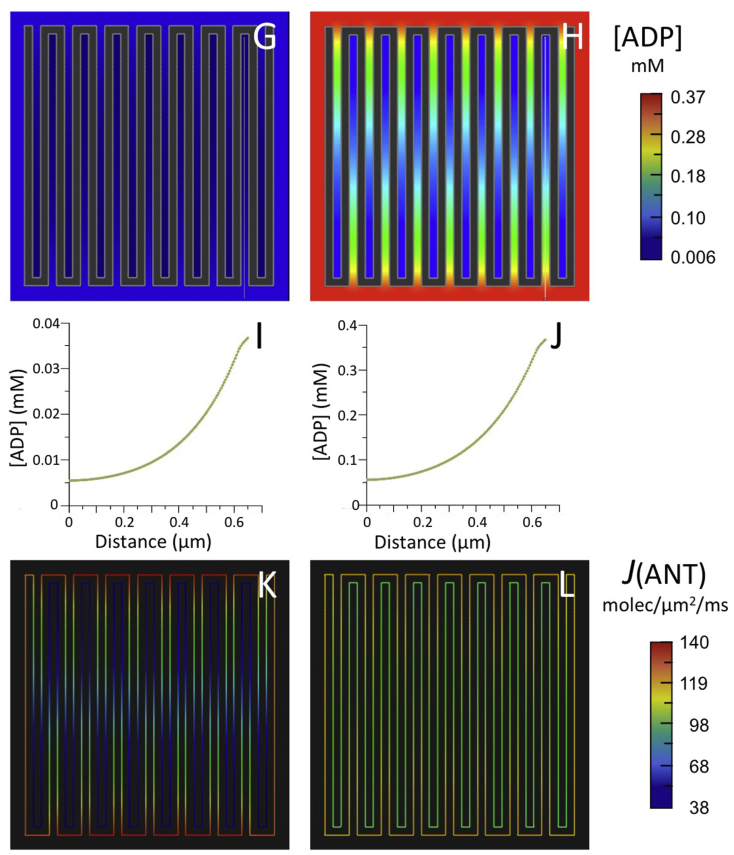
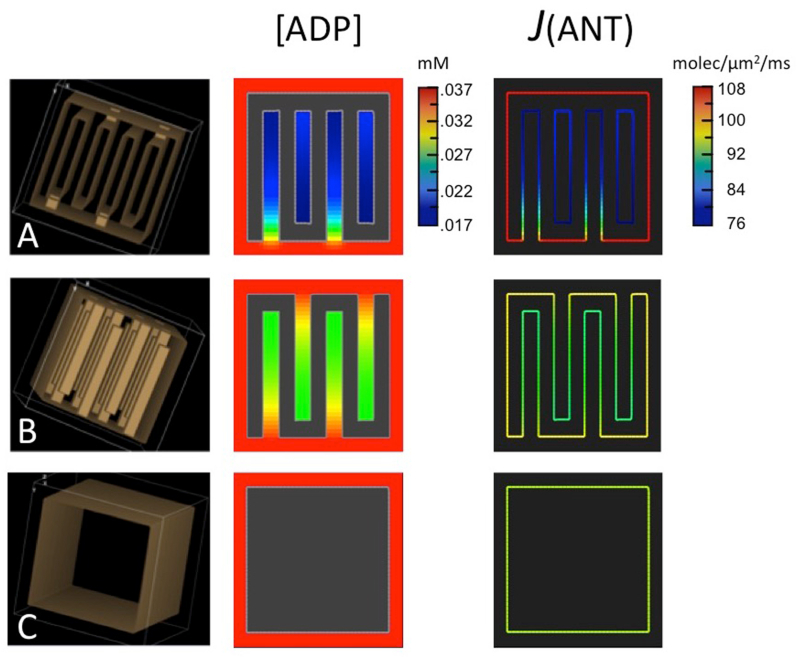
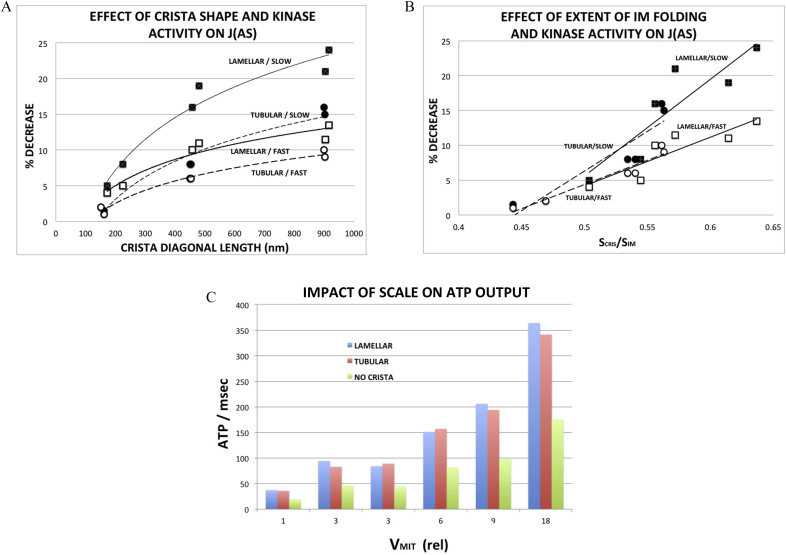
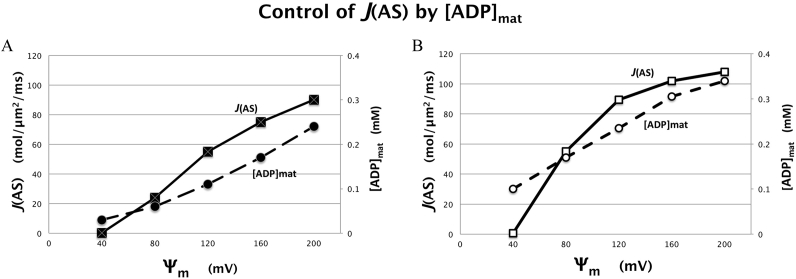
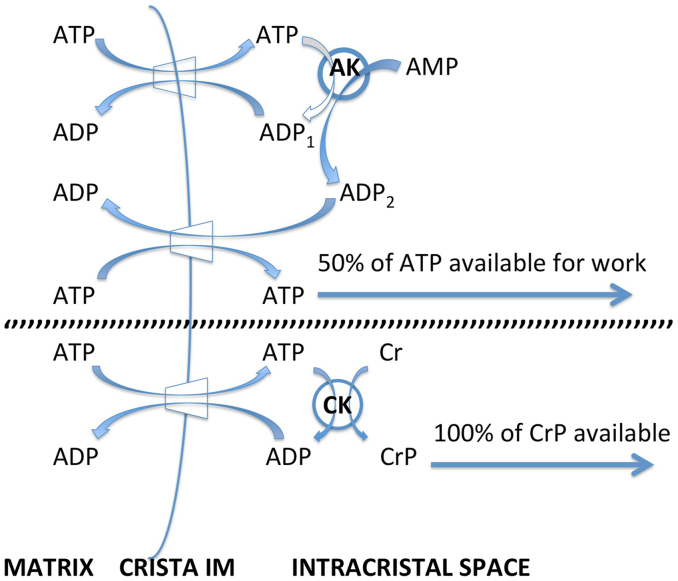
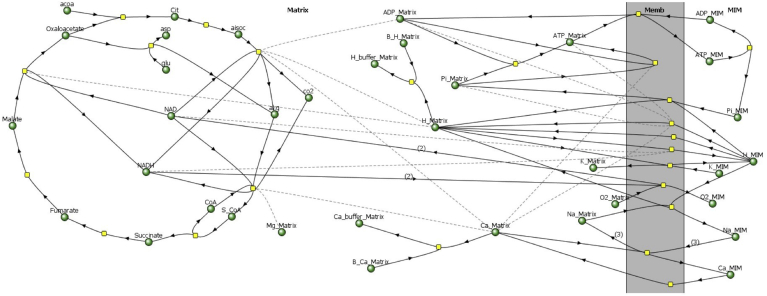
Folding of the mitochondrial inner membrane (IM) into cristae greatly increases the ATP-generating surface area, S IM, per unit volume but also creates diffusional bottlenecks that could limit reaction rates inside mitochondria. This study explores possible effects of inner membrane folding on mitochondrial ATP output, using a mathematical model for energy metabolism developed by the Jafri group and two- and three-dimensional spatial models for mitochondria, implemented on the Virtual Cell platform. Simulations demonstrate that cristae are micro-compartments functionally distinct from the cytosol. At physiological steady states, standing gradients of ADP form inside cristae that depend on the size and shape of the compartments, and reduce local flux (rate per unit area) of the adenine nucleotide translocase. This causes matrix ADP levels to drop, which in turn reduces the flux of ATP synthase. The adverse effects of membrane folding on reaction fluxes increase with crista length and are greater for lamellar than tubular crista. However, total ATP output per mitochondrion is the product of flux of ATP synthase and S IM which can be two-fold greater for mitochondria with lamellar than tubular cristae, resulting in greater ATP output for the former. The simulations also demonstrate the crucial role played by intracristal kinases (adenylate kinase, creatine kinase) in maintaining the energy advantage of IM folding.

Keywords: ATP synthesis; Computational modeling; Cristae; Energy metabolism; Kinases; Mitochondria.


Conflict of interest statement

Declaration of competing interest The authors declare that they have no known competing financial interests or personal relationships that could have appeared to influence the work reported in this paper.

Figures

Image 1
Graphical abstract
Fig. 1
Fig. 1
Results of computer simulations run with complete BioModel for mitochondrial energy metabolism and 3D spatial model for a crista, as described in text. (A,B) Maps of ADP concentration, [ADP], outside matrix for initial [ADP] of 0.002 ​mM (A) and 0.05 ​mM (B). (C,D) Plots of [ADP] from a point distal to the crista junction opening to a point proximal to the opening in (A) and (B), respectively. (E,F) Maps of ANT flux, J(ANT), on the inner membrane corresponding to the [ADP] maps of (A,B).
Fig. 2
Fig. 2
Schematic diagram of the “reduced BioModel” for biochemical reactions directly involved in ATP ⇔ ADP “cycling” and transport. There are five processes involved: (1) the ATP synthase, shown as a matrix activity since it occurs on the matrix-facing surface of the inner membrane; (2) the adenine nucleotide translocator, ANT, which can occur either on the peripheral region of the inner membrane (the inner boundary membrane, IBM) or on the internal folds (crista membrane regions, CM, collectively represented as a single crista for simplictly); (3) the surrogate kinase activity in the cytosol and (4) the surrogate kinase activity inside cristae (the intracristal space, ICS, represented as a single compartment for simplicity). Process (5) is an implicit diffusion step, representing restricted movement of adenine nucleotides between cristae and cytosol through crista junctions, collectively represented by a tube connecting IBM and CM. In Virtual Cell, diffusion of metabolites is computed between adjacent volume elements; with the crista junction openings creating diffusional bottlenecks between cytosol and each crista compartment. Subscripts on ADP and ATP: m, matrix; c, cytosol; i, intracristal space.
Fig. 3
Fig. 3
Idealized 2D spatial model of a mitochondrion with 5 cristae and no outer membrane. The matrix space is blue and the space outside the matrix (intracristal or cytosolic) is yellow. Cristae are numbered 1 through 5 ​at the crista junction openings.
Fig. 4
Fig. 4
Results of computer simulations using the reduced BioModel for mitochondrial energy metabolism (Fig. 2) with (A–F) the 5-crista 2D spatial model of Fig. 3 and (G–L) a larger 15-crista 2D model, as described in text. (A,B; G,H) Maps of steady state ADP concentration, [ADP], outside matrix for initial [ADP] of 0.037 ​mM (A,G) and 0.370 ​mM (B,H). (C,D; I,J) Plots of [ADP] along the white lines (from distal to proximal relative to the crista junctions) in the maps of (A,B; G,H), respectively. (E,F; K,L) Maps of ANT flux, J(ANT), along the inner membrane corresponding to the conditions of (A,B; G,H), respectively.
Fig. 4
Fig. 4
Results of computer simulations using the reduced BioModel for mitochondrial energy metabolism (Fig. 2) with (A–F) the 5-crista 2D spatial model of Fig. 3 and (G–L) a larger 15-crista 2D model, as described in text. (A,B; G,H) Maps of steady state ADP concentration, [ADP], outside matrix for initial [ADP] of 0.037 ​mM (A,G) and 0.370 ​mM (B,H). (C,D; I,J) Plots of [ADP] along the white lines (from distal to proximal relative to the crista junctions) in the maps of (A,B; G,H), respectively. (E,F; K,L) Maps of ANT flux, J(ANT), along the inner membrane corresponding to the conditions of (A,B; G,H), respectively.
Fig. 5
Fig. 5
Results of computer simulations run using the reduced BioModel for mitochondrial energy metabolism and 3D spatial models, as described in text. Rows correspond to spatial models with (A) lamellar, (B) tubular and (C) no cristae, respectively, shown in first box of each row. The second and third boxes in each row are slices from 3D maps of ADP concentration, [ADP], outside matrix and of ANT flux, J(ANT), on the inner membrane for each model at steady state.
Fig. 6
Fig. 6
Effects of inner membrane morphology and surrogate kinase activity on (A,B) flux of ATP synthase, J(AS) and (C) ATP output. qATP. Graphs summarize results of computer simulations run with reduced BioModel and 3D spatial models (Fig. 5) of increasing size, as described in text. (A) Decrease in J(AS) as a function of crista length, calculated as the diagonal from the center of the junction opening to the farthest corner of the crista surface. Data for lamellar crista are represented by and tubular cristae by ◯; closed symbols correspond to the smaller forward rate constant for the surrogate kinase (kf ​= ​0.003 ms−1) and open symbols to a three fold larger rate constant (kf ​= ​0.009 ms−1), labelled “slow” and “fast”, respectively. Solid trend lines correspond to data for lamellar cristae and dashed trend lines for tubular cristae. (B) Decrease in J(AS) as a function of extent of inner membrane folding; symbols and trend lines as in (A). (C) ATP output, qATP ​= ​J(AS) × inner membrane area, as a function of relative model volume (largest volume ​= ​0.099 ​μm3). There are two models with three fold volume increase (i.e., VMIT ​= ​3) relative to the original. Data on left corresponds to model with threefold larger crista width (z × 3); data on right to threefold larger crista length (y × 3).
Fig. 7
Fig. 7
Correlation between steady state flux of ATP synthase, J(AS), and the concentration of ADP in the matrix, [ADP]MAT for computer simulations as in Fig. 4G (15-crista 2D model) for varying membrane potential (Ψm, negative sign not shown). (A) Results for “slow” surrogate kinase reaction (kf ​= ​0.003 ​ms−1). (B) Results for “fast” surrogate kinase reaction (kf ​= ​0.07 ​ms−1).
Fig. 8
Fig. 8
Diagram for recycling of ADP and ATP inside cristae by adenylate kinase, AK (top scheme) and creatine kinase, CK (bottom). ANT is represented by the trapezoid symbol on the inner membrane, IM. Other abbreviations: Cr, creatine, CrP, creatine phosphate.
Fig. 1
Fig. 1
Diagram of the complete BioModel for mitochondrial energy metabolism used for simulations in Virtual Cell. Reaction pathways (solid arrows) are represented in terms of chemical species (metabolites, ions and buffers; green circles), and enzymes or transporters (yellow squares), based on the model of Nguyen et al. (2007). Effectors are connected to enzymes by dashed lines. The reactions occur in two compartments, the Matrix (left) and the space outside the matrix (right, MIM), and on the mitochondrial inner membrane (Memb) that separates them. Other non-standard abbreviations: acoa, acetyl Coenzyme A; aisoc, iso-citrate; akg, α-ketoglutarate; asp, aspartate; B_Ca, Ca2+ bound to calcium buffer (Ca_buffer); B_H, H+ bound to proton buffer (H_buffer); Cit, citrate; co2, carbon dioxide; glu, glutamate; O2, dioxygen; S_CoA, succinyl Coenzyme A.

References

    1. Aliev M.K., Saks V.A. Compartmentalized energy transfer in cardiomyocytes: use of mathematical modeling for analysis of in vivo regulation of respiration. Biophys. J. 1997;73:428–445. doi: 10.1016/s0006-3495(97)78082-2. - DOI - PMC - PubMed
    1. Allbritton N.L., Meyer T., Stryer L. Range of messenger action of calcium ion and inositol 1,4,5-trisphosphate. Science. 1992;258:1812. doi: 10.1126/science.1465619. - DOI - PubMed
    1. Balaban R.S. Metabolic homeostasis of the heart. J. Gen. Physiol. 2012;139:407–414. doi: 10.1085/jgp.201210783. - DOI - PMC - PubMed
    1. Chen C., Ko Y., Delannoy M., Ludtke S.J., Chiu W., Pedersen P.L. Mitochondrial ATP synthasome: three-dimensional structure by electron microscopy of the ATP synthase in complex formation with carriers for Pi and ADP/ATP. J. Biol. Chem. 2004;279:31761–31768. doi: 10.1074/jbc.M401353200. - DOI - PubMed
    1. Cogliati S., Enriquez J.A., Scorrano L. Mitochondrial cristae: where beauty meets functionality. Trends Biochem. Sci. 2016;41:261–273. doi: 10.1016/j.tibs.2016.01.001. - DOI - PubMed

LinkOut - more resources