. 2019 Jul 10;1(1):84-102.
doi: 10.1016/j.jaccao.2019.06.003. eCollection 2019 Sep.

Prokineticin Receptor-1 Signaling Inhibits Dose- and Time-Dependent Anthracycline-Induced Cardiovascular Toxicity Via Myocardial and Vascular Protection

Affiliations

Prokineticin Receptor-1 Signaling Inhibits Dose- and Time-Dependent Anthracycline-Induced Cardiovascular Toxicity Via Myocardial and Vascular Protection

Adeline Gasser et al. JACC CardioOncol. .

Abstract

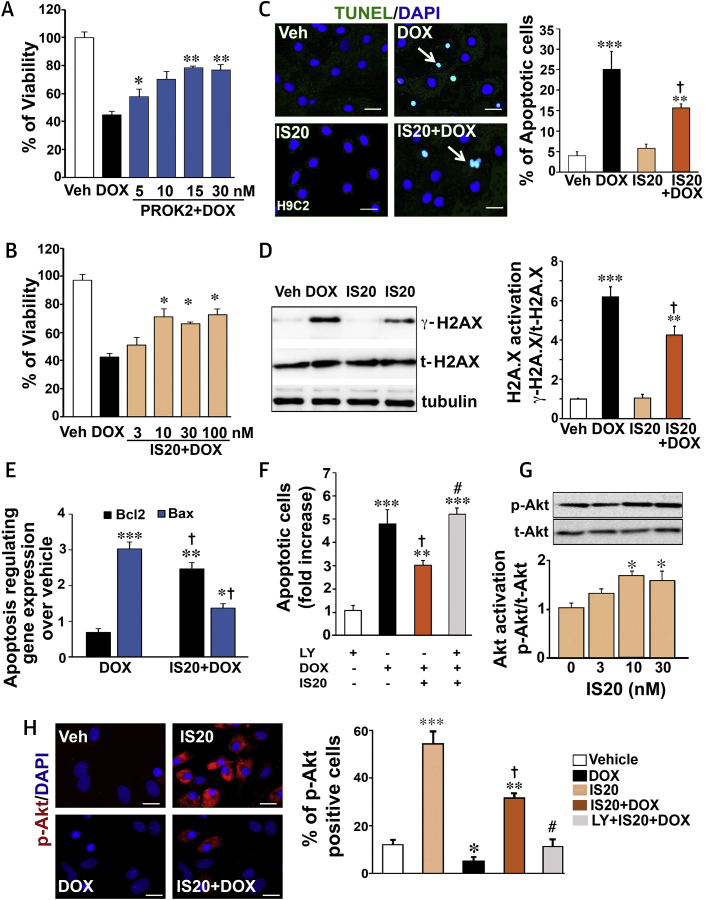
Objectives: This study investigated how different concentrations of doxorubicin (DOX) can affect the function of cardiac cells. This study also examined whether activation of prokineticin receptor (PKR)-1 by a nonpeptide agonist, IS20, prevents DOX-induced cardiovascular toxicity in mouse models.

Background: High prevalence of heart failure during and following cancer treatments remains a subject of intense research and therapeutic interest.

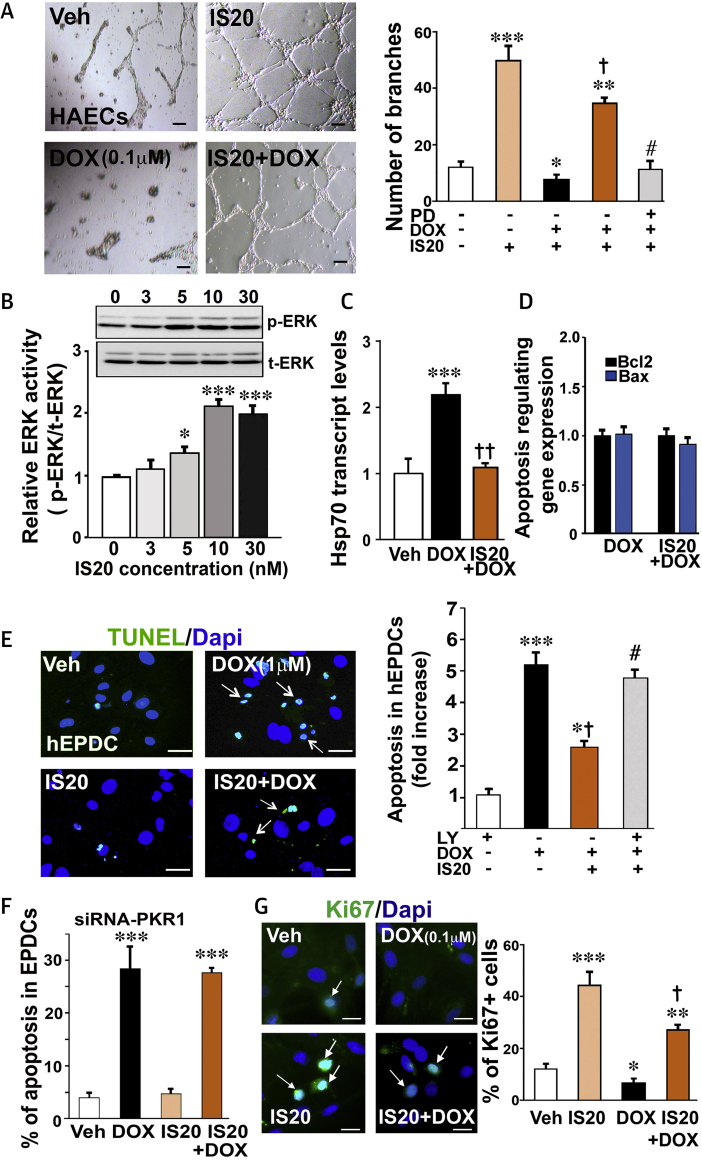
Methods: This study used cultured cardiomyocytes, endothelial cells (ECs), and epicardium-derived progenitor cells (EDPCs) for in vitro assays, tumor-bearing models, and acute and chronic toxicity mouse models for in vivo assays.

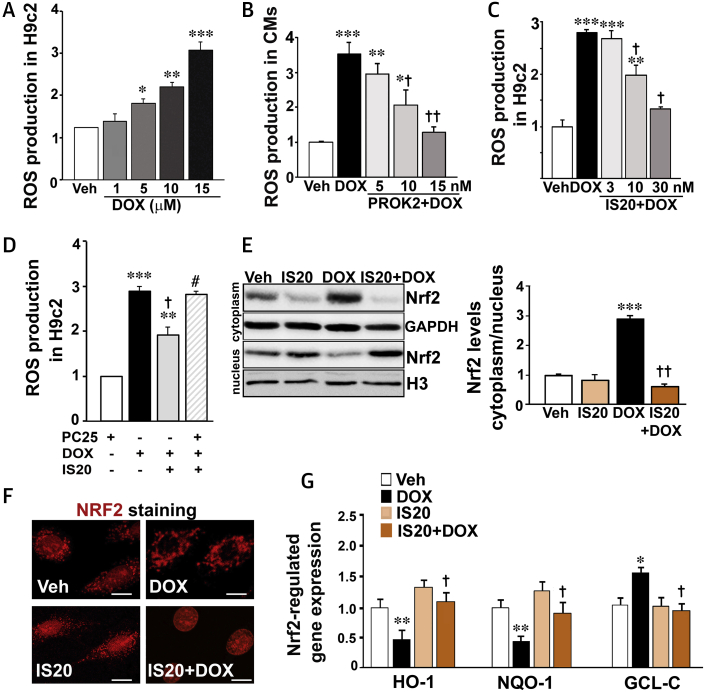
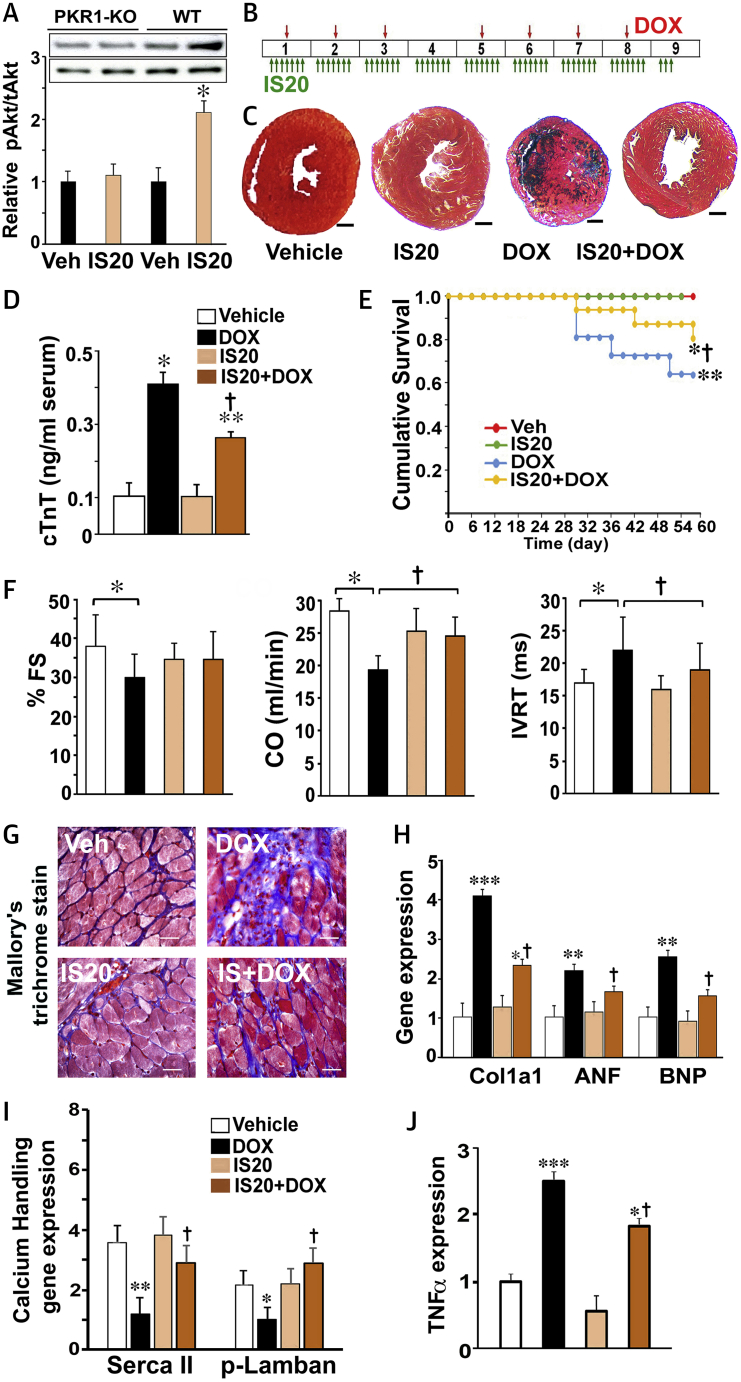
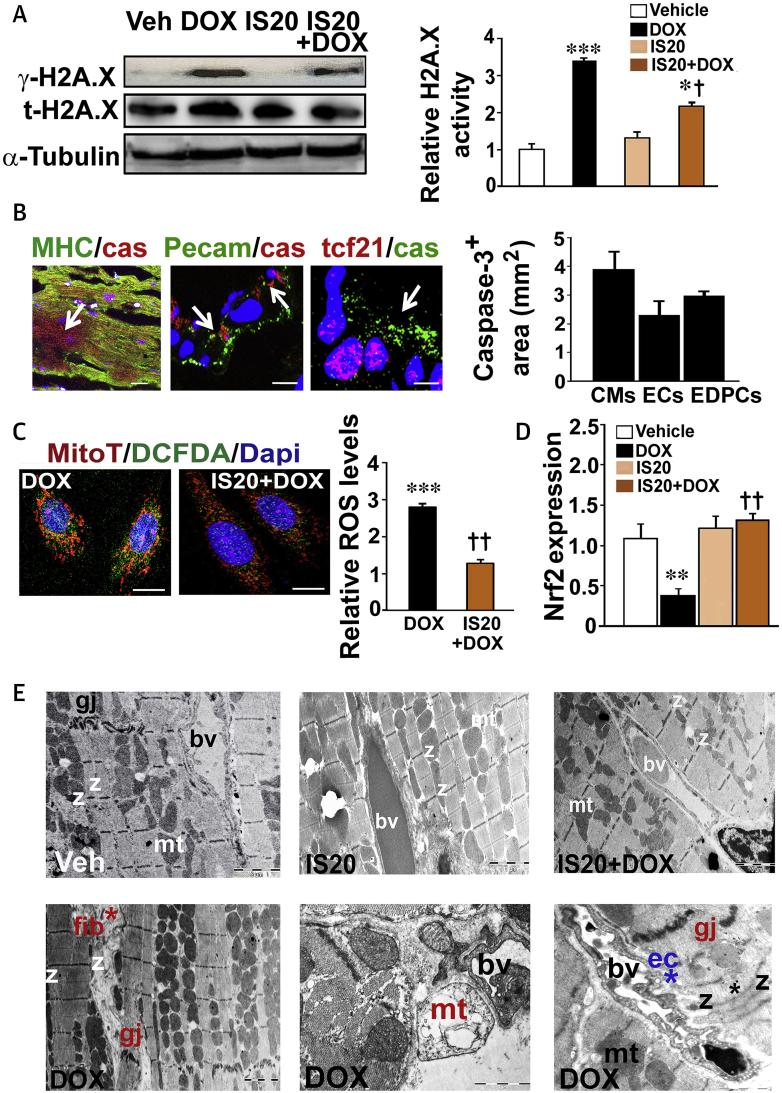
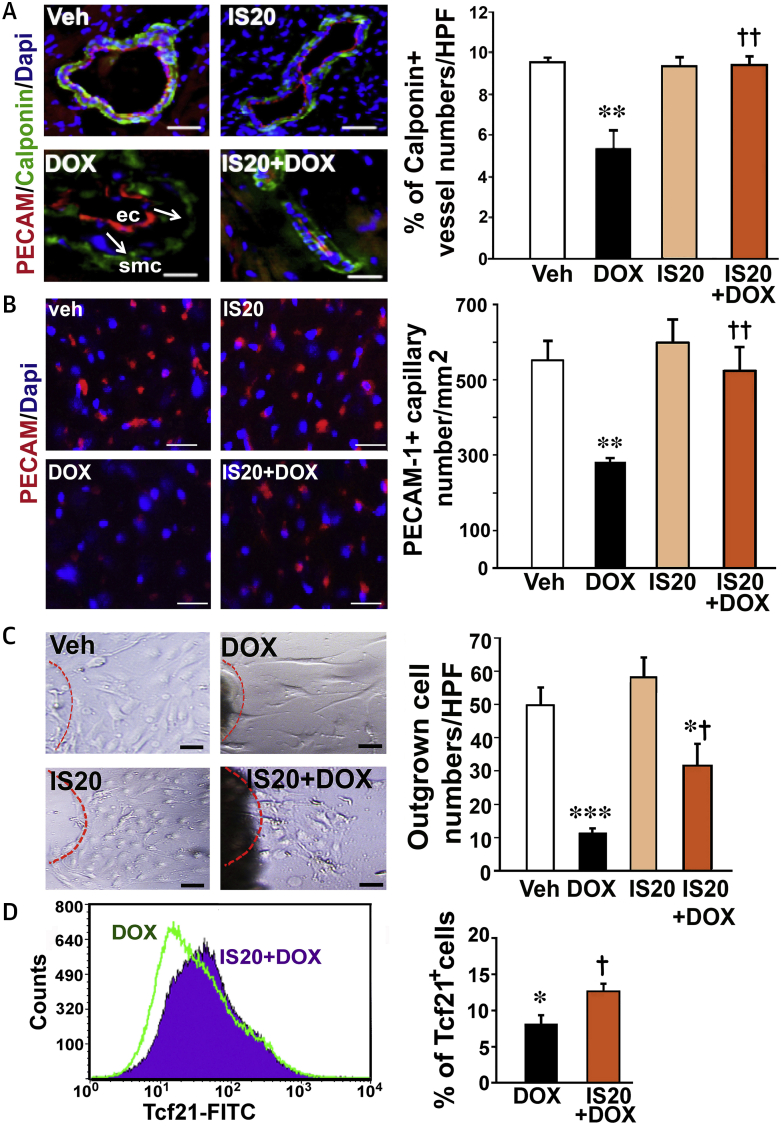
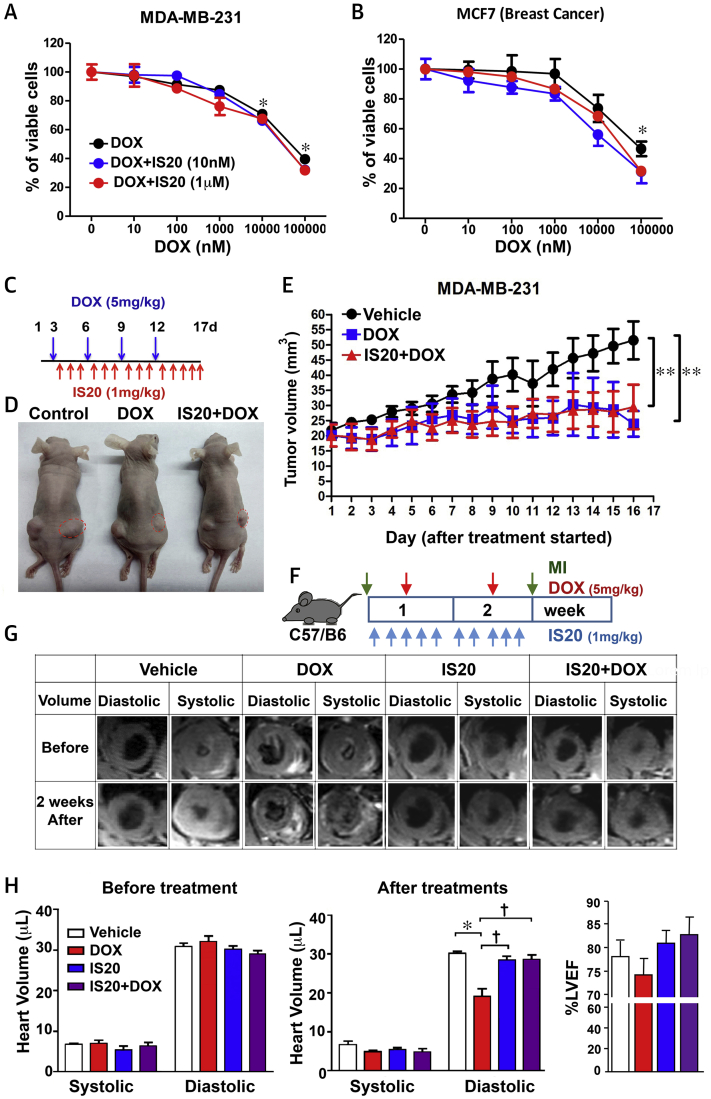
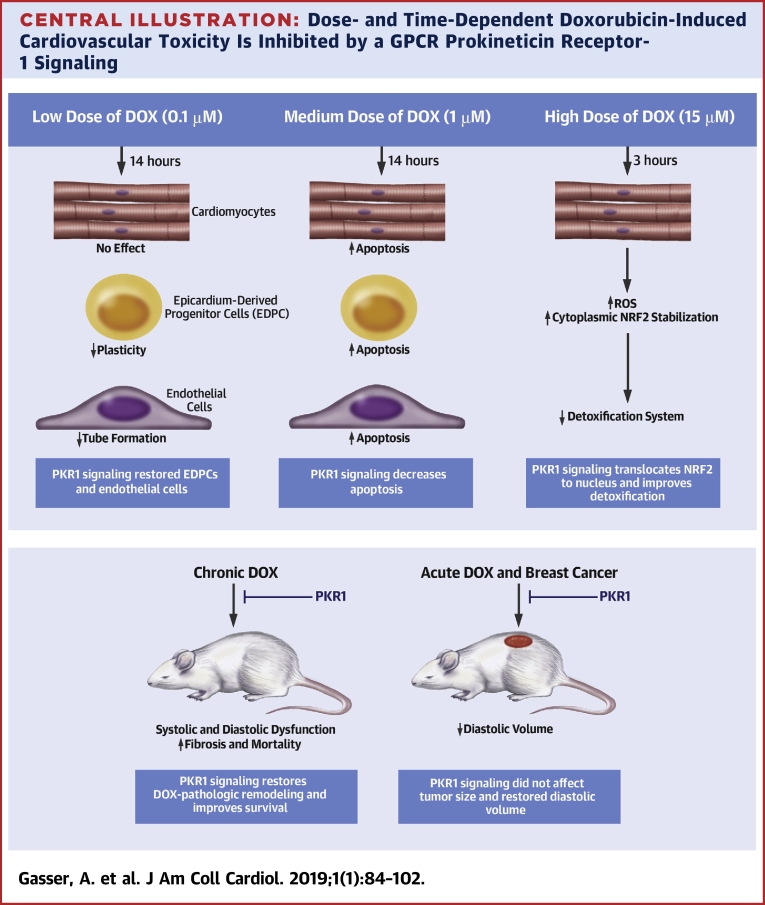
Results: Brief exposure to cardiomyocytes with high-dose DOX increased the accumulation of reactive oxygen species (ROS) by inhibiting a detoxification mechanism via stabilization of cytoplasmic nuclear factor, erythroid 2. Prolonged exposure to medium-dose DOX induced apoptosis in cardiomyocytes, ECs, and EDPCs. However, low-dose DOX promoted functional defects without inducing apoptosis in EDPCs and ECs. IS20 alleviated detrimental effects of DOX in cardiac cells by activating the serin threonin protein kinase B (Akt) or mitogen-activated protein kinase pathways. Genetic or pharmacological inactivation of PKR1 subdues these effects of IS20. In a chronic mouse model of DOX cardiotoxicity, IS20 normalized an elevated serum marker of cardiotoxicity and vascular and EDPC deficits, attenuated apoptosis and fibrosis, and improved the survival rate and cardiac function. IS20 did not interfere with the cytotoxicity or antitumor effects of DOX in breast cancer lines or in a mouse model of breast cancer, but it did attenuate the decreases in left ventricular diastolic volume induced by acute DOX treatment.

Conclusions: This study identified the molecular and cellular signature of dose-dependent, DOX-mediated cardiotoxicity and provided evidence that PKR-1 is a promising target to combat cardiotoxicity of cancer treatments.

Keywords: DMSO, dimethyl sulfoxide; EC, endothelial cell; EDPC, epicardium-derived progenitor cell; EF, ejection fraction; FS, fractional shortening; GPCR, G-protein–coupled receptor; HAEC, human aortic endothelial cell; HF, heart failure; HFrEF, heart failure with reduced ejection fraction; MAPK, mitogen-activated protein kinase; NRF2, nuclear factor, erythroid 2 like 2 (also known as NFE2L2); PECAM, platelet and endothelial cell adhesion molecule; PKR1, prokineticin receptor-1 (also known as PROKR1); PKR1-KO, prokineticin receptor 1 knockout mice; PROK1, prokineticin 1; PROK2, prokineticin 2; TUNEL, terminal deoxynucleotidyl transferase deoxyuridine triphosphate nick end labeling; breast cancer; doxorubicin; endothelial dysfunction; epicardial progenitor cells; heart failure.


Figures

None
Graphical abstract
Figure 1
Figure 1
DOX (Medium Concentration)-Induced Cardiomyocyte Death Is Alleviated by PKR1 Signaling (A) The rat H9C2 cardiomyocyte line was subjected to vehicle (Veh; phosphate buffered saline [PBS]) or doxorubicin (DOX) (1 μM 24 h) in the absence or presence of different concentrations of prokineticin-2 (PROK2, 10 h) to address the cardioprotective effect of the endogenous ligand of PKR1 (n = 3 to 5). (B) Same as in A, except cells were exposed to a chemical agonist of PKR1, IS20. (C) Terminal deoxynucleotidyl transferase deoxyuridine triphosphate nick end labeling (TUNEL) staining of apoptotic H9c2 cells treated with DOX (1 μM, 14 h) in the presence or absence of IS20 or vehicle (dimethyl sulfoxide [DMSO]). Confocal images of the TUNEL-positive (green) cell population in the total cell population (4′,6-diamidino-2-phenylindol [DAPI]-positive, blue) are shown in the left panel; quantitative analyses of images (250 to 400 cells across 3 independent experiments) are shown in the histogram (right panel). Scale bar is 25 μm. (D) In the same setting as for TUNEL analyses (C), cell lysates were probed with antibodies for phosphorylated H2A.X (γ-H2A.X) or total H2A.X (t-H2A.X) and tubulin (left panel). The histogram (right panel) shows quantitative analyses of phosphorylated H2A.X, normalized by total H2A.X and tubulin (n = 4). (E) Quantitative reverse transcription polymerase chain reaction (qRT-PCR) quantification of the expression level of the apoptosis-regulating genes (Bcl2 and Bax) over vehicle (n = 4 to 6). (F) Quantification of apoptotic cells in the same experimental setting as in (C), with some cells pre-treated with the phosphoinositide 3 kinase (PI3K)/serin threonin protein kinase B (Akt) inhibitor LY294002 (LY; 1 μM) 1 h before IS20 and DOX treatments (n = 3 to 5). (G) Cell lysates from H9c2 cells treated with different concentrations of IS20 for 10 min were probed with AKT antibodies (phosphorylated [p-AKT] or total [t-AKT]) (upper panel). The histogram at the bottom shows quantification of AKT activity from 3 to 4 independent experiments. (H) p-AKT immunostaining of primary neonatal cardiomyocytes treated as in B. Confocal images of the p-AKT–positive (red) cell population with the total cell number (DAPI-positive, blue) shown in the right panel and quantitative analyses of images (250 to 400 cells across 3 independent experiments) in the histogram (right panel). Scale bar is 50 μm. All data are presented as mean ± SEM. *p < 0.05, **p < 0.01, and ***p < 0.001 versus vehicle; †p < 0.05 versus DOX; #p < 0.05 versus IS20 + DOX. Source data for this figure are available in the Supplemental Appendix.
Figure 2
Figure 2
DOX (High Concentration)-Induced ROS production in Cardiomyocytes Mitigated by PKR1 Signaling (A) Different concentration of DOX-mediated ROS accumulation in H9c2 cardiomyocytes. (B) Primary cardiomyocytes were subjected to vehicle (PBS) or DOX (15 μM, 3 h) in absence or presence of different concentrations of PROK2 and ROS production was detected by 2',7'-dichlorofluorescin diacetate (DCFDA; n = 4). (C) H9c2 cells were subjected to vehicle (0.1% DMSO) or DOX (15 μM 3 h) in absence or presence of different concentrations of IS20 (16 h), and ROS production was detected by DCFDA (n = 4). (D) ROS production was detected by DCFDA in H9c2 cells treated as in C, some cells pre-treated with the PKR1 inhibitor PC25 (30 nM) 1 h before IS20 and DOX treatments (n = 4). (E) Cytosolic and nuclear cell lysates from H9C2 cells treated as in B were probed with the indicated antibodies (left panel). The histogram shows quantification of nuclear versus cytoplasmic NRF2 (n = 3). (F) Immunostaining of H9c2 cells with NRF2 antibody after treatments as in B (n = 3). Scale bar is 50 μm. (G) qRT-PCR quantification of the expression levels of NRF2-regulated genes (Hmox1, Nqo1, Gclc) in H9c2 cells treated as in B from 3 to 5 independent experiments. All data are expressed as mean ± SEM. *p < 0.05, **p < 0.01, and ***p < 0.001 versus vehicle; †p < 0.05 and ††p < 0.01 versus DOX; #p < 0.05 versus IS20 + DOX, n = 3 to 4 hearts for each group. Source data for this figure is available in the Supplemental Appendix. GAPDH = glyceraldehyde 3-phosphate dehydrogenase; Gclc = γ-glutamyl cysteine synthetase catalytic subunit; H3 = histone H3; Hmox1 = heme oxygenase 1; Nqo1 = NAD(P)H quinone oxidoreductase 1; ROS = reactive oxygen species; other abbreviations as in Figure 1.
Figure 3
Figure 3
IS20 Prevents DOX-Induced Impairments in the ECs and hEPDCs (A) Human aortic endothelial cells (HAECs) were subjected to vehicle (0.1% DMSO) or DOX (0.1 μM, 14 h) 10 h after IS20 pre-treatment on Matrigel. (Left) Images and (right) quantification of tube formation of HAECs on Matrigel after treatment histogram. Pre-treatment of the cells with PD98056 (1 μM) before IS20 pre-treatment completely blocked the effect of IS20 (6 wells from 3 different experiments). (B) Cell lysates from HAECs treated with different concentration of IS20 for 10 min were probed with extracellular signal-related kinase (ERK1/2) antibodies (left panel). Quantification of phosphorylated ERK1/ERK2 (p-ERK) normalized by total ERK1/ERK2 (t-ERK) is shown in the bottom panel (n = 3). (C) qRT-PCR quantification of the expression level of the heat shock protein 70 (Hsp70) as a marker of endothelial dysfunction from 3 to 6 independent experiments in the settings described in A (n = 3). (D) qRT-PCR quantification of the expression level of the apoptosis-regulating genes (BCL2 and BAX) from 3 to 6 independent experiments in the settings described in A (n = 3). (E) TUNEL staining of apoptotic human epicardial progenitor cells (hEPDCs) treated with DOX (1 μM, 14 h) in the presence or absence of IS20 or vehicle (DMSO). Confocal images of TUNEL positive (green) cell population in the total cell population (DAPI-positive, blue) are shown on the left, and quantitative analyses of images (250 to 400 cells across 3 independent experiments) are shown in the histogram (right). Scale bar is 25 μm. (F) Same as in E, but the PKR1 gene was downregulated by short interfering RNAs (siRNAs) in EDPCs. (G) Ki67 staining of proliferating hEPDCs treated with DOX (0.1 μM, 14 h) in the presence or absence of IS20 or vehicle (DMSO). Confocal images of Ki67 positive (green) cell population in total cell number (DAPI-positive, blue) are shown in the left panel, quantitative analyses of images (250 to 400 cells across 3 independent experiments) appear in the histogram (right panel). Scale bar is 50 μm. All data are expressed as mean ± SEM. *p < 0.05, **p < 0.01, and ***p < 0.001 versus vehicle; †p < 0.05 and ††p < 0.01 versus DOX; # p < 0.05 versus IS20 + DOX. Source data for this figure are available in the Supplemental Appendix. EC = endothelial cell; other abbreviations as in Figure 1.
Figure 4
Figure 4
IS20 Protects Hearts in the Chronic Model of DOX Cardiotoxicity (A) AKT activation by phosphorylation in heart tissue lysates from wild type and prokineticin receptor-1 knockout (Pkr1-KO) mice 20 min after intraperitoneal injection of IS20 (1 mg/kg) or vehicle. (B) Illustration of the chronic cardiotoxicity protocol in mice. (C) Images of Mallory trichrome staining of cryo-sectioned hearts. Scale bars are 2.5 μm. (D) Serum cardiac troponin T (TNNT2) levels as a marker of heart damage from mice in the indicated groups (n = 6). (E) Cumulative survival analysis, as determined by the Kaplan-Meier plot, shows a significant difference in survival curves between the DOX group (n = 20) and the IS20 + DOX group (n = 20) (p = 0.028 by the log-rank test). (F) Echocardiographic analyses showing fractional shortening (FS), cardiac output (CO), and isovolumic relaxation time (IVRT) in mice treated with vehicle (Veh, 0.1% DMSO), IS20, PKR1 prokineticin receptor 1 (PKR1) agonist, DOX and IS20 + DOX. Data are expressed as mean ± SD for echocardiographic analyses. (G) Examples of Mallory trichrome staining of cryo-sectioned hearts. Blue indicates fibrosis. (H) qRT-PCR analyses of the expression of cardiac remodeling genes (Col1a1, ANF, and BNP). (I) qRT-PCR analyses of contractility regulating calcium handling genes (SERCA2 [Atp2a2], phospholamban [Pln]) (n = 4). (J) Levels of the tumor necrosis factor-α (Tnf) transcript, an indicator of necrosis (n = 4). All data are expressed as mean ± SEM, except for echocardiographic analyses. *p < 0.05, **p < 0.01, and ***p < 0.001 versus vehicle; †p < 0.05 versus DOX. ANF = atrial natriuretic factor; BNP = B-type natriuretic peptide, n = 4. COL1a1 = collagen type 1a1; other abbreviations as in Figure 1.
Figure 5
Figure 5
Molecular Mechanism of DOX Cardiotoxicity and Cardioprotection by IS20 (A) Western blotting analyses for H2AX protein phosphorylation (γ-H2AX) on samples from mouse hearts; (n = 6). Histogram shows quantitative analyses of γ-H2AX, normalized by total H2AX or tubulin. (B) Examples of heart sections costained for caspase-3 and myosin heavy chain (MHC; cardiomyocytes [CM]), platelet endothelial cell adhesion molecule (PECAM1; ECs) or transcription factor 21 (epicardial progenitor cells) antibodies. The histogram shows the relative caspase-3–positive apoptotic area in each image using a dedicated ImageJ (NIH) plugin (n = 20 to 50). (C) Cardiomyocytes isolated from DOX or IS20 + DOX treated hearts were stained with MitoTracker Red and DCFDA in response to DOX (0.1 μM) to assess ROS production in mitochondrial structures (left panels). Scale bar is 50 μm. Relative ROS levels (green) were quantified on thresholder images using a dedicated ImageJ plugin. Quantification of ROS production is shown on the left histogram (n = 20 to 50). (D) qRT-PCR analyses of NRF2 expression in mouse hearts. (E) Electron microscope (EM) analyses in the hearts. Hearts treated with DOX only (lower left) demonstrate fibrosis (fib), fused myofibrillar structures with disorganized Z bands (z), swollen and permeabilized mitochondria (mt) with abnormal cristae (upper right), abnormal ECs (ec*) in the blood vessels (bv), and disrupted gap junctions (gj) (n = 4 hearts/group). All data are expressed as mean ± SEM. *p < 0.05, **p < 0.01, and ***p < 0.001 versus vehicle; †p < 0.05 and ††p < 0.01 versus DOX. n = 4 to 6 mice/group. Source data for this figure are available in the Supplemental Appendix. Abbreviations as in Figures 1 and 3.
Figure 6
Figure 6
IS20 Restores Impaired Vascular Structure, Capillary and Vascular Density and hEPDC Deficits in DOX-Treated Mice (A) Representative example of PECAM1 and calponin costaining in the cryo-sectioned hearts. Arrow shows detachment of ECs from smooth muscle cells (SMC). Quantification of calponin+ vessel numbers is shown in the histogram. (B) Representative example and quantification of PECAM1 stained hearts in each group. n = 50 from 4 mice. (C) Example and quantification of outgrown cells from epicardial explants. n = 15 explants from 3 mice for each group. (D) Illustration of transcription factor-21 fluorescein isothiocyanate (FITC+) fluorescence-activated cell sorting (FACS) and quantification of cells in DOX- and IS20 + DOX–treated mouse hearts in histogram. n = 3. All data are expressed as the mean ± SEM. *p < 0.05, **p < 0.01 and ***p < 0.001 versus vehicle; †p < 0.05 and ††p < 0.01 versus DOX. Abbreviations as in Figures 1 and 5.
Figure 7
Figure 7
IS20 Did Not Interfere With the Cytotoxic Effects of DOX In Vitro and In Vivo (A) Cell viability assays on MDA-MB-231 and (B) MCF7 breast cancer cell lines treated with different concentrations of DOX (10 to 100 μM) in the presence or absence of IS20 (10 nM or 1 μM), vehicle (zero treatment), n = 4. (C) Illustration of treatments 3 days after xeno-transplantation of MDA-MB-231 cells. (D) Images of tumor size (red dots) on nude mice after the indicated treatments. (E) Quantification of tumor volumes during treatment in each group, n = 20. Data are expressed as mean ± SD. (F) Illustration of the acute cardiotoxicity protocol in mice (C57/B6). (G) Quantitative cardiac magnetic resonance analyses of heart volume during systole and diastole before treatments and 2 weeks after treatments (left and middle) and left ventricular ejection fraction (LVEF) (right), n = 6. Abbreviations as in Figure 1.
Central Illustration
Dose- and Time-Dependent Doxorubicin-Induced Cardiovascular Toxicity Is Inhibited by a GPCR Prokineticin Receptor-1 Signaling We unraveled dose- and time-dependent molecular and cellular signatures of an anthracycline-mediated cardiotoxicity. Doxorubicin (DOX) at low dose (top left) has no effect on apoptosis or reactive oxygen species (ROS) accumulation in cardiomyocytes, whereas it reduces epicardium-derived progenitor cell (EDPC) plasticity and endothelial cell tube formation (in vitro angiogenesis). A medium dose of DOX (top middle) promotes apoptosis in all cardiac cells. However, a brief exposure of cardiomyocytes to a high dose of DOX (top right) inhibits the detoxification system via stabilizing nuclear factor erythroid-derived 2-like 2 (NRF2) in the cytoplasm, resulting in ROS accumulation. Chronic DOX cardiotoxicity in mice (bottom left) induces mortality with heart failure with reduced ejection fraction (HFrEF), diastolic dysfunction, and adverse cardiac remodeling, whereas acute DOX cardiotoxicity (bottom right) promotes diastolic volume declines. Prokineticin receptor 1 (PKR1) activation by a ligand (IS20) mitigates these detrimental effects of DOX in vitro and in vivo without altering its antitumoral effect.

References

    1. McGowan J.V., Chung R., Maulik A., Piotrowska I., Walker J.M., Yellon D.M. Anthracycline chemotherapy and cardiotoxicity. Cardiovasc Drugs Ther. 2017;31:63–75. - PMC - PubMed
    1. Mertens A.C., Yong J., Dietz A.C. Conditional survival in pediatric malignancies: analysis of data from the Childhood Cancer Survivor Study and the Surveillance, Epidemiology, and End Results Program. Cancer. 2015;121:1108–1117. - PMC - PubMed
    1. van Dalen E.C., van der Pal H.J., Caron H.N., Kremer L.C. Different dosage schedules for reducing cardiotoxicity in cancer patients receiving anthracycline chemotherapy. Cochrane Database Syst Rev. 2006:CD005008. - PubMed
    1. Pugazhendhi A., Edison T., Velmurugan B.K., Jacob J.A., Karuppusamy I. Toxicity of doxorubicin (Dox) to different experimental organ systems. Life Sci. 2018;200:26–30. - PubMed
    1. Wang S.W., Konorev E.A., Kotamraju S., Joseph J., Kalivendi S., Kalyanaraman B. Doxorubicin induces apoptosis in normal and tumor cells via distinctly different mechanisms - intermediacy of H2O2- and p53-dependent pathways. J Biol Chem. 2004;279:25535–25543. - PubMed