. 2021 Aug 16:10:e62001.
doi: 10.7554/eLife.62001.

Spinal lumbar dI2 interneurons contribute to stability of bipedal stepping

Affiliations

Spinal lumbar dI2 interneurons contribute to stability of bipedal stepping

Baruch Haimson et al. Elife. .

Abstract

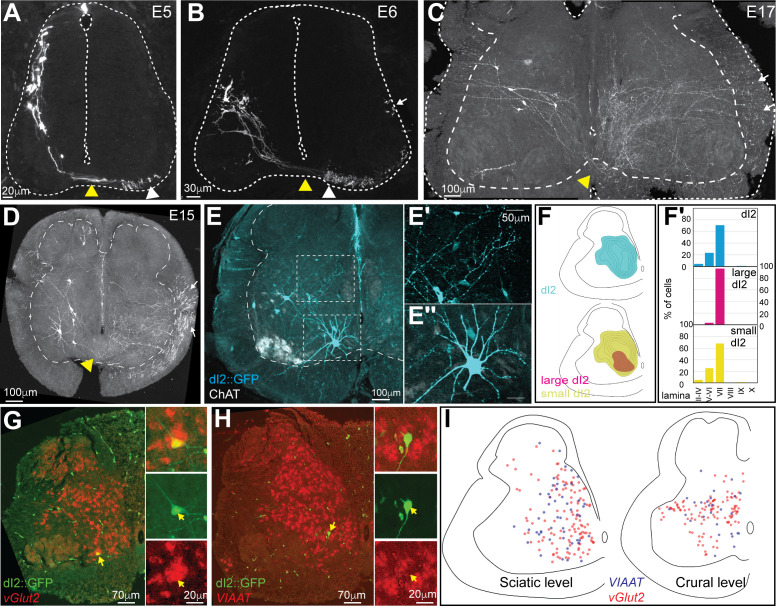
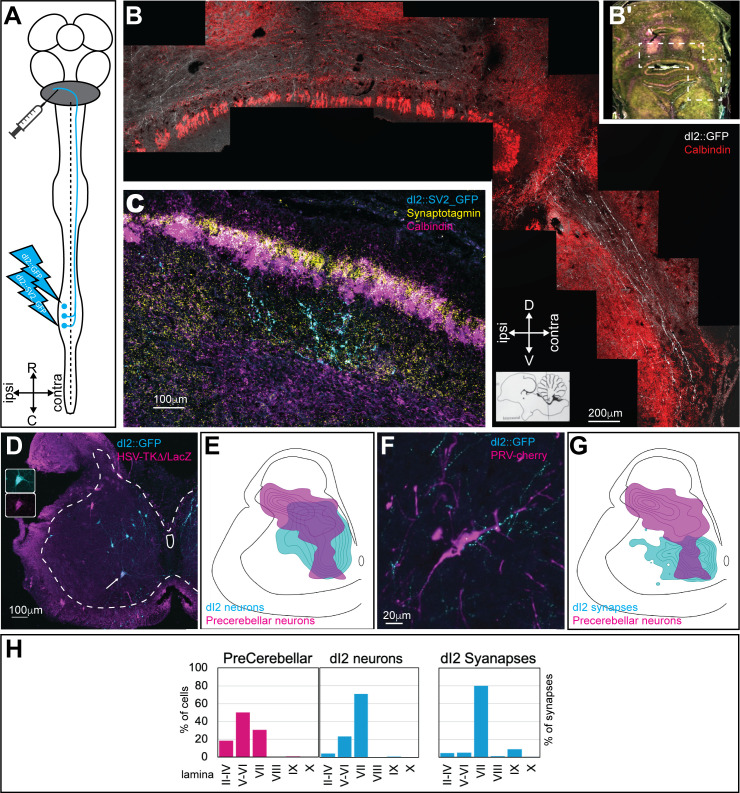
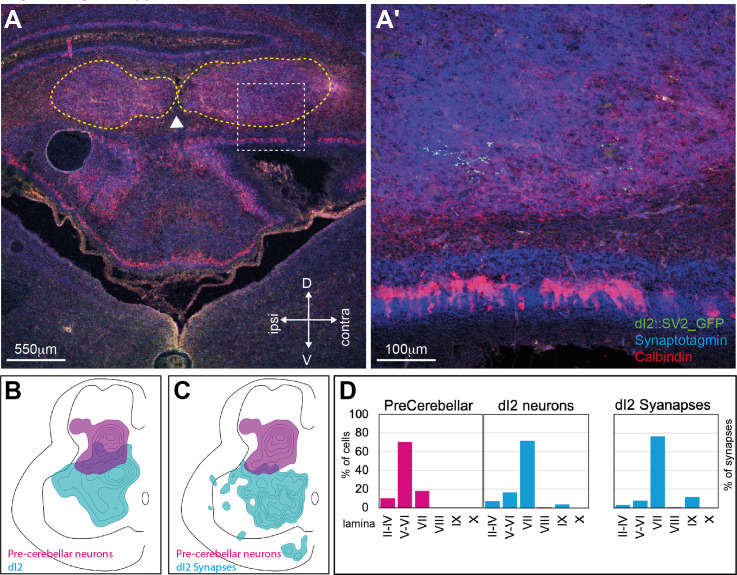
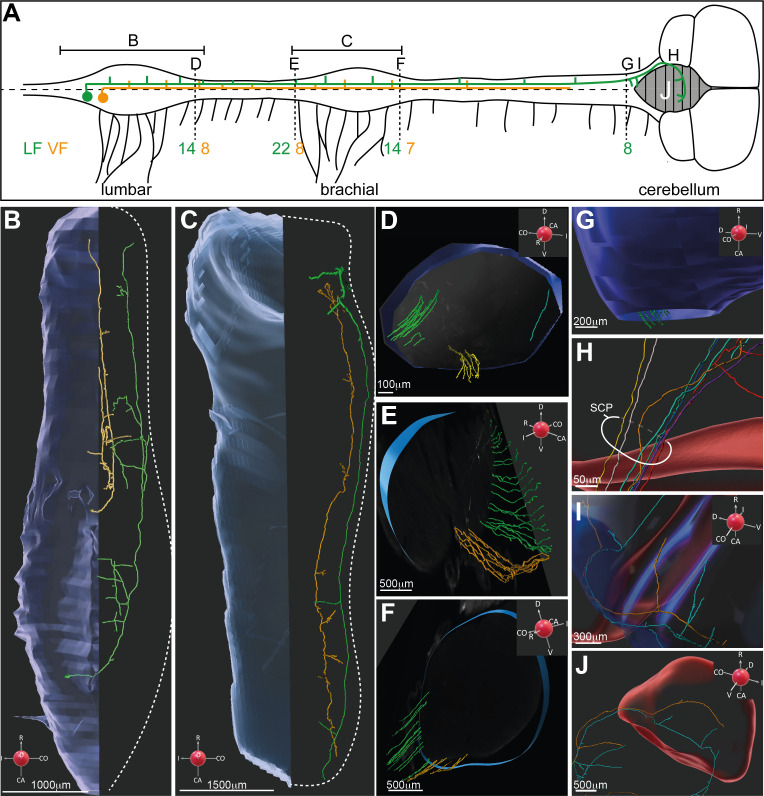
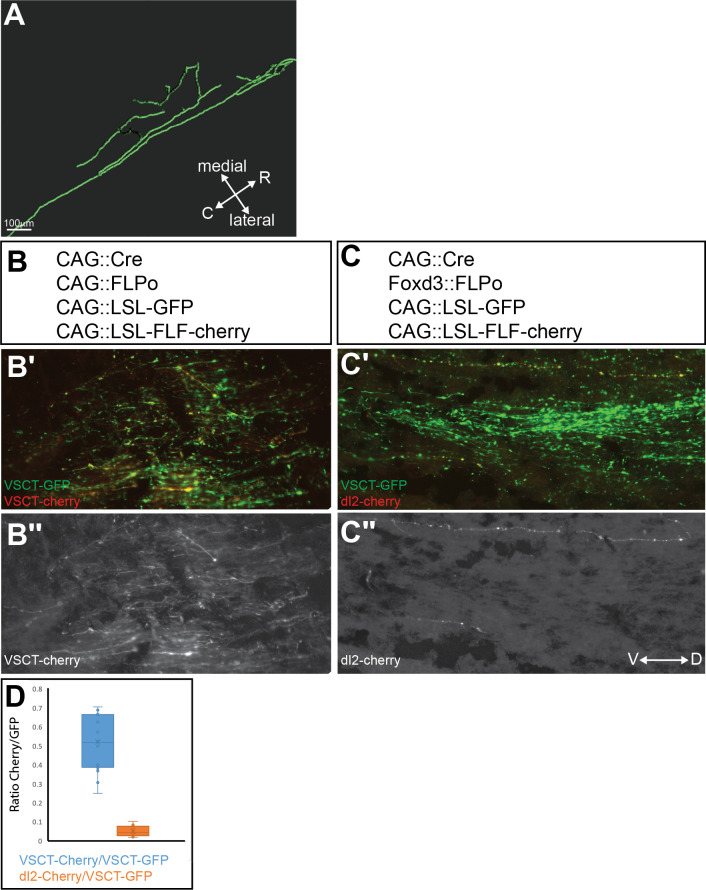
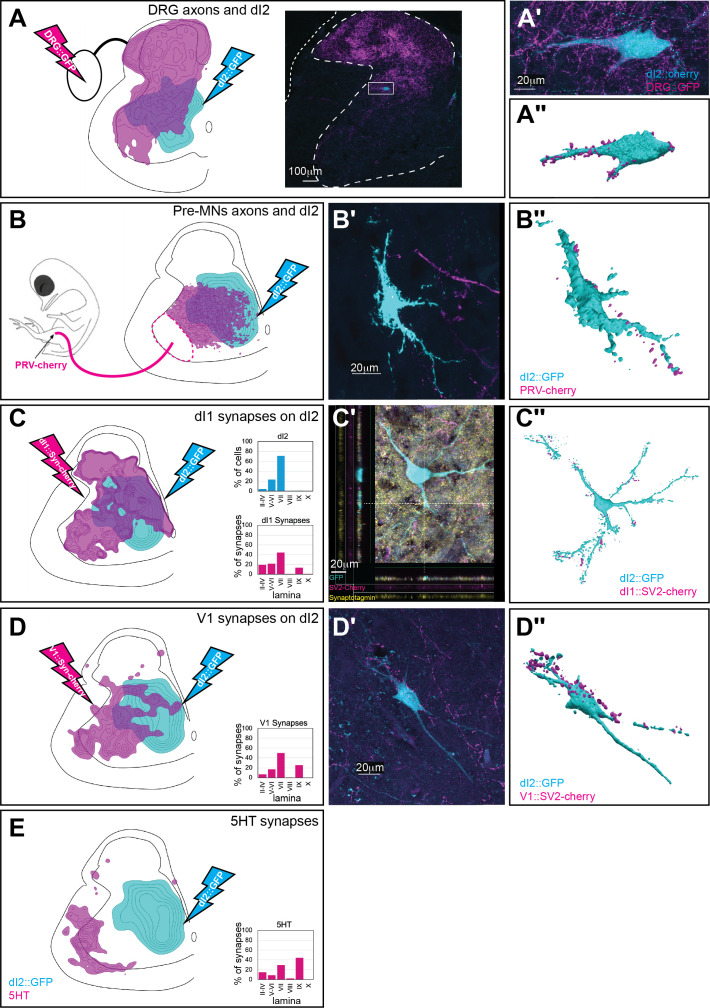
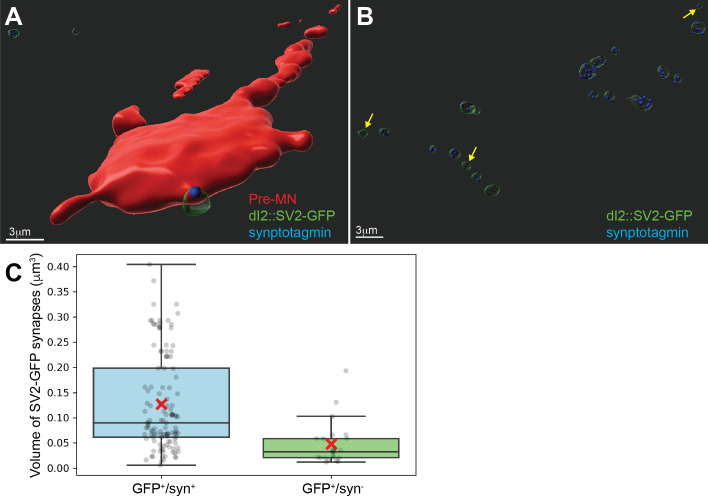
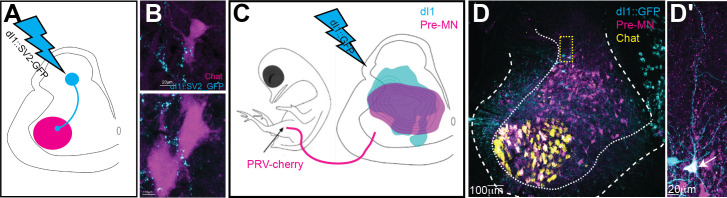
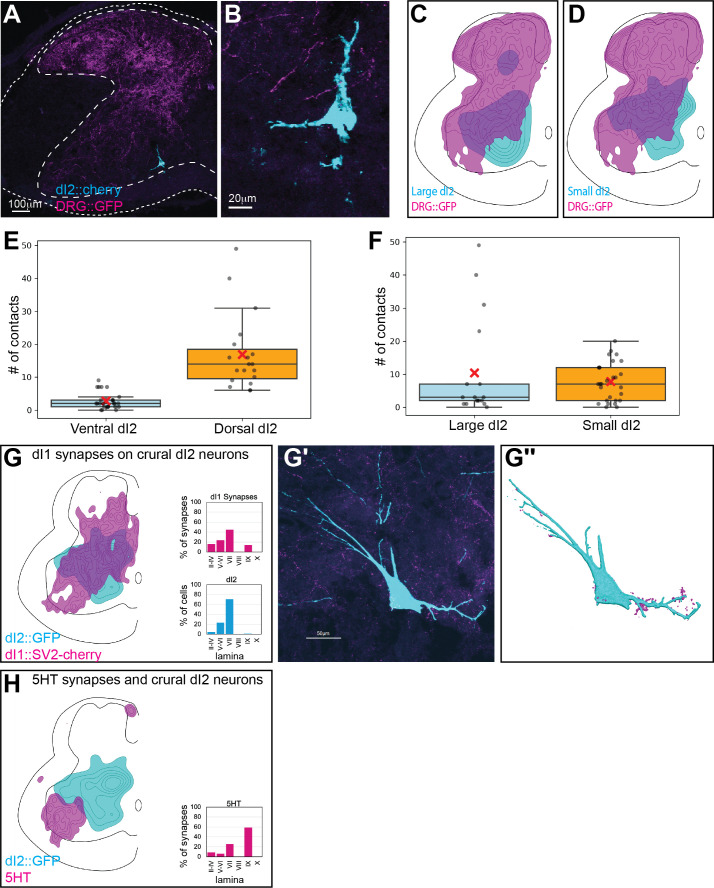
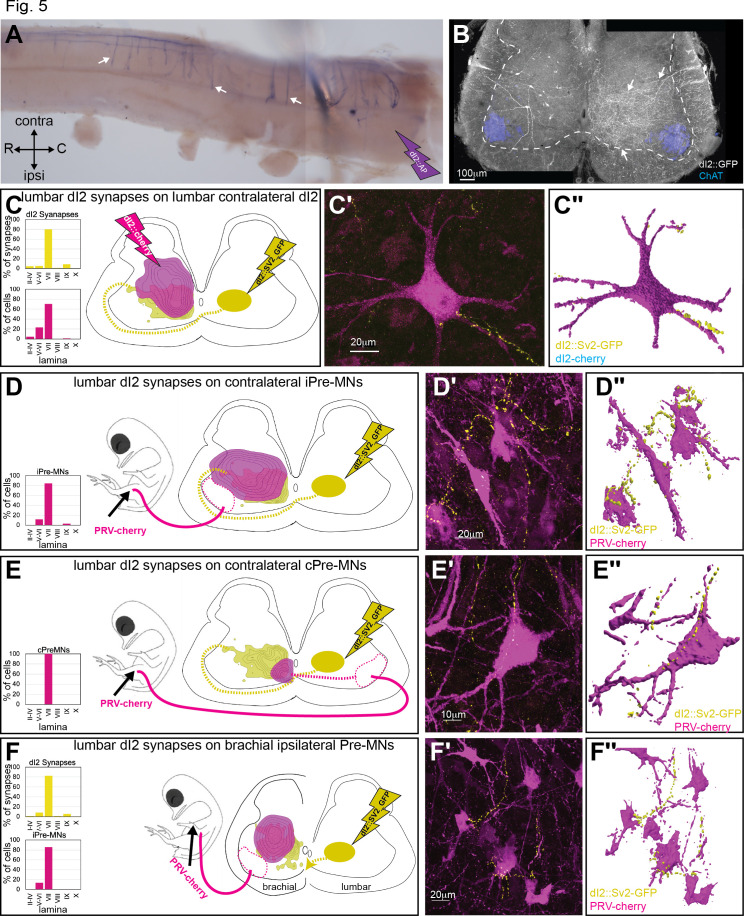
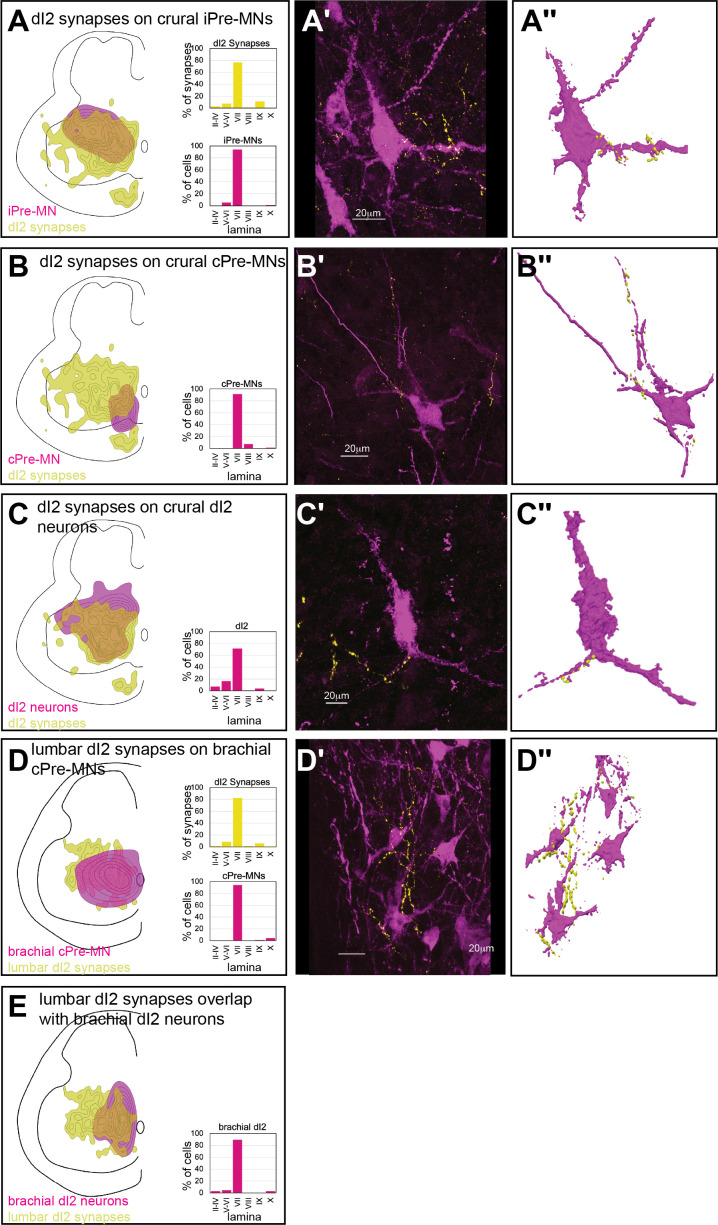
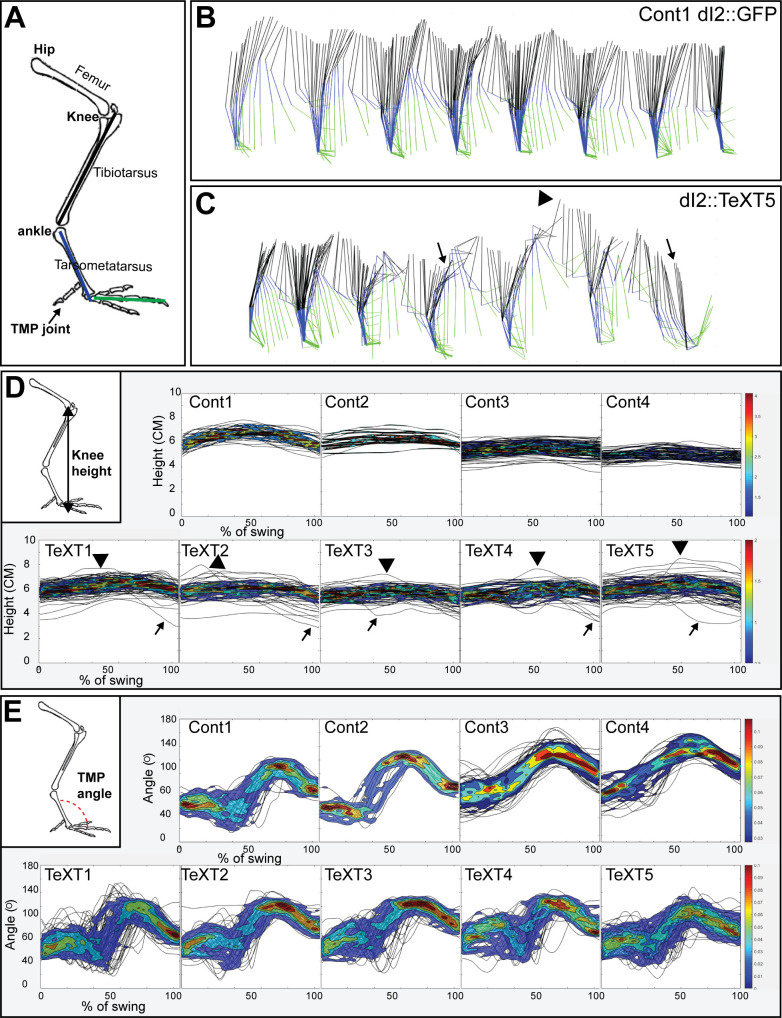
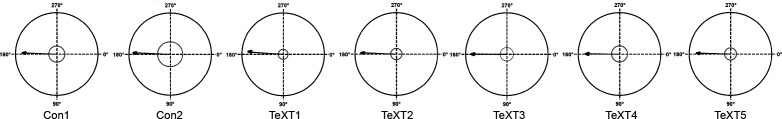
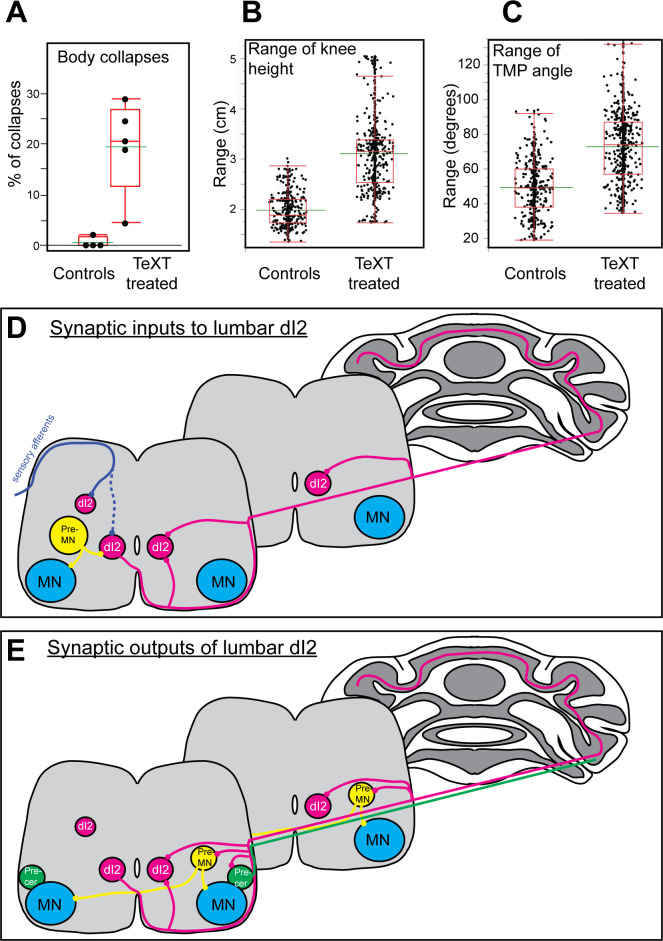
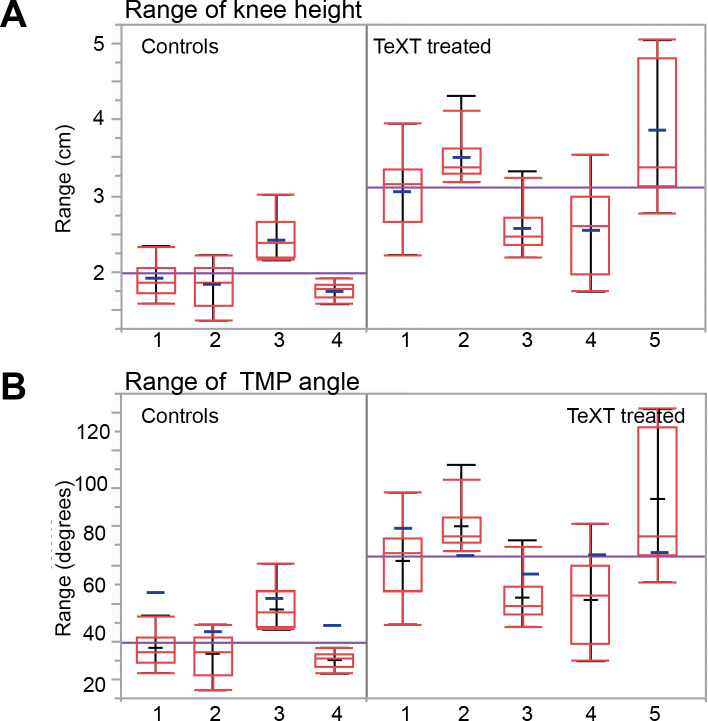
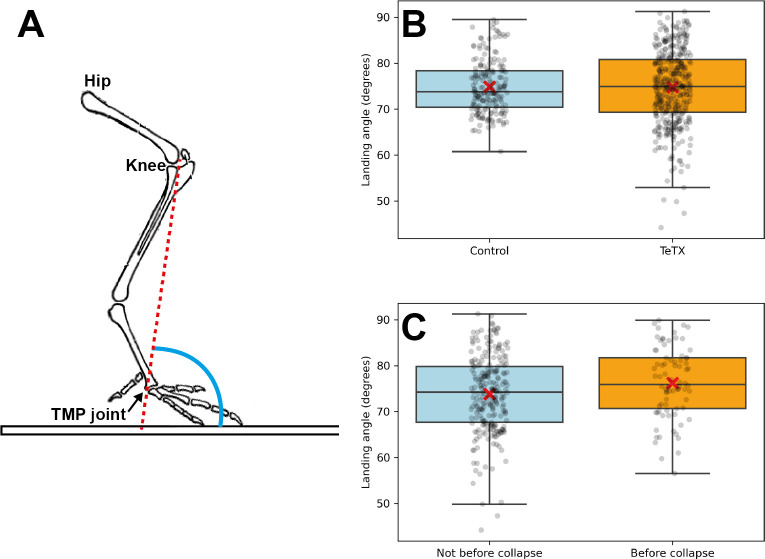
Peripheral and intraspinal feedback is required to shape and update the output of spinal networks that execute motor behavior. We report that lumbar dI2 spinal interneurons in chicks receive synaptic input from afferents and premotor neurons. These interneurons innervate contralateral premotor networks in the lumbar and brachial spinal cord, and their ascending projections innervate the cerebellum. These findings suggest that dI2 neurons function as interneurons in local lumbar circuits, are involved in lumbo-brachial coupling, and that part of them deliver peripheral and intraspinal feedback to the cerebellum. Silencing of dI2 neurons leads to destabilized stepping in posthatching day 8 hatchlings, with occasional collapses, variable step profiles, and a wide-base walking gait, suggesting that dI2 neurons may contribute to the stabilization of the bipedal gait.

Keywords: cerebellum; chicken; developmental biology; interneurons; locomotion; neural circuits; neuroscience; spinal cord; spinocerebellar tract.


Conflict of interest statement

BH, YH, NB, AK, MD, YC, AL, AK none

Figures

Figure 1.
Figure 1.. Characterization and classification of dI2 neurons during embryonic development.
dI2 interneurons (INs) were labeled as cells that expressed both the Foxd3 and Ngn1 enhancers (Avraham et al., 2009; see Figure 1—figure supplement 1A). (A–D) dI2 axonal projection during development. At embryonic day (E) 5 (A), postmitotic dI2 neurons assume a dorsolateral position and start to migrate ventrally. At E6 (B), dI2 neurons occupy the midlateral domain. At E15-17, dI2 neurons are located at medial lamina VII at the lumbar level (LS3) (C) and thoracic level (T1) (D). dI2 axons cross the floor plate (yellow arrowheads), turn longitudinally at the ventral funiculus (white arrowheads) and eventually elongate at the lateral funiculus (white arrows). (E) Cross-section of an E17 embryo at the lumbar spinal cord (crural plexus level, LS2). Small-diameter dI2 neurons residing in lamina VII (E′) and ventromedial large-diameter dI2 neurons in lamina VIII (E″). (F) Density plots and laminar distribution (F′) of dI2 somata at the sciatic plexus level (cyan, N = 374 cells); large-diameter (magenta) and small-diameter dI2 (yellow) INs (N = 33 and N = 344 cells, respectively, from two embryos). (G, H) Neurotransmitter phenotype of dI2 neurons. dI2 neurons expressing GFP were subjected to in situ hybridization using the Vglut2 probe (G) or the VIAAT probe (H). (I) Distribution of excitatory (vGlut2, red) and inhibitory (VIAAT, blue) dI2 neurons at the sciatic and crural levels at E17 (N = 172 and 136 neurons, respectively, from two embryos). See Figure 1—source data 1 and 2.
Figure 1—figure supplement 1.
Figure 1—figure supplement 1.. Targeting, reporters, and activity modifiers used in the study.
(A) The different DNA constructs used in this study. For targeted expression in dI1 cells, the EdI1 enhancer was used (Avraham et al., 2009). To target dI2 cells, the intersection of the Ngn1 and Foxd3 enhancers was attained (Avraham et al., 2009; Hadas et al., 2014). The Isl1 enhancer was used for targeted expression in DRG neurons (Uemura et al., 2005). (B) A table summarizing the axonal projections, neurotransmitter identity, soma location, and existence of synaptic connections between premotor neurons (pre-MNs) and spinal interneuron (IN) populations. Based on previous studies (Jessell, 2000; Alaynick et al., 2011; Lai et al., 2016).
Figure 1—figure supplement 2.
Figure 1—figure supplement 2.. Differential expression of transcription factor (TF) in dI2 neurons.
(A) Premigratory dI2 (yellow) and early ventral migrating dI2 (cyan) neurons are Lhx1+Pax2- (cyan arrows). Cross-section of an embryonic day (E) 5 chick neural tube, expressing GFP in dI2 neurons and immunostained for Lhx1 and Pax2 (insets at the right side). (B) Postmitotic, premigratory dI2 neurons express FoxD3 (red arrows) and downregulate its expression upon ventral migration (yellow arrows). The white arrow points to early postmitotic dI2 neurons that have not yet begun to express FoxD3. Cross-section of a chick neural tube at E5, double labeled for dI2 (dI2::GFP) and processed for in situ hybridization with a FoxD3 probe. (C) Genetic heterogeneity in the dI2 neuron population. Only a small subset of dI2 neurons express both the FoxP2 and FoxP4 genes. The cyan arrow indicates a FoxP2+/FoxP4+ dI2::GFP neuron. The yellow arrows point to FoxP2-/FoxP4- neurons. Cross-section of an E6 chick neural tube expressing GFP in dI2 interneurons (INs) and immunostained for FoxP2 and FoxP4. (D) A fraction of dI2 neurons express Pax2, which indicates an inhibitory phenotype. Cross-section of an E6 chick neural tube expressing GFP in dI2 INs and immunostained for Lhx1 and Pax2. The red arrows point to dI2::GFP/Lhx1+/Pax2+, the cyan arrows to Lhx1+/Pax2-, and the yellow arrows to Lhx1-/Pax2- dI2 neurons. (E) A graph indicating the fraction of dI2 neurons expressing TFs during development (based on data from three E5, two E6, and two E14 embryos).
Figure 1—figure supplement 3.
Figure 1—figure supplement 3.. Distribution of dI2 neurons at the embryonic and posthatching spinal cord.
(A) Density plot and laminar distribution of dI2 somata in crural plexus segments (N = 551 cells) (left). Density plot of dI2large (magenta) and dI2small (yellow) neurons in the crural plexus segments (N = 48 and N = 502 cells, respectively; N = 2 embryos) (right). (B) Density plot and laminar distribution of dI2 soma in the brachial segments (N = 66 cells, N = 2 embryos). (C, D) dI2 neurons in P8 chick hatchlings. dI2 neurons were labeled by the FoxD3 enhancer and bilateral dorsal electroporation (Figure 1—figure supplement 1A). Large-diameter dI2 neurons are indicated by arrowheads and some of the small-diameter dI2 by arrows.
Figure 2.
Figure 2.. dI2 neurons project to the cerebellum.
(A) Experimental setup for labeling dI2 neurons that project to the cerebellum. dI2 neurons were genetically targeted at HH18, and precerebellar neurons were labeled using intracerebellar injection of replication-defective HSV-LacZ or PRV-Cherry at embryonic day (E) 15. The abbreviations in the coordinates: R: rostral; C: caudal. (B) A cross-section of E17 brainstem and cerebellum. The dashed polygon in (B′) is magnified in (B). dI2 axons reach the cerebellum, enter into it via the superior cerebellar peduncle, and cross the cerebellar midline. Calbindin (Purkinje neurons, magenta [B′] or red [B]). Abbreviations in the coordinates: D: dorsal; V: ventral. (C) A cross-section of E17 cerebellar cortex. Lumbar-originating dI2 synapses (cyan) in the granular layer of the anterior cerebellar cortex. Calbindin (Purkinje neurons, magenta), synaptotagmin (yellow). (D) A cross-section of an E15 embryo at the lumbar spinal cord level (sciatic plexus level). Precerebellar neurons were infected and labeled with HSV-LacZ (magenta), and dI2 neurons expressed GFP (cyan). A large-diameter dI2 neuron coexpressing LacZ and GFP is indicated by an arrow (magnification of the two channels in the insets). (E) Density plots of dI2 and precerebellar neurons (density values 10–90%) in the sciatic plexus segments (N = 374 and N = 289 cells, respectively). (F) PRV-Cherry-labeled precerebellar neurons (magenta) are in contact with dI2 axonal terminals (cyan). (G) Density plots of dI2 synapses and precerebellar neuron somata (density values 10–90%) in the sciatic plexus segments (N = 4735 synapses and N = 289 cells, respectively). (H) The laminar distribution of precerebellar neurons, dI2 neurons, and dI2 synapses at the sciatic level. See Figure 2—source data 1.
Figure 2—figure supplement 1.
Figure 2—figure supplement 1.. Cerebellar and central cerebellar nucleus targets of dI2 neurons.
(A) dI2 synapses in the central cerebellar nuclei. A cross-section of an embryonic day (E) 17 chick cerebellum. dI2 synapses (magenta), synaptotagmin (cyan). The arrowhead points to the midline, the yellow dash lines encircle the central cerebellar nuclei, and the area confined in the white square is enlarged in (A’). (B) Density plot of dI2 and precerebellar neurons at the crural plexus segments (N = 551 and N = 652 cells, respectively; N = 2 embryos). (C) Density plot of dI2 synapses and precerebellar neurons at the crural plexus segments (N = 2543 synapses with density values of 25–80% and N = 652 cells with density values of 10–90%, respectively). (D) Laminar distribution of precerebellar neurons, dI2 neurons, and dI2 synapses in the different lamina at the crural level.
Figure 3.
Figure 3.. 3D reconstruction of dI2 neurons along the rostrocaudal axis.
(A) Spinal cord scheme describing dI2 axonal projection along the rostrocaudal axis (caudal is to the left, and rostral is to the right). The full lines represent the lumbar and brachial levels shown in (B) and (C). The broken lines represent the cross-sections shown in (D–G). The number of axons (and the funicular division) along the rostrocaudal axis is indicated adjacent to the corresponding letters (D–G). (B, C) Two representative dI2 neurons projecting their axons in the lateral funiculus (LF; green) and ventral funiculus (VF; yellow) at the lumbar (B) and brachial (C) levels. Numerous axonal collaterals are apparent. (D–F) Cross-sections at different levels of the spinal cord showing dI2 axons exiting the rostral end of the lumbar segments (D), entering the caudal brachial level (E), and exiting the rostral brachial level (F). Green: LF on the contralateral side (cLF); orange: VF on the contralateral side (cVF); cyan: LF on the ipsilateral side (iLF). (G–J) dI2 axons in the brainstem and cerebellum. (G) Axons entering the brainstem are indicated in green. (H) dI2 axons enter the cerebellum via the superior cerebellar peduncle (SCP). (I) Collaterals projecting into the brainstem. (J) The axons cross the cerebellar midline back to the ipsilateral side (two representative axons). A coordinate system is supplied in (B–G, I, J).
Figure 3—figure supplement 1.
Figure 3—figure supplement 1.. dI2 projection neurons constitute 10% of neurons in the ventral spinocerebellar tract (VSCT).
(A) A longitudinal bifurcation of a rostrally projecting dI2 axon. 3D reconstructions of light-sheet microscopy images of a lumbar-level dI2 neuron projecting at the brachial level. The bifurcated branch initially projects rostrally and subsequently turns medially into gray matter. (B, C) Proportion of dI2 cells among all VSCT neurons. GFP expression was activated by the removal of a single STOP cassette via Cre recombinase, and Cherry expression was activated by the removal of two STOP cassettes via Cre and FLPo recombinases. In the control experiment (B), the expression of Cre and FLPo was driven by the ubiquitously expressed CAG enhancer/promoter, while expression in dI2 cells (C) was controlled by CAG::Cre and dI2 enhancers driving FLPo. (B′–C′) A section at the level of the superior cerebellar peduncle. The ratio of the number of Cherry+ (VSCT or dI2, in B′, B″ and C′, C″, respectively) axons to the number of GFP+ (VSCT) axons was calculated. (D) Quantification of Cherry+/GFP+ in each experiment. In control electroporation, the ratio of Cherry to GFP was 0.52 ± 0.059 (blue box). The proportion of Cherry-expressing dI2 axons was 0.05 ± 0.01 (orange box). Thus, considering the 50% efficiency of double versus single conditional removal of the STOP signal, the proportion of dI2 axons was 9.61% (B and C, N = 2 and 3 embryos, respectively). See Figure 3—figure supplement 1—source data 1.
Figure 4.
Figure 4.. Synaptic inputs to dI2 neurons.
Schematic representations of the experimental design for labeling dI2::GFP or dI2::Cherry interneurons (INs; cyan) and potential sources of synaptic inputs (magenta). The soma densities of dI2 INs and the synaptic densities are illustrated in (A–E). The density values presented are 10–80%, 20–80%, 25–80%, 30–50%, and 20–80%, respectively. The laminar distributions are illustrated on the right side of (A–E). Examples of dI2 neurons contacted by axons or synaptic boutons are shown in (A′–D′), and their 3D reconstruction is shown in (A″–D″). Genetic labeling was achieved using specific enhancers (Figure 1—figure supplement 1A) introduced by electroporation at HH18. (A) Dorsal root ganglion (DRG) neurons form contacts on dI2 neurons. Inset in (A): cross-section of embryonic day (E) 17 embryos at the crural plexus level of the lumbar cord. A dorsally located dI2 neuron contacted by numerous sensory afferents, magnified in (A′) and 3D-reconstructed in (A″) (N = 18 sections, the scheme was constructed based on one representative embryo). (B) Premotor neurons (pre-MNs) form contacts on dI2 neurons. dI2 neurons were labeled at HH18. At E13, PRV virus was injected into the leg musculature, and the embryo was incubated until the infection of the pre-MNs (39 hr) (N = 34 sections, the scheme was constructed based on two representative embryos). (C) dI1 neurons form synapses on dI2 neurons. (N = 8568 synapses, 2 embryos). (C′) A representative SV2::Cherry synapse on dI2 dendrites positive for synaptotagmin. Demonstrated by horizontal and vertical optical sections in the Z-axis (see cursors and color channels). (D) V1 neurons form synapses on dI2 neurons (N = 1923 synapses, 2 embryos). (E) dI2 neurons are not contacted by 5-HT synaptic terminals (N = 1718 synapses, 1 embryo). E17 cross-sections of dI2::GFP-labeled embryos were stained for 5-HT. See Figure 4—source data 1.
Figure 4—figure supplement 1.
Figure 4—figure supplement 1.. Validation of the synaptic reporter as an indicator of synapses.
(A) Premotor neurons (red) contacted by dI2::SV2-GFP and colabeled with synaptotagmin (syn in blue) antibody. (B) A group of SV2-GFP-labeled boutons and the syn content (blue foci). Note that only the syn- boutons are small SV2-GFP boutons (yellow arrows). (C) Quantification of the volume of GFP+ boutons positive or negative for syn. The SV2-GFP+/syn+ boutons had a larger volume than the SV2-GFP+syn- boutons. (N = 121 and N = 23 for syn-positive and -negative GFP+ synapses, respectively, from one representative embryo. p<0.001, t-test).
Figure 4—figure supplement 2.
Figure 4—figure supplement 2.. dI1i neurons are premotor neurons (pre-MNs).
(A, B) Schematic illustration of the strategy for studying the potential innervation of motor neurons by dI1 neurons (A). dI1 neurons were targeted by a dI1-specific enhancer (Figure 1—figure supplement 1A). At embryonic day (E) 15, synaptic boutons labeled with SV2-GFP were studied on cross-sections. A synaptic reporter (cyan) was expressed in dI1 neurons. dI1i boutons contacting Chat+ motor neurons (magenta) are apparent (B). (C, D) Schematic representation of the experimental design for colabeling dI1 and pre-MNs, supplemented by cell soma densities of dI1 neurons (cyan, N = 643 cells) and pre-MNs (magenta, N = 936 cells). dI1 neurons were labeled at HH18. At E13, PRV virus was injected into the leg musculature, and the embryo was incubated until the infection of the pre-MNs (35 hr) (C). In a cross-section taken at E13, PRV-Cherry (magenta) was detected in motor neurons (Chat+, yellow) and pre-MNs (D). An example of dI1 neurons coexpressing GFP and PRV-Cherry is shown in (D′).
Figure 4—figure supplement 3.
Figure 4—figure supplement 3.. Input of dorsal root ganglion (DRG), dI1, and 5-HT neurons to dI2 neurons at the level of the crural plexus.
(A, B) Sparse sensory innervation of ventrally located dI2 neurons. Cross-section of an embryonic day (E) 17 embryo at the lumbar spinal cord (crural plexus level). A ventrally located dI2 neuron is sparsely contacted by sensory afferents (A), magnified in (B). (C, D) Density plots of dI2large (magenta, N = 48) and dI2small (yellow, N = 502) neurons and sensory afferents (N = 18 sections, with density values 10–80%) in the crural plexus segments. (E, F) Quantification of the number of contacts between terminals of DRG axons and dI2 neurons. The number of contacts was significantly higher in dorsal than ventral dI2 neurons (E) (N = 26 and N = 19 for ventral and dorsal neurons, respectively). p<0.00001, t-test. There was no significant difference in the number of contacts on either small or large dI2 neurons (F) (N = 17 and N = 28 for large and small neurons, respectively). p=0.49, t-test. (G) dI1 neurons form synapses on dI2 neurons. Density plot and the laminar distribution of dI1 synapses (magenta) and dI2 somata (cyan) (N = 13,369 synapses with density values 50–90%). Example of dI1 boutons (magenta) on a dI2 neuron (cyan) (G′) and its 3D reconstruction in (G″). (H) dI2 neurons are not contacted by 5-HT synaptic terminals. Density plot and laminar distribution of 5-HT synapses (magenta) and dI2 somata (cyan) (N = 2754 synapses with density values 25–85%).
Figure 5.
Figure 5.. Spinal synaptic targets of dI2 neurons.
(A) Whole-mount staining of the spinal cord (thoracic segments) expressing alkaline phosphatase (AP) in dI2 neurons. The lumbar dI2 neurons (not included in the image) were labeled with AP. dI2 axon collaterals project and into the spinal cord (arrows). Abbreviations in the coordinates: rostral: R: caudal: C. (B) Cross-section of an embryonic day (E) 17 embryo at the crural plexus level of the lumbar spinal cord. Axonal collaterals (white arrow) penetrating the gray matter of the contralateral side are evident. Schematic representations of the experimental design for labeling synapses (dI2::SV2-GFP, yellow) and potential targets (magenta) supplemented by cell soma density and dI2 synaptic densities are illustrated in (C–F). The laminar distribution of the somata and synapses is illustrated on the right side of (C–F). Examples of target neurons contacting synaptic boutons of dl2 neurons are shown in (C′–F′), and their 3D reconstruction is shown in (C″–F″). Genetic labeling was achieved using dI2 enhancers (Figure 1—figure supplement 1A) electroporated at HH18. Premotor neurons (pre-MNs) were labeled by injection of PRV-Cherry into the hindlimbs (D, E) or the forelimb (F) musculature at E13. The embryos were incubated until the pre-MNs were infected (39 hr). (C) dI2 neurons innervate contralateral dI2 neurons (N = 4735 synapses and N = 374 cells, respectively, two embryos). (D) dI2 neurons innervate ipsilateral projections of pre-MNs at the sciatic plexus level (N = 4735 synapses and N = 936 cells, respectively, scheme was done based on one representative embryo). (E) dI2 neurons innervate contralaterally projecting pre-MNs at the sciatic plexus level (N = 4735 synapses and N = 47 cells, respectively, scheme was done based on one representative embryo). (F) dI2 neurons innervate ipsilaterally projecting pre-MNs at the brachial level (N = 2215 synapses and N = 286 cells, respectively, three embryos). See Figure 5—source data 1.
Figure 5—figure supplement 1.
Figure 5—figure supplement 1.. Spinal targets of dI2 at the crural and brachial levels.
Cell soma density of putative targets (magenta) of dI2 neurons and dI2 synaptic densities (dI2::SV2-GFP, yellow) are illustrated in (A–E). The laminar distribution of the somata and synapses is illustrated on the right side of (A–E). Examples of target neurons in contact with dI2 synaptic boutons are presented in (A’–E′), and their 3D reconstruction is presented in (A″–E″). Genetic labeling was achieved using dI2 enhancers (Figure 1—figure supplement 1A) delivered by electroporation at HH18. Premotor neurons (pre-MNs) were labeled by injection of PRV-Cherry into the hindlimbs (D, E) or the forelimb (F) musculature at embryonic day (E) 13. Embryos were incubated for 39 hr after PRV injection. (A) dI2 neurons innervate ipsilaterally projecting pre-MNs at the crural plexus level (N = 2543 synapses [three embryos] and N = 250 cells, respectively, scheme was done based on one representative embryo). (B) dI2 neurons innervate contralaterally projecting premotor neurons at the crural plexus level (N = 2543 synapses [three embryos] and N = 117 cells, respectively, scheme was done based on one representative embryo). (C) dI2 neurons innervate contralateral dI2 neurons at the crural plexus level (N = 2543 synapses and N = 551 cells, respectively, two embryos). (D) dI2 neurons innervate brachial contralaterally projecting pre-MNs (N = 2215 synapses and N = 90 cells, respectively, two embryos). (E) dI2 neurons innervate brachial dI2 neurons (N = 2215 synapses and N = 66 cells, respectively, scheme was done based on two embryos).
Figure 6.
Figure 6.. Kinematic analysis of locomotion in posthatching chicks following the silencing of dI2 neurons.
(A) Schematic illustration of chick hindlimb joints (bold) and bones (regular). The knee joint connects the femur and the tibiotarsus, and the ankle connects the tibiotarsus and the tarsometatarsus, which connects to the phalanges at the TMP joint. During the swing phase of birds, ankle flexion leads to foot elevation, while the knee is relatively stable. (B, C) Stick diagrams of stepping in a control chicken d2::GFP (B) and in a d2::TeTX chicken (C). Arrows indicate collapses, and overshoots are denoted by arrowheads. (D) Overlays of knee height (demonstrated in insert) trajectories during the swing phase in all analyzed steps of each of the control and TeTX-treated posthatching day (P) 8 hatchlings are shown superimposed with the respective 20–80% color-coded density plots as a function of the percentage of swing (see text and Materials and methods). Arrows indicate collapses, and overshoots are indicated by arrowheads. (E) The angular trajectories of the TMP joint (shown in insert) during the swing phase in all analyzed strides of each of the control and TeTX-treated P8 hatchlings are shown superimposed on the respective 20–80% color coded density plots as a function of the percentage of swing (see text and Materials and methods). See Figure 6—source data 1, Figure 6—source data 2, Figure 6—source data 3.
Figure 6—figure supplement 1.
Figure 6—figure supplement 1.. Locomotion characteristics of control and TeTX-treated chicks: The left-right phase.
The mean left-right phase of the control and TeTX-treated chicks. The mean phase values are indicated by the r-vectors (arrows). The Rayleigh critical values (p=0.05) are indicated by blue circles.
Figure 7.
Figure 7.. Parameters of reduced stability in bipedal stepping in TeTX-treated chicks.
(A) The percentage of steps with body collapses in the controls and TeTX-manipulated hatchlings (n = 4 and n = 5, respectively). p-value<0.0001 (Z-test). See Table 3 for the proportions of falls at the individual chick level. (B) Analysis of the mean range of knee height changes during the swing phase of control and TeTX-treated chicks (n = 4 and n = 5, respectively). p-value<0.0001 using a t-test allowing different variances. See Figure 7—figure supplement 1A and Table 3 for individual chick data and statistical analysis details. (C) Analysis of the mean range of TMP angular excursions during the swing phase of control- and TeTX-treated chicks (n = 4 and n = 5, respectively). p-value<0.0001, Watson–Williams test. See Figure 7—figure supplement 1B and Table 3 for individual chick data and statistical analysis details. (D, E) Schematic illustrations showing the connectome of lumbar dI2 neurons. The synaptic inputs (D) and outputs (E) of dI2 neurons are illustrated. dI2 neurons (magenta) receive synaptic input from sensory afferents (solid blue line indicates massive synaptic input, and dashed blue line indicates sparse innervation), from inhibitory and excitatory premotor neurons (pre-MNs; yellow), and from the contralateral lumbar dI2 neurons. dI2 neurons innervate the contralateral lumbar and brachial pre-MNs (both commissural and ipsilaterally projecting pre-MNs are innervated by dI2 cells), the lumbar and brachial contralateral dI2 cells, lumbar precerebellar neurons (green), and the cerebellar granule cells. See Figure 7—source data 1.
Figure 7—figure supplement 1.
Figure 7—figure supplement 1.. Locomotion characteristics of control and TeTX-treated chicks: The range of knee height and TMP angles.
(A, B) The range of knee height and TMP angle (A and B, respectively, see text for details) for each chicken (four controls and five TeTX-treated chicks). Purple lines: averages of each group (controls and TeTX-treated chick); blue lines: averages of individual chicks; red lines and boxes: box plots; black lines: ranges of individual chicks. In general, higher interstride variability was evident in the TeTX-treated chicks than in the controls.
Figure 7—figure supplement 2.
Figure 7—figure supplement 2.. Locomotion characteristics of control and TeTX-treated chicks.
Analyses of the landing angle. (A) Scheme of bones and joints of the chicken leg, indicating the landing angle. (B) A box plot showing the landing angles. The control and manipulated chickens did not show a significantly different landing angle (N = 188 and N = 385 steps for four control chickens and five TeTX-manipulated chickens, respectively; p=0.85, t-test). (C) The landing angles before collapse are slightly higher than the angles that do not precede a collapse (N = 78 and N = 248 steps for angles preceding and not preceding collapse, respectively; five chickens; p=0.02, t-test).

References

    1. Alaynick WA, Jessell TM, Pfaff SL. Snapshot: Spinal cord development. Cell. 2011;146:178. doi: 10.1016/j.cell.2011.06.038. - DOI - PMC - PubMed
    1. Andersson LS, Larhammar M, Memic F, Wootz H, Schwochow D, Rubin CJ, Patra K, Arnason T, Wellbring L, Hjälm G, Imsland F, Petersen JL, McCue ME, Mickelson JR, Cothran G, Ahituv N, Roepstorff L, Mikko S, Vallstedt A, Lindgren G, Andersson L, Kullander K. Mutations in DMRT3 affect locomotion in horses and spinal circuit function in mice. Nature. 2012;488:642–646. doi: 10.1038/nature11399. - DOI - PMC - PubMed
    1. Avraham O, Hadas Y, Vald L, Zisman S, Schejter A, Visel A, Klar A. Transcriptional control of axonal guidance and sorting in dorsal interneurons by the LIM-HD proteins lhx9 and lhx1. Neural Development. 2009;4:21. doi: 10.1186/1749-8104-4-21. - DOI - PMC - PubMed
    1. Avraham O, Hadas Y, Vald L, Hong S, Song MR, Klar A. Motor and dorsal root ganglion axons serve as choice points for the ipsilateral turning of di3 axons. The Journal of Neuroscience. 2010a;30:15546–15557. doi: 10.1523/JNEUROSCI.2380-10.2010. - DOI - PMC - PubMed
    1. Avraham O, Zisman S, Hadas Y, Vald L, Klar A. Deciphering axonal pathways of genetically defined groups of neurons in the chick neural tube utilizing in ovo electroporation. Journal of Visualized Experiments. 2010b;1:1792. doi: 10.3791/1792. - DOI - PMC - PubMed

Publication types