. 2021 Aug 16;131(16):e144195.
doi: 10.1172/JCI144195.

A therapeutic cancer vaccine delivers antigens and adjuvants to lymphoid tissues using genetically modified T cells

Affiliations

A therapeutic cancer vaccine delivers antigens and adjuvants to lymphoid tissues using genetically modified T cells

Joshua R Veatch et al. J Clin Invest. .

Abstract

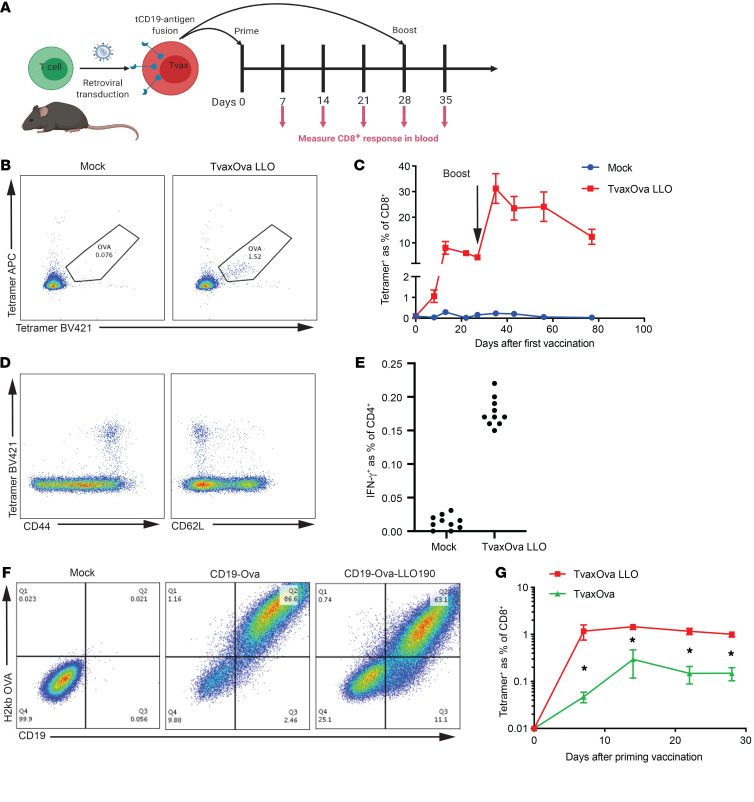
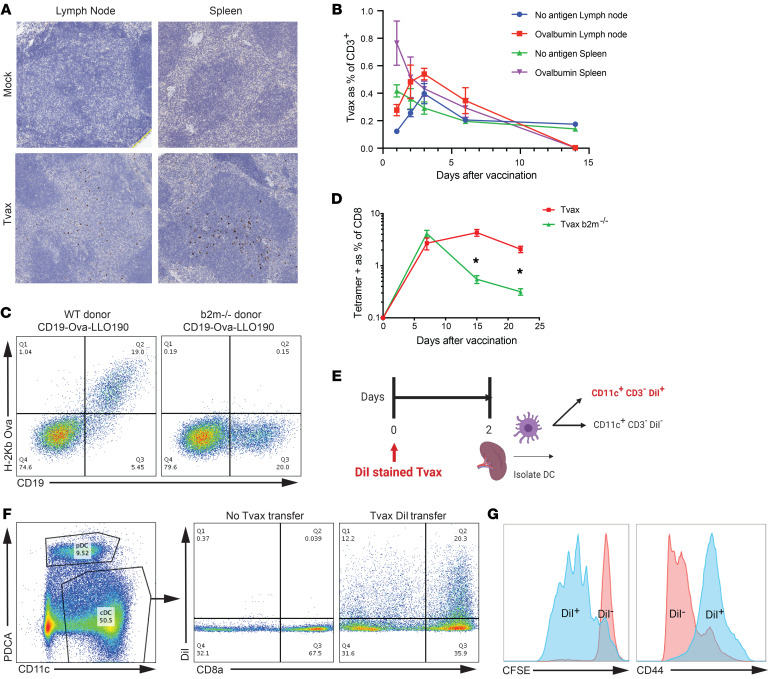
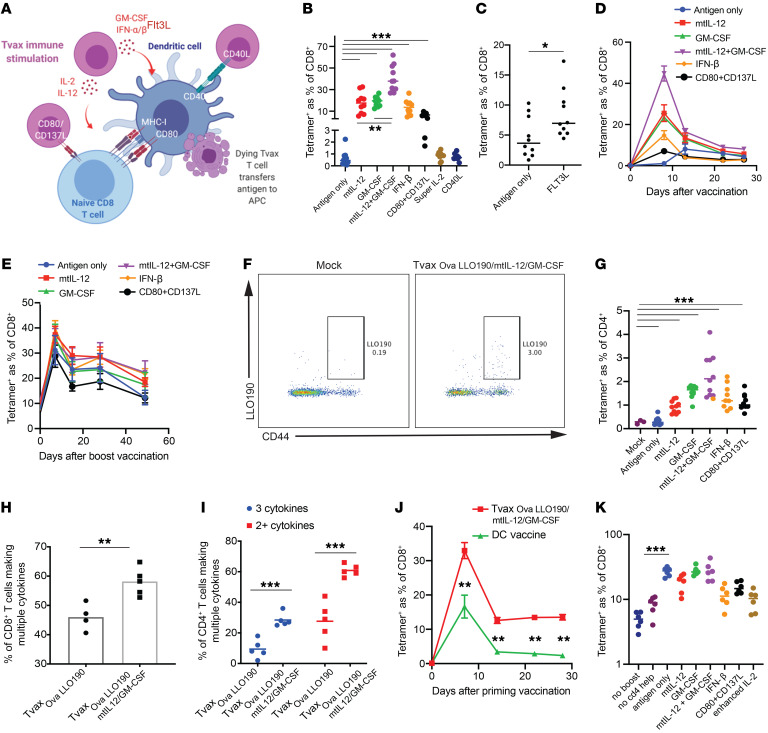
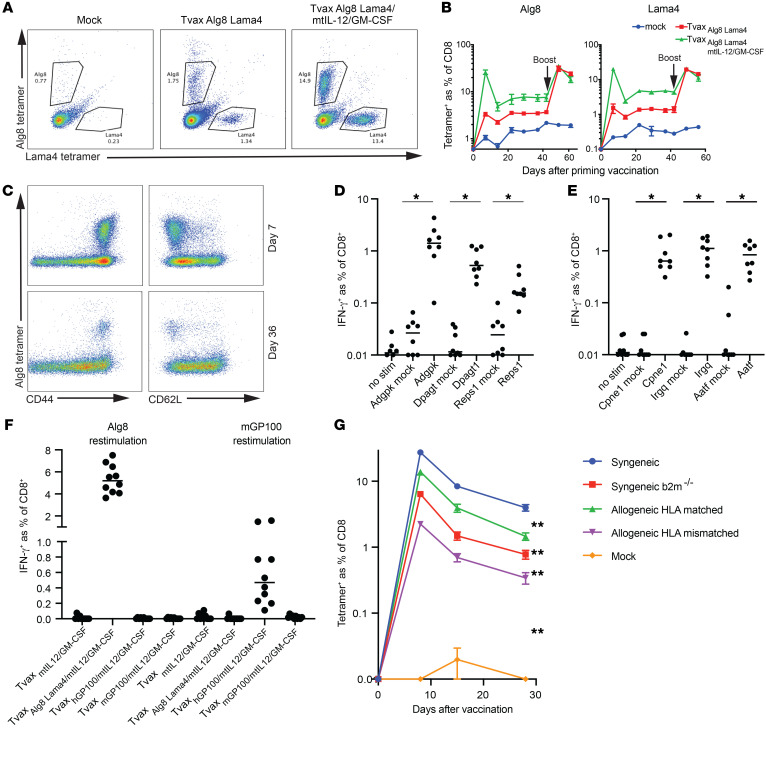
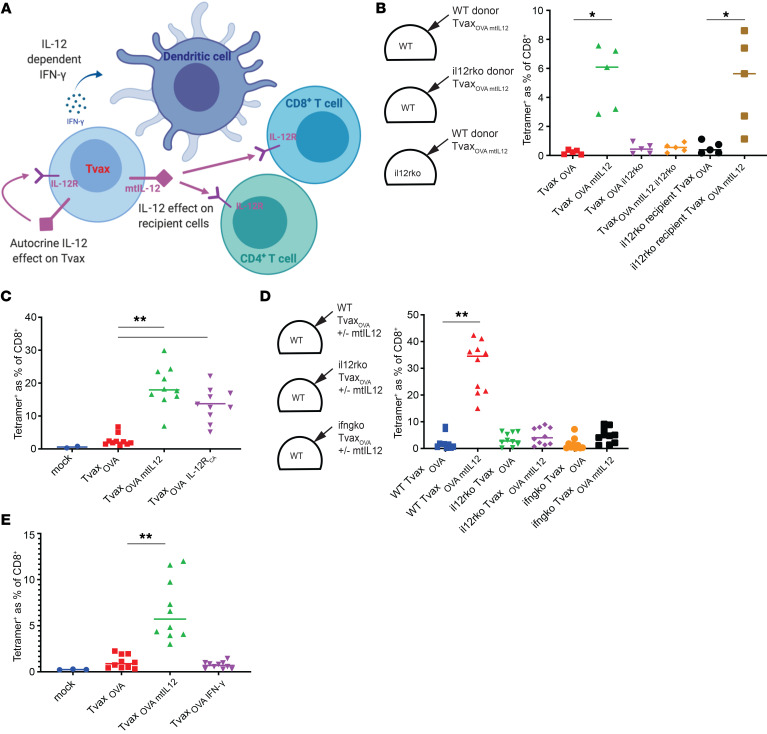
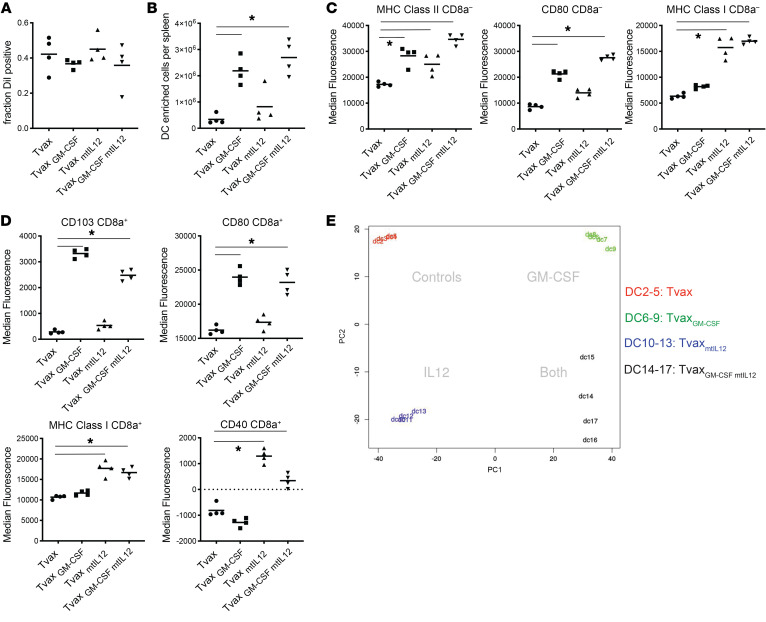
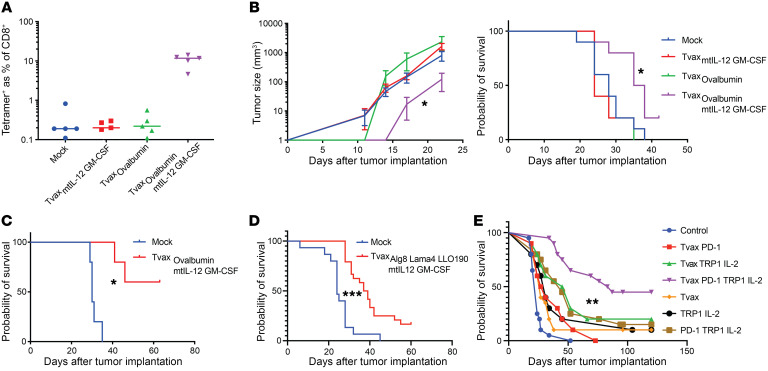
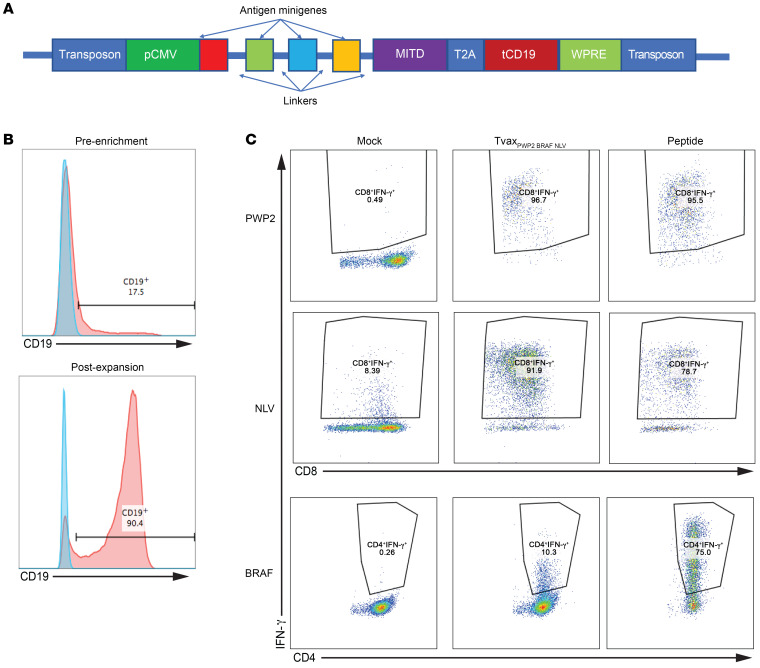
Therapeutic vaccines that augment T cell responses to tumor antigens have been limited by poor potency in clinical trials. In contrast, the transfer of T cells modified with foreign transgenes frequently induces potent endogenous T cell responses to epitopes in the transgene product, and these responses are undesirable, because they lead to rejection of the transferred T cells. We sought to harness gene-modified T cells as a vaccine platform and developed cancer vaccines composed of autologous T cells modified with tumor antigens and additional adjuvant signals (Tvax). T cells expressing model antigens and a broad range of tumor neoantigens induced robust and durable T cell responses through cross-presentation of antigens by host DCs. Providing Tvax with signals such as CD80, CD137L, IFN-β, IL-12, GM-CSF, and FLT3L enhanced T cell priming. Coexpression of IL-12 and GM-CSF induced the strongest CD4+ and CD8+ T cell responses through complimentary effects on the recruitment and activation of DCs, mediated by autocrine IL-12 receptor signaling in the Tvax. Therapeutic vaccination with Tvax and adjuvants showed antitumor activity in subcutaneous and metastatic preclinical mouse models. Human T cells modified with neoantigens readily activated specific T cells derived from patients, providing a path for clinical translation of this therapeutic platform in cancer.

Keywords: Cancer immunotherapy; Immunology; Vaccines.


Conflict of interest statement

Conflict of interest: JRV and SRR are co-inventors on a patent related to this work (patent no. CA3022267A1) that has been licensed to Lyell Immunopharma. JRV and SRR have received research support from and have equity interest in Lyell Immunopharma.

Figures

Figure 1
Figure 1. Tvax primes and boosts CD8+ T cell responses.
(A) Schematic of syngeneic Tvax preparation and administration. (B and C) Frequency of OVA-specific CD8+ T cells in mice that received syngeneic Tvax. Cells were gated on CD8+ lymphocytes and stained with H-2Kb-SIINFEKL tetramers using 2 different fluorophores. Mice were injected on day 0 with Tvax cells transduced with retroviral constructs encoding tCD19 fused to an OVA CD8 epitope and an LLO190 CD4 epitope (TvaxOVA-LLO190). Control mice received mock-transduced T cells. OVA-specific T cells were detected after vaccination by staining with a tetramer and are expressed as a percentage of total CD8+ lymphocytes in the blood (n = 10 mice/group). (D) Staining for CD44 and CD62L and the OVA tetramer on CD8+ lymphocytes in peripheral blood 7 days after vaccination. (E) Frequency of CD4+IFN-γ+ T cells in spleens of vaccinated mice and control mice following restimulation with the LLO190 peptide 13 days after vaccination. (F) Expression of the H-2Kb-SIINFEKL epitope on Tvax cells expressing either the OVA CD8+ epitope alone or both the OVA CD8+ and LLO190 CD4+ epitopes, as determined by staining with the H-2Kb-SIINFEKL antibody. (G) OVA tetramer+ T cells in the blood of mice (n = 10) injected with TvaxOVA or TvaxOVA-LLO190. *P < 0.003 for differences between groups, by Mann-Whitney U test.
Figure 2
Figure 2. Syngeneic Tvax cells traffic to secondary lymphoid tissues and prime CD8+ T cell responses by cross-presentation on host DCs.
(A) Immunohistochemistry of spleens and lymph nodes from control mice and mice that received Tvax expressing GFP. T cells were injected i.v., and 48 hours later, spleens and lymph nodes were harvested and stained for GFP by immunohistochemistry. Original magnification, ×20. (B) Tvax cells were created from WT (no antigen) or full-length OVA-expressing donor mice and labeled with CellTrace Violet (CTV), and 2 × 10⁶ cells were transferred i.v. into mice. The percentage Tvax cells as a fraction of CD3+ T cells in spleen and lymph nodes was measured by flow cytometry in mice sacrificed at the indicated time points (n = 4 per group). Error bars represent the SEM. (C) Staining of tCD19 and SIINFEKL-H-2Kb on T cells from WT and B2m–/– donor mice transduced with tCD19-OVA-LLO190. (D) Tvax cells from WT and B2m–/– donors were injected into mice, and the percentage of antigen-specific cells in the blood was measured by tetramer staining. (n = 10). (E) Schematic of dye transfer experiment to determine DC uptake of Tvax cells. (F) Splenic DCs were enriched by negative immunomagnetic selection 48 hours after injection of DiI-labeled Tvax cells, and DiI uptake by CD11chiPDCA cells was measured in CD8a+ and CD8a cell subsets by flow cytometry. (G) Naive OT-I CD8+ T cells were labeled with CFSE and incubated with CD11chiDiI+ and DiI cells sorted by FACS from mice 48 hours after vaccination. CFSE dilution (left panel) and CD44 expression (right panel) in OT-I T cells was measured 4 days later by flow cytometry. Results are representative of 3 biological replicates from 2 independent experiments. *P < 0.0001, by Mann-Whitney U test.
Figure 3
Figure 3. Adjuvant inflammatory signals augment T cell immunity induced by Tvax.
(A) Schematic of different immunostimulatory Tvax strategies. (BD) Tvax cells transduced with antigen only (TvaxOVA-LLO190) or with antigen and additional inflammatory signals were injected i.v. into mice. The frequency of OVA-specific CD8+ T cell responses in the blood measured by tetramer on day 8 (B and C) and weekly for 28 days (D) is shown for each of the different adjuvants. (E) Frequency of OVA-specific T cells in blood after boosting with TvaxOVA-LLO190 on day 28. (F and G) LLO-specific CD4+ T cell responses to were measured by tetramer staining on day 7 after vaccination of mice with Tvax and different adjuvants. (H and I) Splenocytes were incubated with OVA and LLO190 peptides on day 13 after vaccination, and the percentages of polyfunctional CD8+ T cells (H) and CD4+ T cells (I) were measured by intracellular cytokine staining for IFN-γ, TNF-α, and IL-2. (J) Frequency of OVA-specific CD8+ T cells in mice vaccinated with TvaxOVA–LLO190/mtIL-12/GM-CSF or with an identical number of mature DCs pulsed with OVA and LLO190 peptides (n = 4 mice per group). (K) Mice previously primed with TvaxOVA–LLO190/mtIL-12/GM-CSF were boosted on day 28 with TvaxOVA-LLO190 alone or TvaxOVA-LLO190 and different additional inflammatory signals. OVA-specific T cell responses were measured in the blood by tetramer staining 7 days after boosting. *P < 0.05, **P < 0.01, and ***P < 0.001, by Mann-Whitney U test.
Figure 4
Figure 4. Tvax induces T cell responses to naturally occurring neoantigens.
(A) Mice were injected with Tvax expressing sequences spanning the Alg8 and Lama4 point mutations previously described in a methylcholanthrene-induced sarcoma, with and without mtIL12 and GM-CSF adjuvants. Alg8- and Lama4-specific T cell responses were measured in the blood on day 7 by tetramer staining. (B) Frequency of Alg8- and Lama4-specific T cells in mice over time and after a booster vaccination on day 42 with Tvax expressing Alg8 and Lama4 only. (C) Expression of CD44 and CD62L on tetramer+ T cells in the blood on day 7 and day 36 following vaccination. (D and E) T cell responses induced by administration of TvaxmtIL-12/GM-CSF modified to express the MC-38 neoantigens Adgpk, Dpagt, or Reps1 (n = 8 mice/group) (D), and Cpne1, Irgq, or Aatf (n = 8 mice/group) (E). Responses were determined by intracellular staining for IFN-γ in CD8+ T cells following stimulation of splenocytes pulsed with peptides for each neoantigen. Controls included responses in unstimulated splenocytes and in splenocytes from mice that were not vaccinated. (F) Mice were injected with TvaxmtIL-12/GM-CSF expressing either Alg8 and Lama4, murine GP100, or human GP100. Spleens were harvested on day13, splenocytes were restimulated with Alg8 or mouse GP100 peptide, and CD8+ T cell responses to each antigen were determined by intracellular staining for IFN-γ. (G) Mice (n = 10 per group) were injected with TvaxAlg8-Lama4–LLO190/mtIL-12/GM-CSF cells from C57BL/6 (syngeneic), B2m–/– (syngeneic B2m), S129 (allogeneic HLA-matched), or BALB/c (allogeneic HLA-mismatched) mice, and Alg8-specific T cell responses were measured in the blood by tetramer staining. *P < 0.0001 and **P < 0.01 for comparisons at all time points, by Mann-Whitney U test. Error bars represent the SEM. stim, stimulation.
Figure 5
Figure 5. Autocrine effects of mtIL-12 on Tvax cells mediate enhanced immunity of Tvax through IFN-γ.
(A) Schematic of potential mechanisms whereby IL-12 could augment Tvax priming of CD8+ T cell responses. (B) TvaxOVA cells were engineered with and without mtIL-12 using T cells from WT mice and from mice lacking the IL-12R (Il12r-KO) and then administered to WT or Il12r-KO mice (n = 5 mice/group). OVA-specific CD8+ T cells were measured in the blood 8 days after vaccination by tetramer staining. (C) TvaxOVA cells were constructed with either mtIL-12 or IL-12RCA and administered to WT mice. OVA-specific CD8+ T cell responses were measured in the blood 8 days following vaccination by tetramer staining. (D) TvaxOVA cells from WT or Il12r-KO mice or mice lacking IFN-γ (Ifng-KO) were administered to mice of the same genotype, and OVA-specific T cell responses were measured by tetramer staining 8 days later (n = 10 mice/group). (E) TvaxOVA, TvaxOVA/mtIL-12, or Tvax cells engineered with OVA and constitutively expressing IFN-γ (TvaxOVA/IFN-γ) were administered to WT mice, and OVA-specific CD8+ T cells were measured in the blood on day 8 by tetramer staining (n = 10 mice/group). *P < 0.05 and **P < 0.001, by Mann-Whitney U test.
Figure 6
Figure 6. Tvaxmt-IL-12/GM-CSF cells stimulate host DCs through complimentary mechanisms.
Tvax or Tvaxmt-IL-12/GM-CSF cells without antigen were labeled with the lipophilic dye DiI and administered to mice, and splenic DCs were isolated 48 hours after transfer for analysis (n = 4 mice/group). (A) Fraction of DiI+ cells among CD11chiPDCA cDCs. (B) Total number of purified DCs per mouse. (C) Expression of MHC class I, MHC class II, and CD80 on CD8a cDCs was measured by flow cytometry. (D) Expression of CD103, CD80, MHC class I, and CD40 on CD8a+ cDC was measured by flow cytometry. (E) PCA of whole-transcriptome data from DiI+ cDCs isolated from individual mice vaccinated with Tvax with mtIL-12, GM-CSF, or both (n = 4 mice/group, samples were labeled DC2-17). *P < 0.01, by 1-way ANOVA.
Figure 7
Figure 7. Antitumor effects of Tvax in preclinical models.
B16-OVA cells (5 × 10⁵ cells) were injected s.c. into the flank on day 0, and mice were vaccinated (1 × 10⁶ cells) with various Tvax compositions on day 1. (A) Frequency of OVA-specific CD8+ T cells measured in the blood by tetramer staining on day 7 after Tvax administration (n = 5). (B) Tumor growth over time measured with calipers (n = 10), and survival of tumor-bearing mice administered different Tvax regimens. Error bars represent the SEM. (C) B16-OVA cells were injected i.v. into mice on day 0. Mice were vaccinated on day 4, and their survival was measured. (D) B16-GFP-Alg8-Lama4-LLO190 tumor cells were injected on day 0. Mice were vaccinated with TvaxAlg8 Lama4 LLO/mtIL-12/GM-CSF on day 4, and their survival was measured. (E) B16-OVA cells were injected into the flanks of mice and on day 11, when tumors were palpable. Then, mice were injected every 7 days with TvaxmtIL12 GM-CSF made from either WT donors (control) or OVA-expressing donors (Tvax) in combination with albumin-fused IL-2, an anti–PD-1 antibody, and a tumor-reactive anti-TRP1 antibody (n = 10–20/group). *P < 0.05, **P < 0.01, and ***P < 0.0001, by Mann-Whitney U test (B, left panel) and log-rank test (BE).
Figure 8
Figure 8. Human T cells present cancer-derived neoantigens.
(A) Schematic of piggyBac transposon construct to engineer human Tvax. MITD, MHC class I tracking domain; pCMV,cytomegalovirus immediate early promoter; T2A, translational skip sequence from thosea asigna virus; WPRE, woodchuck hepatitis virus posttranscriptional regulatory element. (B) Human T cells were transfected with a transposon encoding CMV and tumor neoantigens, and tCD19 and stably transfected cells were measured 7 days later by staining for surface CD19 (top panel). CD19+ cells were enriched by immunomagnetic selection and expanded in culture for 14 days followed by CD19 staining (bottom panel) (C) T cells from HLA-compatible normal donors were transfected with a transposon containing antigen minigenes and then purified and expanded before use as APCs in vitro. Modified T cells presented the respective antigens to a PWP2-specific CD8+ T cell clone derived from a patient with lung adenocarcinoma, a BRAF V600E–specific CD4+ T cell clone derived from a patient with melanoma, and CD8+ T cells specific for the CMV NLV epitope derived from a healthy donor.

References

    1. Topalian SL, et al. Safety, activity, and immune correlates of anti–PD-1 antibody in cancer. N Engl J Med. 2012;366(26):2443–2454. doi: 10.1056/NEJMoa1200690. - DOI - PMC - PubMed
    1. Brahmer JR, et al. Safety and activity of anti–PD-L1 antibody in patients with advanced cancer. N Engl J Med. 2012;366(26):2455–2465. doi: 10.1056/NEJMoa1200694. - DOI - PMC - PubMed
    1. Tumeh PC, et al. PD-1 blockade induces responses by inhibiting adaptive immune resistance. Nature. 2014;515(7528):568–571. doi: 10.1038/nature13954. - DOI - PMC - PubMed
    1. Philip M, et al. Chromatin states define tumour-specific T cell dysfunction and reprogramming. Nature. 2017;545(7655):452–456. doi: 10.1038/nature22367. - DOI - PMC - PubMed
    1. Pauken KE, et al. Epigenetic stability of exhausted T cells limits durability of reinvigoration by PD-1 blockade. Science. 2016;354(6316):1160–1165. doi: 10.1126/science.aaf2807. - DOI - PMC - PubMed

Publication types

MeSH terms