. 2021 Aug 16;131(16):e146186.
doi: 10.1172/JCI146186.

Cancer-associated mesothelial cells promote ovarian cancer chemoresistance through paracrine osteopontin signaling

Affiliations

Cancer-associated mesothelial cells promote ovarian cancer chemoresistance through paracrine osteopontin signaling

Jin Qian et al. J Clin Invest. .

Abstract

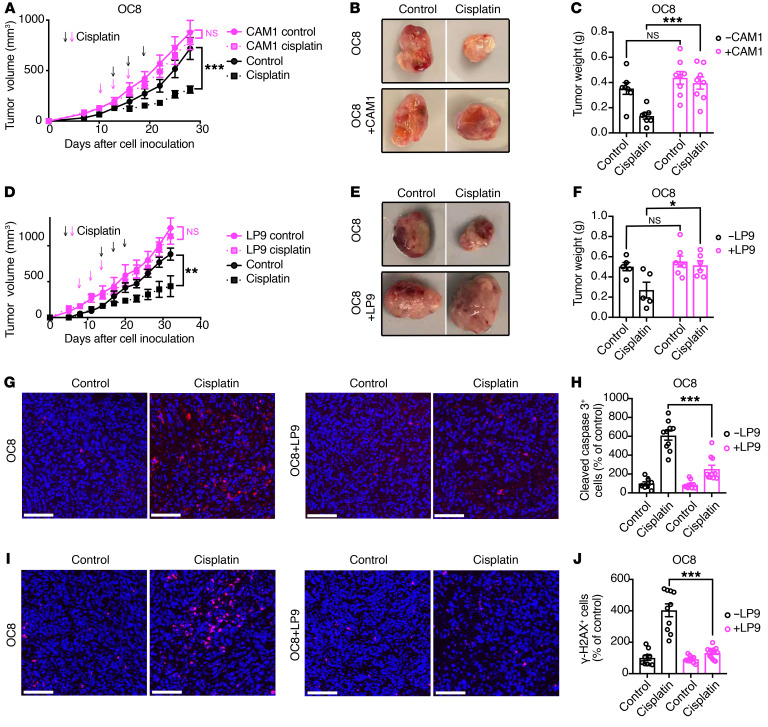
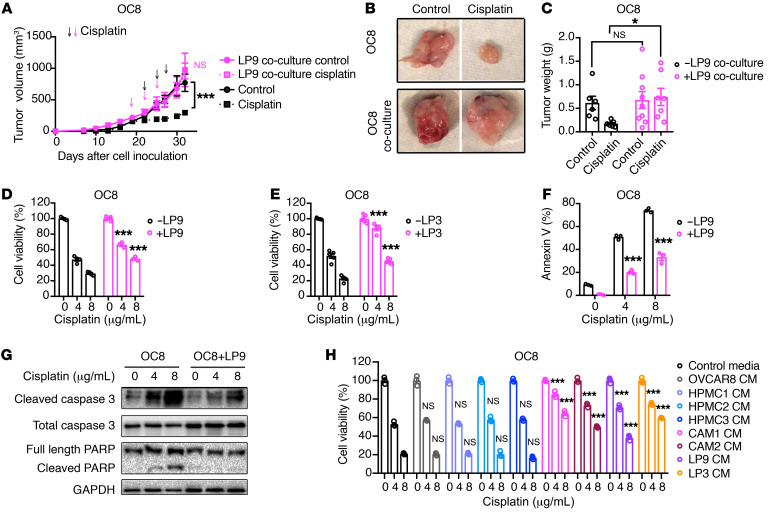
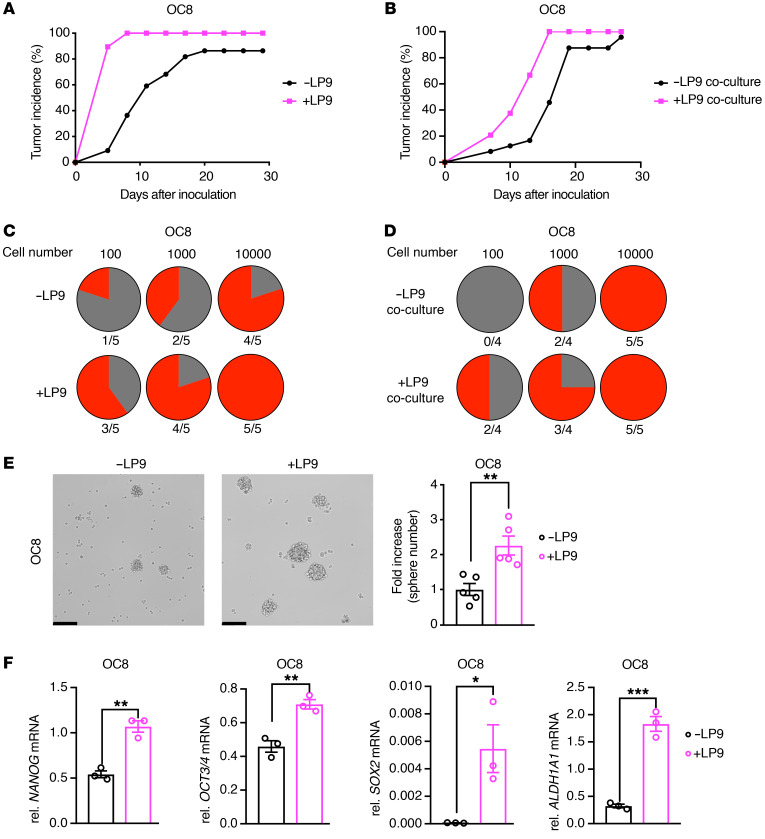
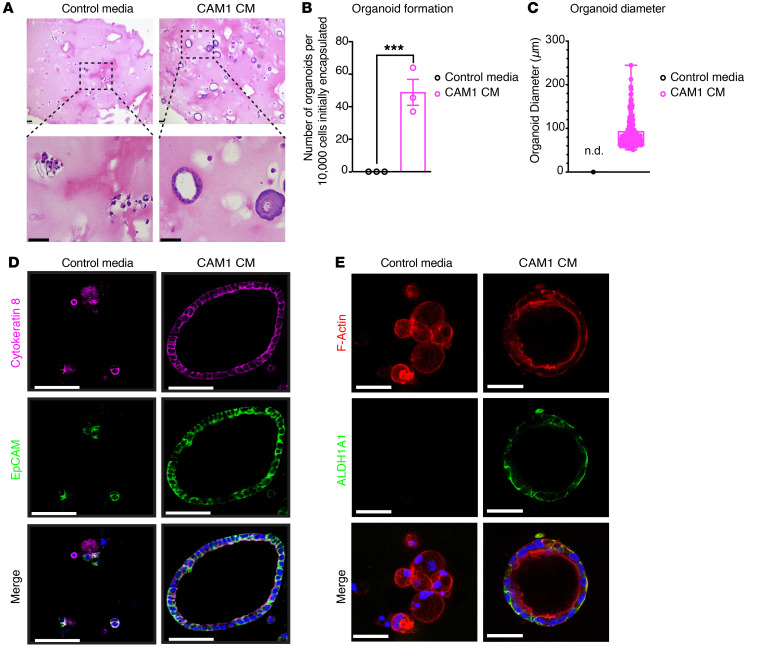
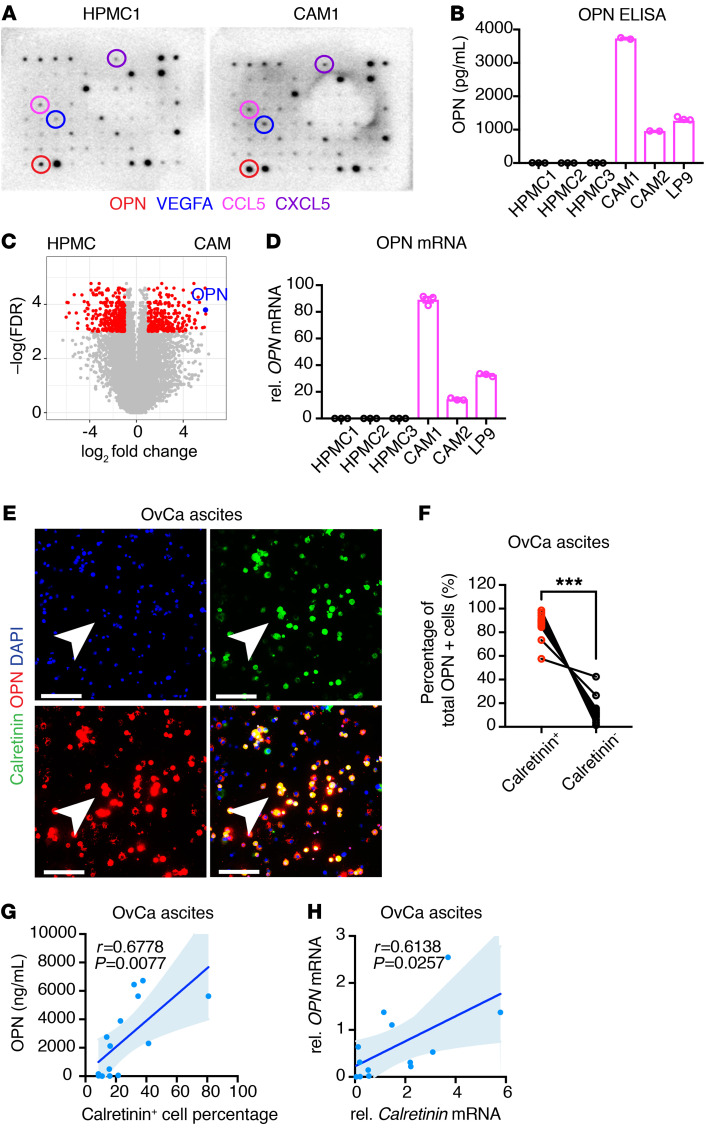
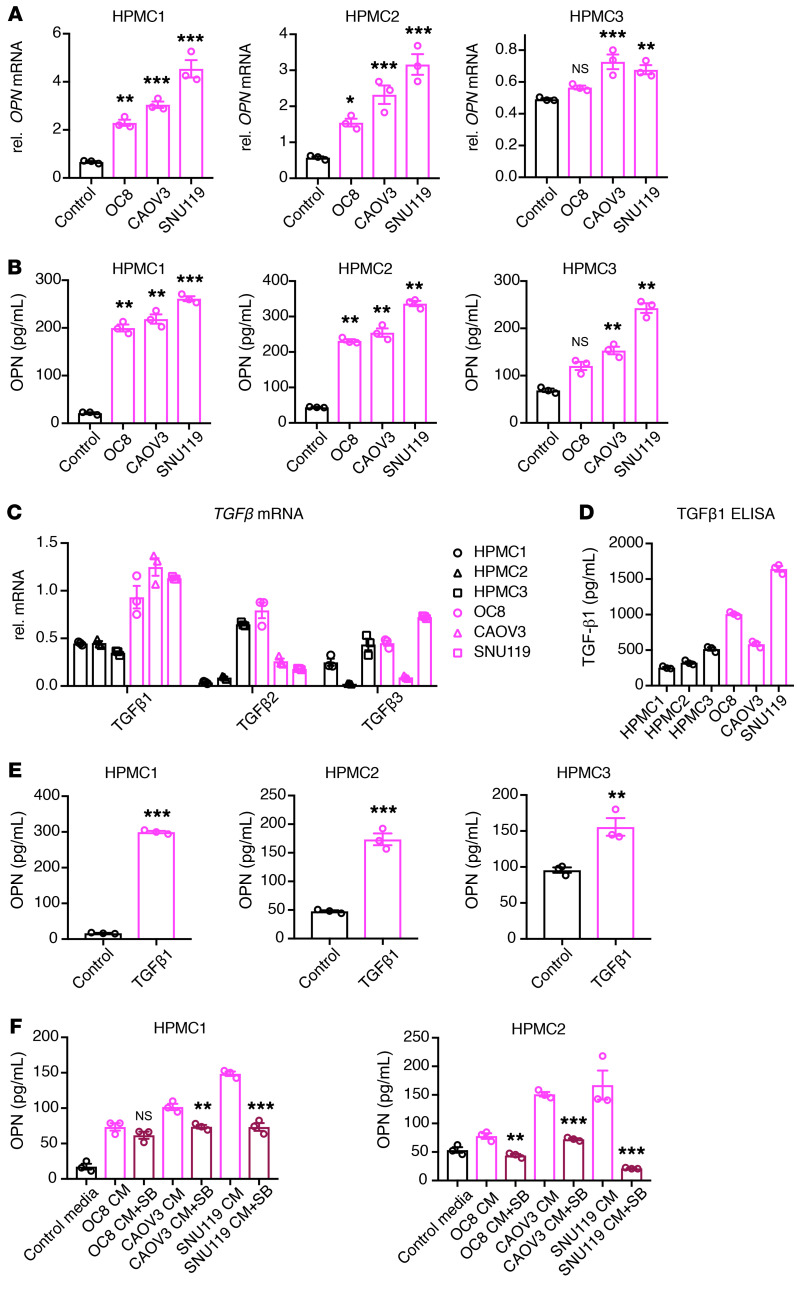
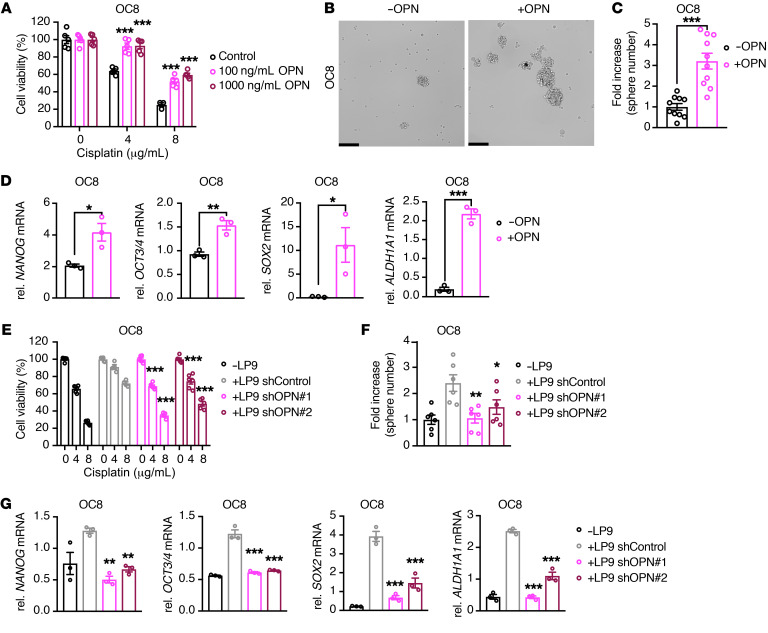
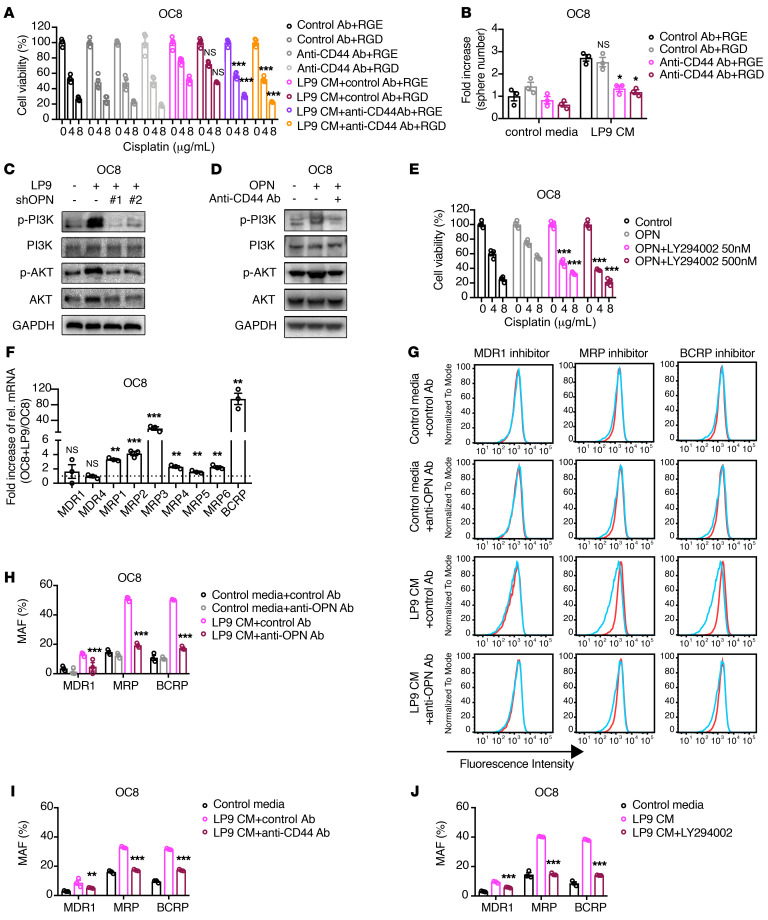
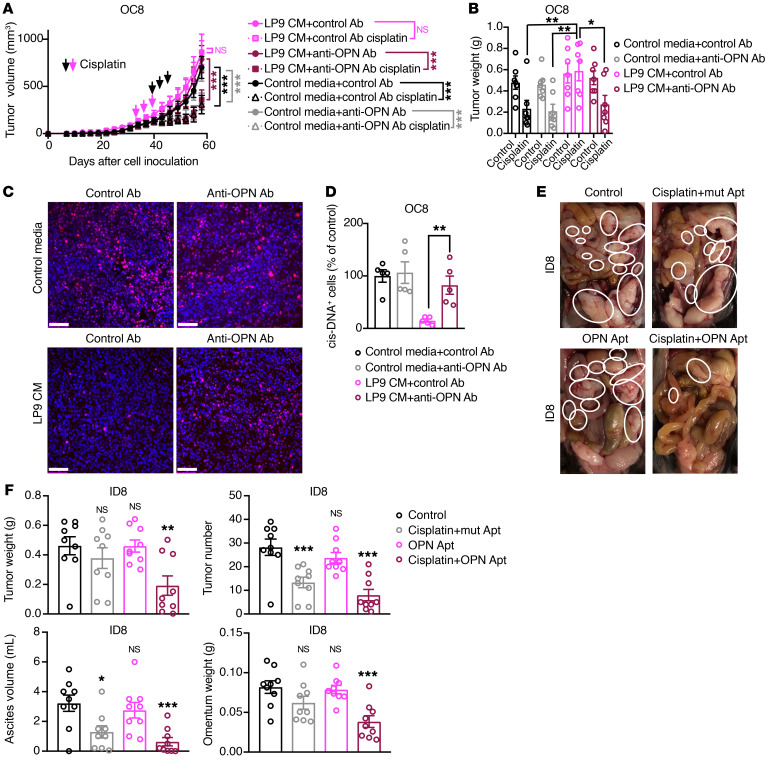
Ovarian cancer is the leading cause of gynecological malignancy-related deaths, due to its widespread intraperitoneal metastases and acquired chemoresistance. Mesothelial cells are an important cellular component of the ovarian cancer microenvironment that promote metastasis. However, their role in chemoresistance is unclear. Here, we investigated whether cancer-associated mesothelial cells promote ovarian cancer chemoresistance and stemness in vitro and in vivo. We found that osteopontin is a key secreted factor that drives mesothelial-mediated ovarian cancer chemoresistance and stemness. Osteopontin is a secreted glycoprotein that is clinically associated with poor prognosis and chemoresistance in ovarian cancer. Mechanistically, ovarian cancer cells induced osteopontin expression and secretion by mesothelial cells through TGF-β signaling. Osteopontin facilitated ovarian cancer cell chemoresistance via the activation of the CD44 receptor, PI3K/AKT signaling, and ABC drug efflux transporter activity. Importantly, therapeutic inhibition of osteopontin markedly improved the efficacy of cisplatin in both human and mouse ovarian tumor xenografts. Collectively, our results highlight mesothelial cells as a key driver of ovarian cancer chemoresistance and suggest that therapeutic targeting of osteopontin may be an effective strategy for enhancing platinum sensitivity in ovarian cancer.

Keywords: Cancer; Cytokines; Oncology; Signal transduction.


Conflict of interest statement

Conflict of interest: OD reports receiving speakers bureau honoraria from Tesaro and AstraZeneca and is a consultant/advisory board member for Merck, Tesaro/GSK, PACT, Clovis, and Genentech.

Figures

Figure 1
Figure 1. Cancer-associated mesothelial cells promote ovarian cancer platinum resistance.
(AF) Effect of primary CAM1 (AC) or LP9 (DF) coinjection on cisplatin response of primary OC8 HGSOC cells in vivo. OC8 cells or OC8 cells plus LP9 or CAM1 mesothelial cells were injected subcutaneously into female immunodeficient mice and treated with or without cisplatin every 3 days for 3 cycles. Tumor growth curves are shown in A (n = 7–8 mice per group) and D (n = 5–7 mice per group). Representative xenograft images are shown in B and E. Xenograft weights at the end point are shown in C and F. Arrows show scheme of cisplatin treatment: magenta arrows for mesothelial cell–coinjected groups, black arrows for OC8 cell alone groups. (GJ) Representative images and quantification of cleaved caspase-3 (G and H) and γ-H2AX (I and J) immunofluorescence staining in OC8 and LP9 coinjected tumors. Scale bars: 100 μm. Quantification of positive cells (percentage of control) is based on 10 random fields from more than 3 tumors in each group. Each dot represents 1 field. Nuclei were stained with DAPI (blue). Data are presented as mean ± SEM. *P < 0.05; **P < 0.01; ***P < 0.001, 2-way ANOVA (A, C, D, and F) and 2-tailed Student’s t test (H and J).
Figure 2
Figure 2. Secreted factor or factors from cancer-associated mesothelial cells promote ovarian cancer chemoresistance.
(AC) Effect of LP9 coculture on cisplatin resistance of OC8 cells in vivo. Tumor cells were indirectly cocultured with or without LP9 mesothelial cells in vitro and then were injected subcutaneously into immunodeficient mice, followed by treatment with or without cisplatin every 3 days for 3 cycles. Tumor growth curve is shown in A (n = 6–9 mice per group). Representative xenograft images are shown in B. Xenograft weights at the end point are shown in C. Arrows show scheme of cisplatin treatment: magenta arrows for mesothelial cell–conditioned groups, black arrows for unconditioned OC8 cell groups. (D and E) Effect of LP9 or LP3 coculture on the cisplatin sensitivity of OC8 cells. Cell viability is normalized to its untreated control and statistically compared with OC8 monoculture group (n = 3–5). (F) Percentages of annexin V+ apoptotic OC8 cells with or without LP9 preconditioning. Each group is statistically compared with OC8 monoculture group (n = 3). (G) Western blot analysis of cisplatin-induced apoptotic markers in OC8 after LP9 coculture. (H) Effect of conditioned media (CM) from HPMCs and cancer-associated mesothelial cells on OC8 cisplatin sensitivity. Cell viability is normalized to its untreated control and statistically compared with control media group (n = 3). Data are presented as mean ± SEM. **P < 0.05; ***P < 0.001, 2-way ANOVA (A, CF, and H).
Figure 3
Figure 3. Cancer-associated mesothelial cells promote ovarian cancer stemness through secreted factors.
(A and B) Effect of LP9 coinjection (A, n = 20–22 mice per group) or coculture (B, n = 24 mice per group) on OC8 tumor incidence in immunodeficient mice. (C and D) In vivo limiting dilution assays showing tumor formation rate (red portion) of LP9 coinjected (C) or in vitro cocultured (D) OC8 tumors at indicated cancer cell numbers (n = 4–5 mice per group). (E) Sphere-formation assay of OC8 cells after LP9 coculture. Representative sphere images and quantification of sphere number fold increase (n = 5). Scale bars: 200 μm. (F) Real-time PCR analysis showing relative mRNA expression of the stemness markers NANOG, OCT3/4, SOX2, and ALDH1A1 in OC8 after LP9 coculture, as normalized to GAPDH mRNA (n = 3). Data are presented as mean ± SEM. *P < 0.05; **P < 0.01; ***P < 0.001, 2-tailed Student’s t test (E and F).
Figure 4
Figure 4. Cancer-associated mesothelial cells promote ovarian cancer organoid formation through secreted factors.
(A) Representative H&E images of ovarian cancer organoids in 3D. Scale bars: 100 μm (upper panels); 50 μm (lower panels). (B) Ovarian cancer organoid formation per 10,000 initially encapsulated EpCAM+ ovarian cancer cells with addition of paired CAM1-conditioned media or control media (n = 3). (C) Ovarian cancer organoid diameter (defined as cell clusters > 50 μm in diameter with lumen) with addition of paired CAM1-conditioned media or control media. Each point represents 1 organoid. n.d., none detected. (D) Immunofluorescent staining of cytokeratin-8 (magenta) and EpCAM (green) in ovarian cancer organoids grown in CAM1-conditioned media or in control media. Nuclei were stained with DAPI (blue). Scale bars: 50 μm. (E) Immunofluorescence of F-actin (red) and stemness marker ALDH1A1 (green) in ovarian cancer organoids grown in CAM-conditioned media or in control media. Nuclei were stained with DAPI (blue). Scale bars: 50 μm. Data are presented as mean ± SEM. ***P < 0.001, 2-tailed Student’s t test (B).
Figure 5
Figure 5. Cancer-associated mesothelial cells secrete OPN.
(A) Cytokine array in conditioned media of HPMC1 and CAM1. Circles highlight cytokine of the highest increase in CAM1- compared with HPMC1-conditioned media in each individual color. (B) Quantification of OPN concentration in conditioned media from HPMCs and CAMs by ELISA (n = 2 or 3). (C) Volcano plot of RNA-Seq showing differential gene expression in CAMs versus HPMCs (GSE84829). (D) Real-time PCR analysis of relative mRNA expression of OPN in HPMCs and CAMs, as normalized to GAPDH mRNA (n = 3). (E) Immunofluorescence of OPN (red) and mesothelial cell marker calretinin (green) in total ascites cells from HGSOC patients. Arrowheads denote costained mesothelial cells. Nuclei were stained with DAPI (blue). Scale bars: 100 μm. (F) Percentages of total OPN-positive cells in paired calretinin+ and calretinin ascites cells of ovarian cancer patients (n = 14). (G) Correlation of ascites OPN concentration and calretinin+ cell percentages in total ascites cells of ovarian cancer patients (n = 14; Pearson’s correlation). (H) Correlation of OPN and calretinin expression in total ascites cells of ovarian cancer patients (n = 13; Pearson’s correlation). Data are presented as mean ± SEM. ***P < 0.001, 2-tailed Student’s t test (F).
Figure 6
Figure 6. Ovarian cancer cells induce OPN expression in mesothelial cells through TGF-β signaling.
(A) Real-time PCR analysis of relative OPN mRNA expression in HPMCs alone or cocultured with ovarian cancer cells, as normalized to GAPDH mRNA and statistically compared with HPMC cultured–alone group (n = 3). (B) ELISA quantification of OPN concentration in conditioned media from HPMCs alone or HPMCs cocultured with various ovarian cancer cells. Each group is statistically compared with HPMC cultured–alone group (n = 3). (C) Real-time PCR analysis of relative TGFB1, TGFB2, and TGFB3 expression in HPMCs or ovarian cancer cells, as normalized to GAPDH mRNA (n = 3). (D) ELISA quantification of TGF-β1 concentration in conditioned media from HPMCs or ovarian cancer cells (n = 3). (E) ELISA quantification of OPN concentration in conditioned media from HPMCs treated with PBS or TGF-β1 (10 ng/ml) for 3 days (n = 3). (F) ELISA quantification of OPN concentration in conditioned media from HPMCs cultured in control media, HPMCs treated with ovarian cancer cell–conditioned media, or HPMCs treated with ovarian cancer cell–conditioned media plus SB431542 (SB). Group with ovarian cancer cell–conditioned media plus SB431542 treatment is statistically compared with respective ovarian cancer cell–conditioned media treated–alone group. Data are presented as mean ± SEM. *P < 0.05; **P < 0.01; ***P < 0.001, 1-way ANOVA (A, B, and F) and 2-tailed Student’s t test (E).
Figure 7
Figure 7. Cancer-associated mesothelial cells promote ovarian cancer cell chemoresistance and stemness through OPN.
(A) Effect of exogenous OPN on cisplatin sensitivity of OC8 cells. Cell viability is normalized to its untreated control and statistically compared with the group without OPN treatment (n = 3–5). (B and C) Sphere-formation assay of OC8 after OPN exposure. Representative sphere images and quantification of sphere-number fold increase are shown (n = 10). Scale bars: 200 μm. (D) Real-time PCR analysis showing relative mRNA expression of stemness markers NANOG, OCT3/4, SOX2, and ALDH1A1 in OC8 cells after OPN exposure, as normalized to GAPDH mRNA (n = 3). (E) Cell viability of OC8 cells treated with cisplatin after coculture with LP9 control knockdown (shControl) or LP9 shOPN. Cell viability is normalized to its untreated control and statistically compared with the LP9 shControl group (n = 6). (F) Sphere-formation assay of OC8 after coculture with LP9 shControl or LP9 shOPN. Quantification of sphere-number fold increase is shown (n = 6). Each group is statistically compared with the LP9 shControl group. (G) Real-time PCR analysis showing relative mRNA expression of stemness markers NANOG, OCT3/4, SOX2, and ALDH1A1 in OC8 with LP9 shControl or LP9 shOPN coculture, as normalized to GAPDH mRNA and statistically compared with the LP9 shControl group (n = 3). Data are presented as mean ± SEM. *P < 0.05; **P < 0.01; ***P < 0.001, 2-way ANOVA (A and E), 2-tailed Student’s t test (B and C), and 1-way ANOVA (F and G).
Figure 8
Figure 8. Cancer-associated mesothelial cells promote ovarian cancer cell chemoresistance and ABC drug transporter activity through OPN, CD44, and PI3K/AKT signaling.
(A and B) Effect of the anti-CD44 blocking Ab and/or integrin-blocking RGD peptide on LP9-conditioned media–mediated cisplatin resistance (A) or sphere-formation increase (B) of OC8 cells. Each group is statistically compared with LP9-conditioned media plus control Ab plus RGE group (n = 3 or 4). (C) Western blot showing PI3K/AKT signaling in OC8 cells cocultured with LP9 shControl or LP9 shOPN cells. (D) Western blot showing PI3K/AKT signaling in OC8 cells treated with exogenous OPN and/or anti-CD44 blocking Ab. (E) Effect of PI3K/AKT pathway inhibitor LY294002 on OPN-mediated cisplatin resistance of OC8 cells. Each group is statistically compared with exogenous OPN–alone group (n = 4). (F) Fold increase of relative mRNA expression of ABC transporters in OC8 with LP9 coculture versus OC8 monoculture, as normalized to GAPDH mRNA in real-time PCR analysis (n = 3). (G and H) Multidrug resistance assay detecting the activity of major types of ABC transporters (MDR1, MRP, and BCRP) in OC8 cells treated with LP9-conditioned media and/or anti-OPN Ab. Cyan histograms show dye retention of untreated cell, and red histograms show dye retention of respective inhibitor-treated cells in G. The same untreated cells in cyan are used in each row of histograms. Multidrug resistance activity factor (MAF) indicative of corresponding ABC drug transporter activity is shown in H and statistically compared with LP9-conditioned media plus control Ab group (n = 3). (I and J) Multidrug resistance assay detecting ABC transporter activity in OC8 cells treated with LP9-conditioned media and/or anti-CD44 blocking Ab (I) or the PI3K/AKT inhibitor LY294002 (J). MAF indicates corresponding ABC protein activity and is statistically compared with LP9-conditioned media or LP9-conditioned media plus control Ab group (n = 3). Data are presented as mean ± SEM. *P < 0.05; **P < 0.01; ***P < 0.001, 2-way ANOVA (A, B, E, and HJ) and 2-tailed Student’s t test (F).
Figure 9
Figure 9. Therapeutic inhibition of OPN enhances the efficacy of cisplatin in human and mouse ovarian cancer xenografts.
(A and B) Effect of preincubation with an anti-OPN Ab in the absence or presence of LP9-conditioned media on cisplatin sensitivity of OC8 subcutaneous tumors in immunodeficient mice (n = 7 mice per group). Tumor growth curves are shown in A. Xenograft weights at the end point are shown in B. Arrows show scheme of cisplatin treatment every 3 days for 3 cycles: magenta for LP9-conditioned media with control Ab groups, black for other groups. (C and D) Representative images (C) and quantification of cisplatin-DNA adduct immunofluorescence staining (D) in tumors of OC8 model. Quantification of positive cells (percentages of control media with control Ab group) is based on 5 random fields from 3 tumors in each group. Each dot represents 1 field. Nuclei were stained with DAPI (blue). Scale bars: 100 μm. (E and F) Representative images of tumor metastases (highlighted by white circles in E) in female C57BL/6J mice injected intraperitoneally with ID8 cells and then treated with a mutant OPN aptamer (mut apt) as control, cisplatin, OPN aptamer (OPN apt), or combination therapy (n = 9 mice per group). Tumor weight, tumor number, ascites volume, and omentum weights at the end point are shown in F. Each group is statistically compared with control group in F. Data are presented as mean ± SEM. *P < 0.05; **P < 0.01; ***P < 0.001, 2-way ANOVA (A and B), 2-tailed Student’s t test (D) and 1-way ANOVA test (F).

References

    1. Henley SJ, et al. Annual report to the nation on the status of cancer, part II: Progress toward Healthy People 2020 objectives for 4 common cancers. Cancer. 2020;126(10):2020–2266. - PMC - PubMed
    1. Bowtell DD, et al. Rethinking ovarian cancer II: reducing mortality from high-grade serous ovarian cancer. Nat Rev Cancer. 2015;15(11):668–679. doi: 10.1038/nrc4019. - DOI - PMC - PubMed
    1. Matulonis UA, et al. Ovarian cancer. Nat Rev Dis Primers. 2016;2:16061. - PMC - PubMed
    1. Morgan RJ, Jr, et al. Epithelial ovarian cancer. J Natl Compr Canc Netw. 2011;9(1):82–113. doi: 10.6004/jnccn.2011.0008. - DOI - PubMed
    1. Davidowitz RA, et al. Mesenchymal gene program-expressing ovarian cancer spheroids exhibit enhanced mesothelial clearance. J Clin Invest. 2014;124(6):2611–2625. doi: 10.1172/JCI69815. - DOI - PMC - PubMed

Publication types

MeSH terms