. 2021 Aug 13;100(32):e26932.
doi: 10.1097/MD.0000000000026932.

Intestinal flora differences between patients with ulcerative colitis of different ethnic groups in China

Affiliations

Intestinal flora differences between patients with ulcerative colitis of different ethnic groups in China

Huan Liu et al. Medicine (Baltimore). .

Abstract

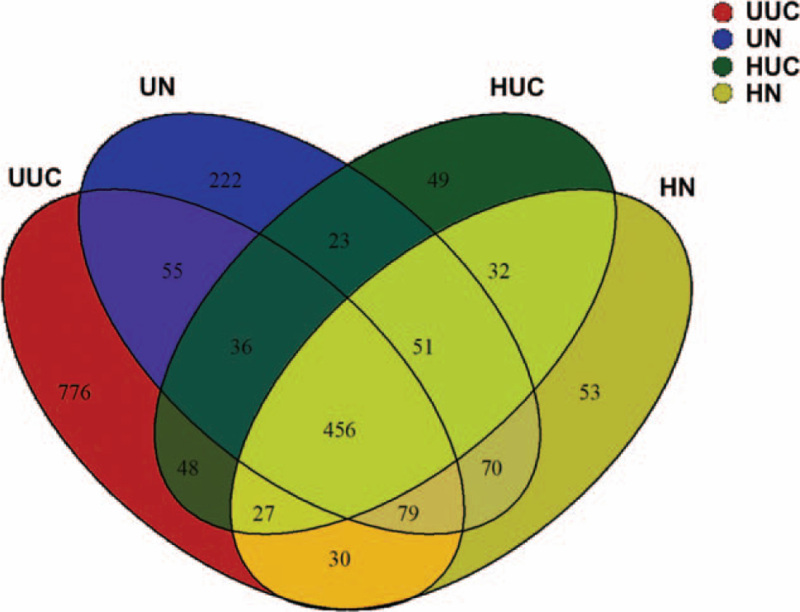
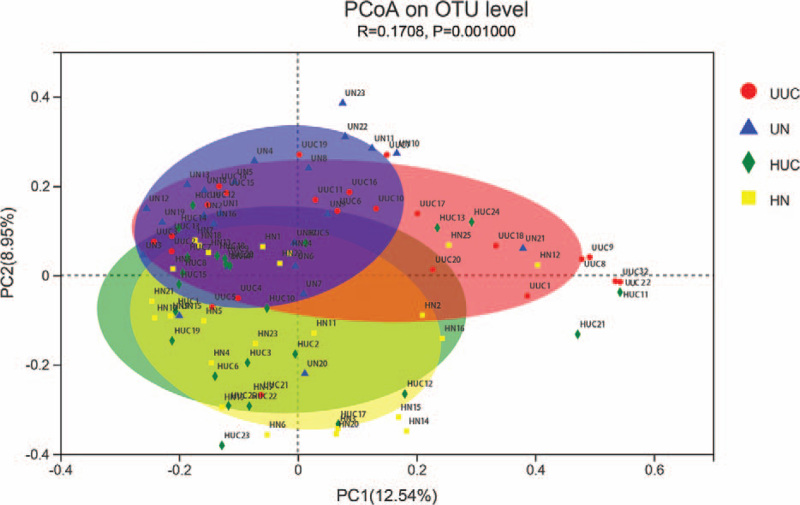
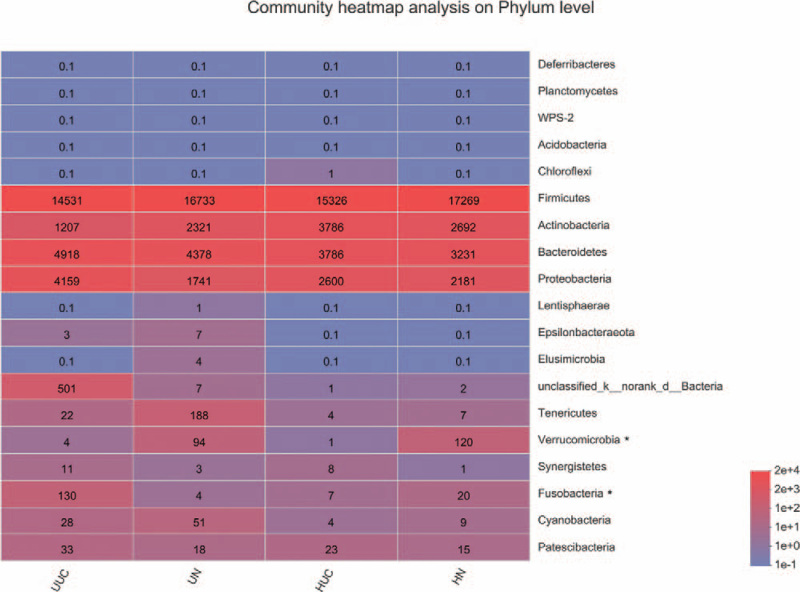
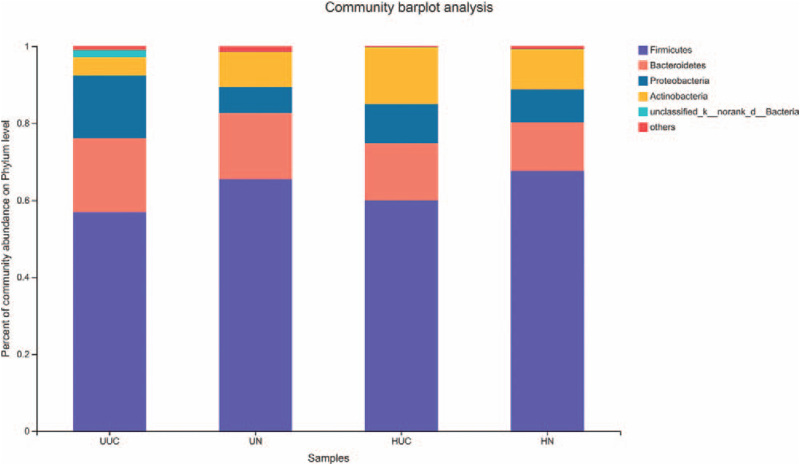
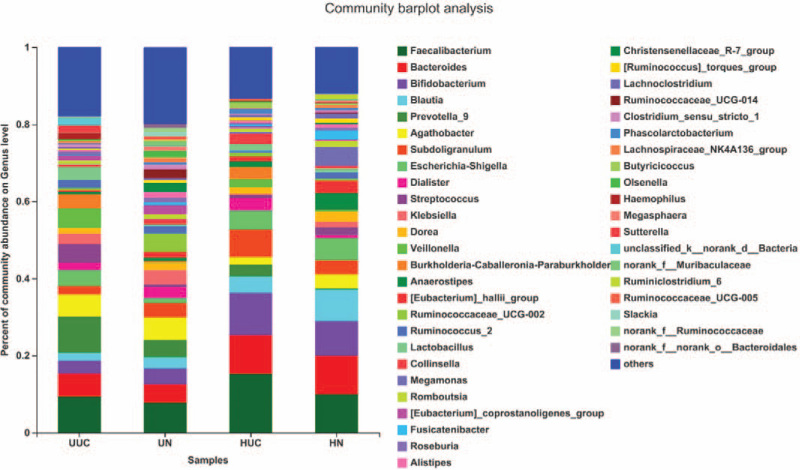
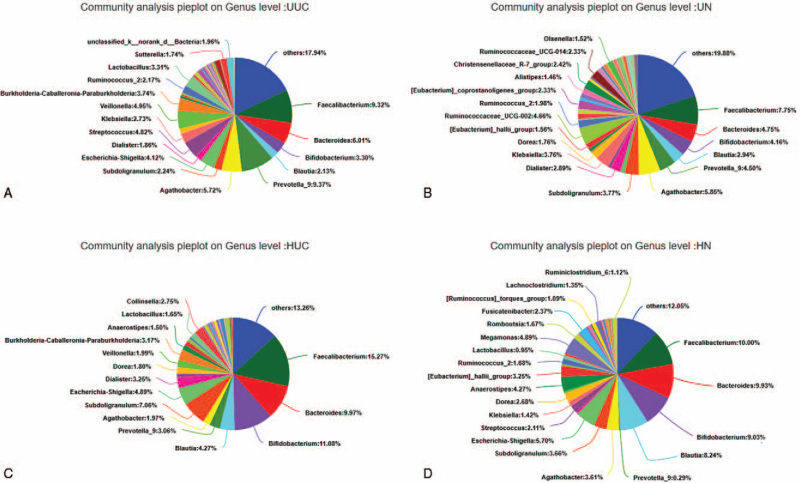
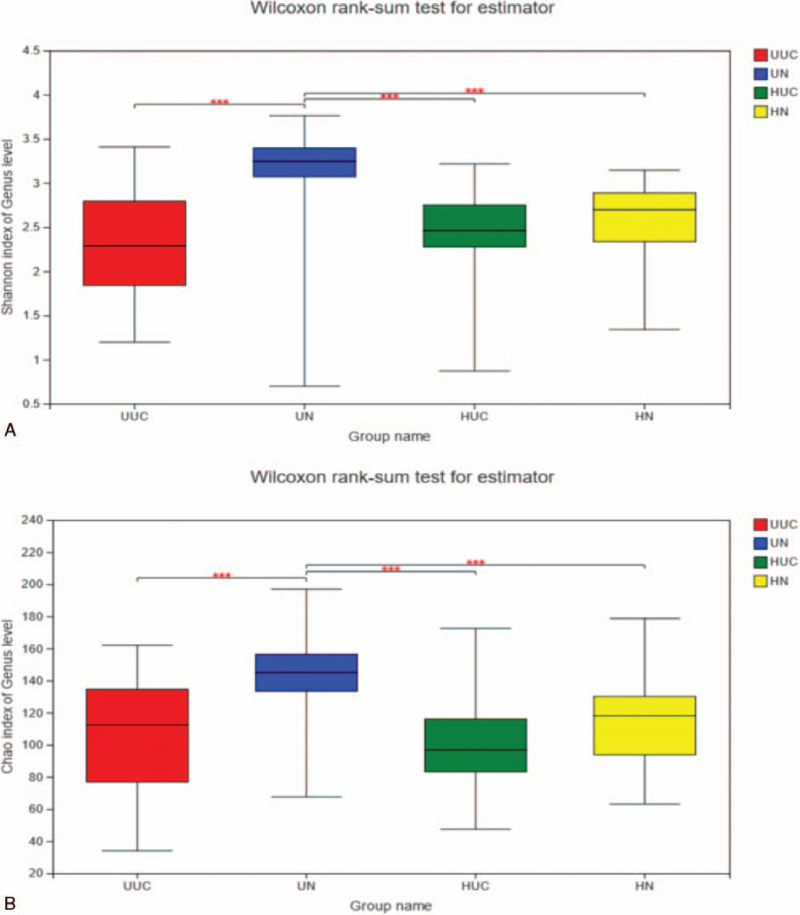
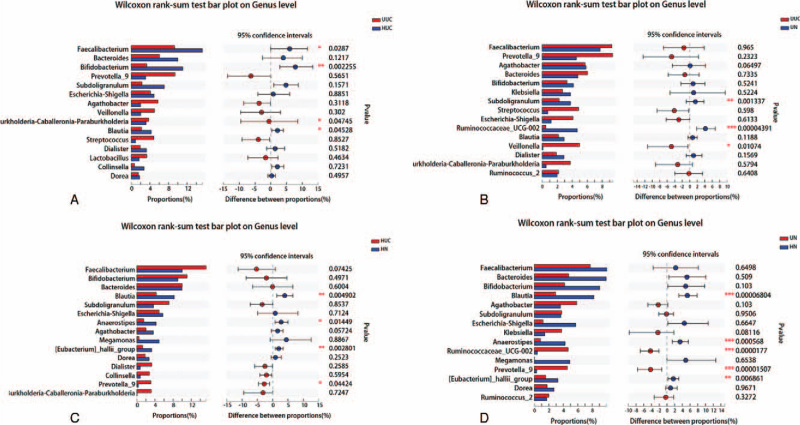
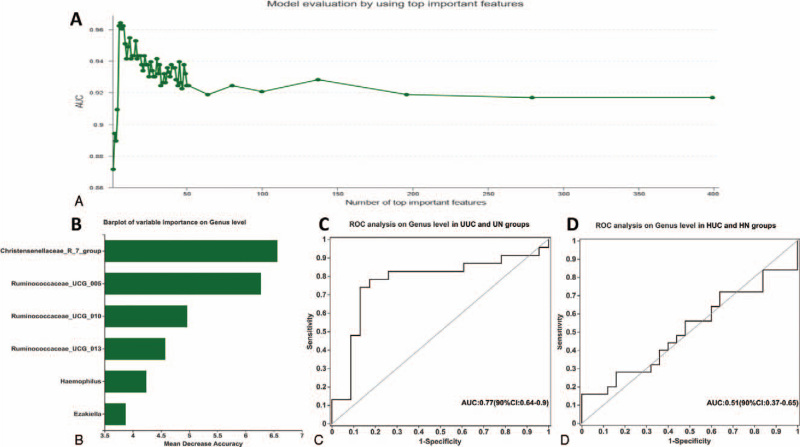
To determine the differences in intestinal flora between Uygur and Han patients with ulcerative colitis (UC).Microbial diversity and structural composition of fecal bacteria from patients with UC and their matched healthy spouses or first-degree relatives were analyzed using high-throughput sequencing technology.The fecal microbial diversity and abundance index of Uygur patients with UC (UUC) were significantly lower compared with the Uygur normal control group, while there was no significant difference between the Han UC patients (HUC) and the Han normal control group (HN). Compared with their respective control groups, Uygur UC patients and Han UC patients had a different main composition of human intestinal flora (P < .05). The abundance of Burkholderia, Caballeronia, Paraburkholderia in the UUC group were higher compared with the HUC group, while Faecalibacterium, Bifidobacterium, and Blautia in the HUC group were higher than those in the UUC group (P < .05). Veillonella in the UUC group was higher than that in the Uygur normal control group group, while Subdoligranulum and Ruminococcaceae_UCG-002 were significantly lower (P < .05). Prevotella_9 in the HUC group was significantly higher than that in HN group, while Blautia, Anaerostipes, and [Eubacterium]_hallii_group were significantly lower. Moreover, the top 6 species in order of importance were Christensenellaceae_R_7_group, Ruminococcae_ucg_005, Ruminococcae_ucg_010, Ruminococcae_ucg_013, Haemophilus, and Ezakiella.The difference in intestinal microflora structure may be one of the reasons for the clinical heterogeneity between Uygur and Han patients with UC. Christensenellaceae_R_7_group, Ruminococcae_ucg_005, Ruminococcae_ucg_010, Ruminococcae_ucg_013, Haemophilus, and Ezakiella could be used as potential biomarkers for predicting UC.


Conflict of interest statement

The authors have no conflicts of interest to disclose.

Figures

Figure 1
Figure 1
Venn diagram of OTU in the 4 groups. Different colors represent different groups. The number of overlapping part represents the number of OTUs shared by different groups, while the number of non-overlapping parts represents the number of OTUs unique to the corresponding group.
Figure 2
Figure 2
Principal coordinate analysis plots in fecal microbiota. Bray_curtis PCoA plot based on OTU abundance. Each point represents the microbiome of a sample, with Uyghur UC group (red triangle), Uyghur normal control group (blue triangle), Han UC group (green triangle), and Han normal control group (HN) (yellow circle). PCoA = principal coordinate analysis, UC = ulcerative colitis.
Figure 3
Figure 3
Heatmap analyses of abundant phylum in each group. The abscissa is the group name, and the ordinate is the species name. The color gradient shows the abundance changes of different species in each group of samples. The right side of the figure is the value represented by the color gradient. The taxa of interest are marked with the asterisk.
Figure 4
Figure 4
Analysis of microbial community composition among 4 groups at phylum level. The ordinate is the proportion of the sample species. The columns with different colors represent different species, and the length of the columns represents the proportion of the species.
Figure 5
Figure 5
Analysis of microbial community composition among 4 groups at genus level. The ordinate is the proportion of the species in the sample. The columns with different colors represent different species, and the length of the columns represents the proportion of the species.
Figure 6
Figure 6
Microbial community composition of each group at genus level. Different colors represent different species, and the pie area represents the percentage of the species.
Figure 7
Figure 7
(A) Wilcoxon rank-sum test for Shannon index. Using Shannon index to estimate the α-diversity of each group at the genus level. P < .05, ∗∗P < .01, ∗∗∗P < .001. (B) Wilcoxon rank-sum test for Chao index. Using Chao index to estimate the α-diversity of each group at the genus level. P < .05, ∗∗P < .01, ∗∗∗P < .001.
Figure 8
Figure 8
The top 15 species with the highest richness at genus level among different groups. X axis represents different groups, different color boxes represent different groups, and Y axis represents average relative abundance of a species in different groups. (∗∗P < .01, P < .05, Mann–Whitney U test).
Figure 9
Figure 9
Based on species at genus level, the diagnostic models were constructed to distinguish UC patients from healthy controls. (A) The AUC value of the random forest model constructed in the UUC and UN validation cohorts; (B) the top 6 species that can distinguish UUC from UN; (C) ROC analysis on gene level in UUC and UN groups; (D) ROC analysis on gene level in HUC and HN groups. AUC = area under the curve, HN = Han normal control group, HUC = Han patients with UC, ROC = receiving operational curve, UC = ulcerative colitis, UN = Uygur normal control group, UUC = Uygur patients with UC.

References

    1. Ordás I, Eckmann L, Talamini M, Baumgart DC, Sandborn WJ. Ulcerative colitis. Lancet 2012;380:1606–19. - PubMed
    1. Le Gall G, Noor SO, Ridgway K, et al. . Metabolomics of fecal extracts detects altered metabolic activity of gut microbiota in ulcerative colitis and irritable bowel syndrome. J Proteome Res 2011;10:4208–18. - PubMed
    1. Allegretti JR, Hamilton MJ. Restoring the gut microbiome for the treatment of inflammatory bowel diseases. World J Gastroenterol 2014;20:3468–74. - PMC - PubMed
    1. Lin Z, Zu XP, Xie HS, et al. . Research progress in mechanism of intestinal microorganisms in human diseases. Yao Xue Xue Bao 2016;51:843–52. - PubMed
    1. Arpaia N, Campbell C, Fan X, et al. . Metabolites produced by commensal bacteria promote peripheral regulatory T-cell generation. Nature 2013;504:451–5. - PMC - PubMed

Substances