. 2021 Aug 2;62(10):14.
doi: 10.1167/iovs.62.10.14.

Increased Susceptibility and Intrinsic Apoptotic Signaling in Neurons by Induced HDAC3 Expression

Affiliations

Increased Susceptibility and Intrinsic Apoptotic Signaling in Neurons by Induced HDAC3 Expression

Heather M Schmitt et al. Invest Ophthalmol Vis Sci. .

Abstract

Purpose: Inhibition or targeted deletion of histone deacetylase 3 (HDAC3) is neuroprotective in a variety neurodegenerative conditions, including retinal ganglion cells (RGCs) after acute optic nerve damage. Consistent with this, induced HDAC3 expression in cultured cells shows selective toxicity to neurons. Despite an established role for HDAC3 in neuronal pathology, little is known regarding the mechanism of this pathology.

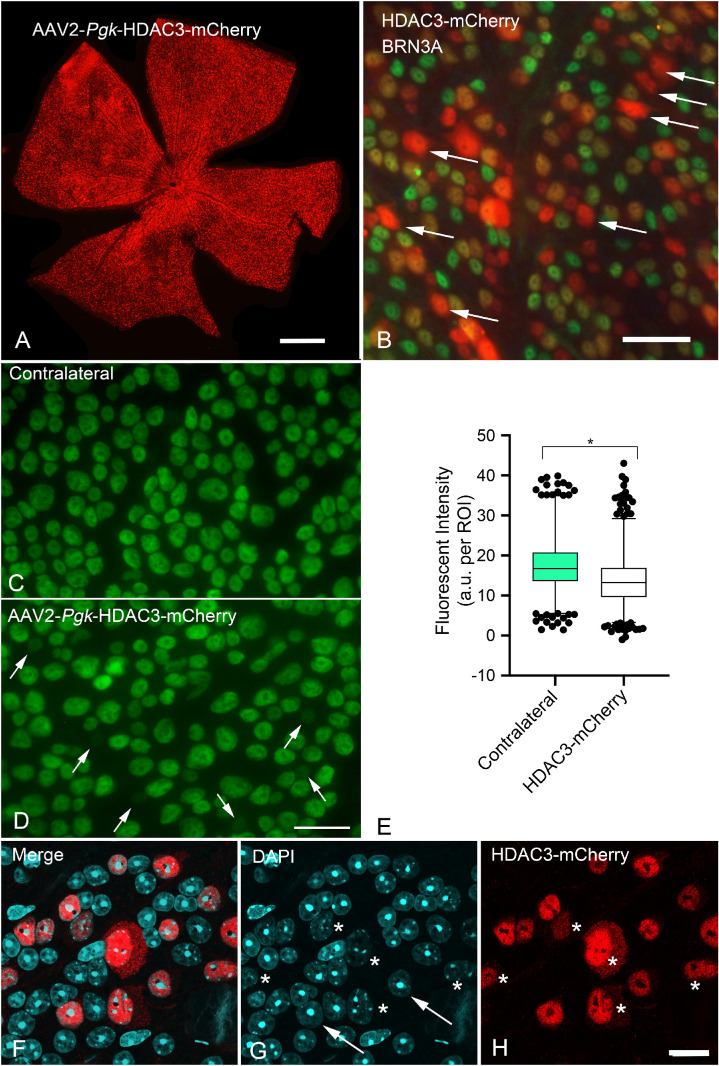
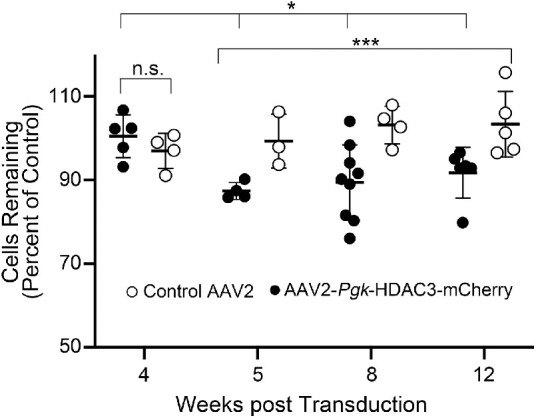
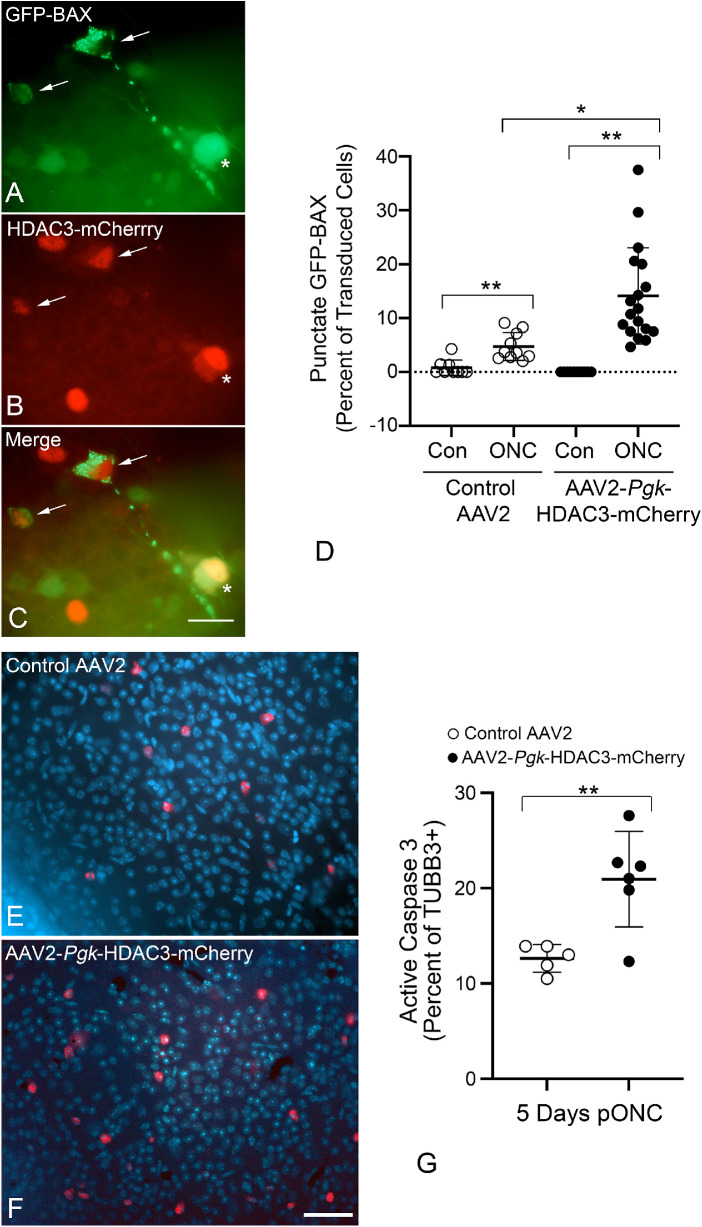
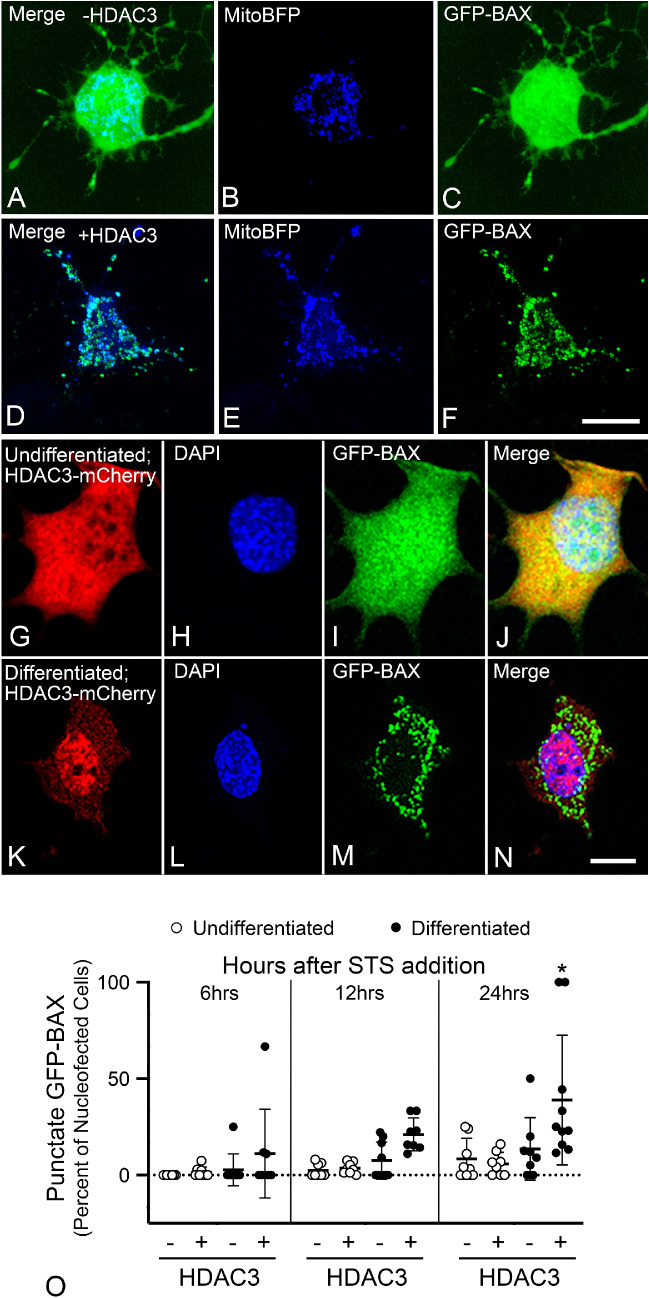
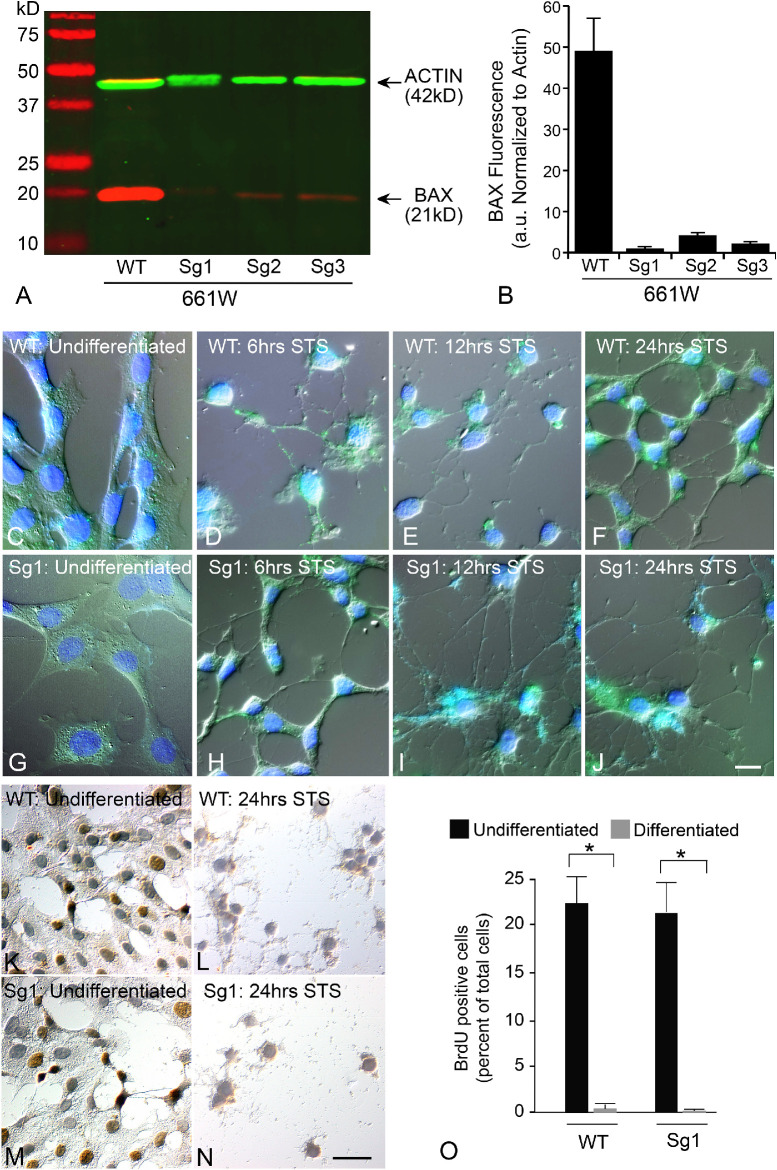
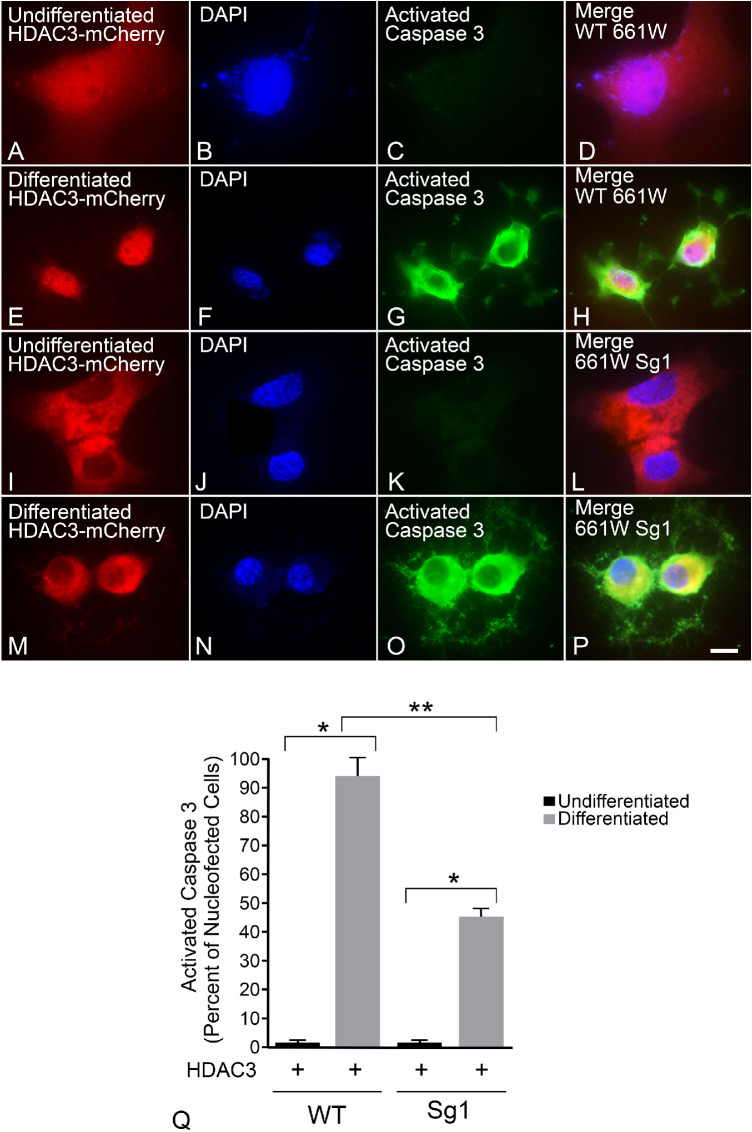
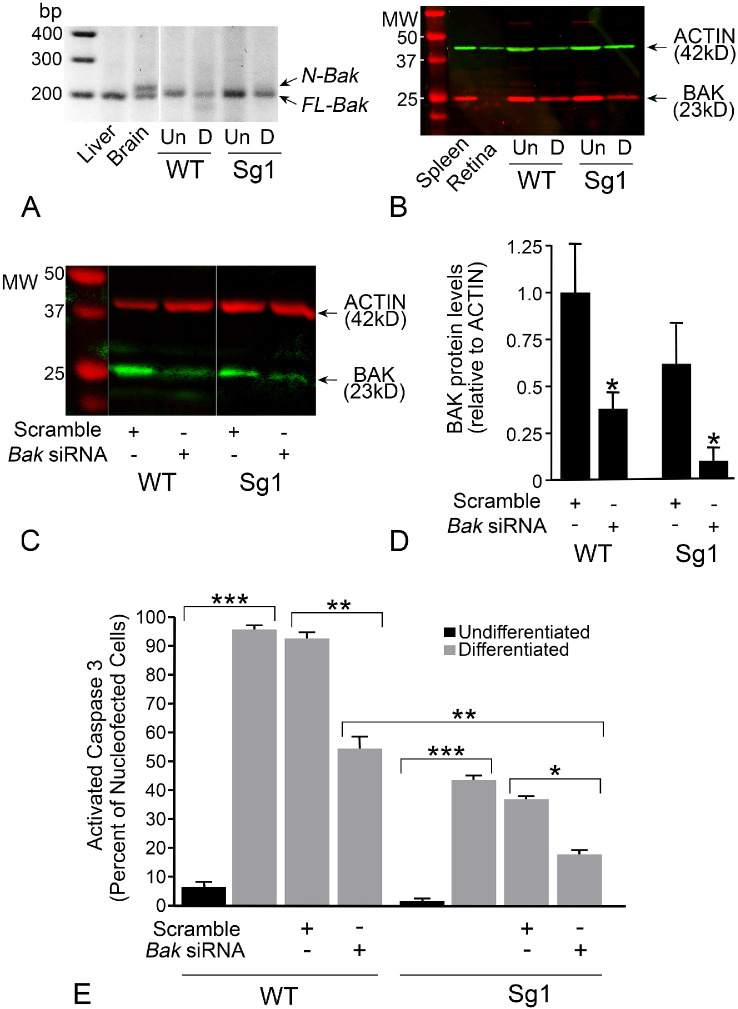
Methods: Induced expression of an HDAC3-mCherry fusion protein in mouse RGCs was accomplished by transduction with AAV2/2-Pgk-HDAC3-mCherry. Increased susceptibility to optic nerve damage in HDAC3-mCherry expressing RGCs was evaluated in transduced mice that received acute optic nerve crush surgery. Expression of HDAC3-FLAG or HDAC3-mCherry was induced by nucleofection or transfection of plasmids into differentiated or undifferentiated 661W tissue culture cells. Immunostaining for cleaved caspase 3, localization of a GFP-BAX fusion protein, and quantitative RT-PCR was used to evaluate HDAC3-induced damage.

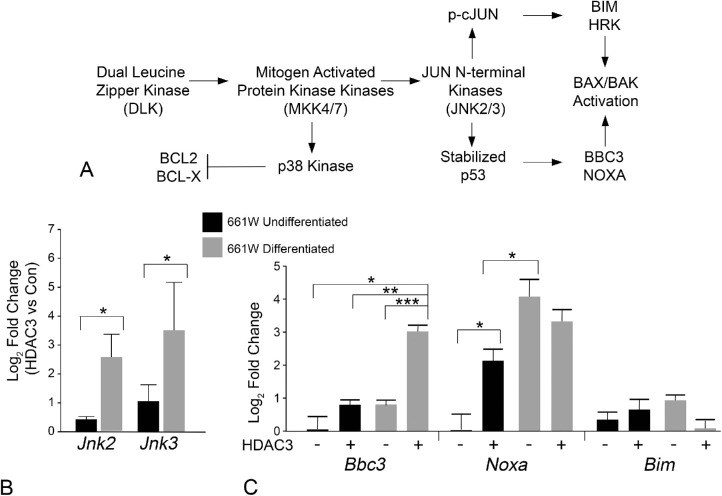
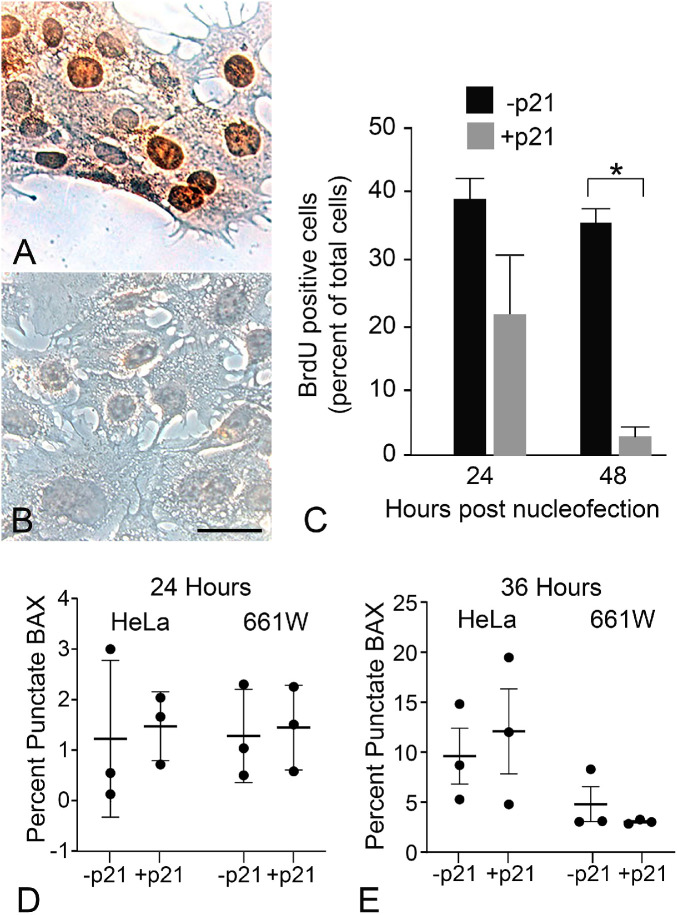
Results: Induced expression of exogenous HDAC3 in RGCs by viral-mediated gene transfer resulted in modest levels of cell death but significantly increased the sensitivity of these neurons to axonal damage. Undifferentiated 661W retinal precursor cells were resilient to induced HDAC3 expression, but after differentiation, HDAC3 induced GFP-BAX recruitment to the mitochondria and BAX/BAK dependent activation of caspase 3. This was accompanied by an increase in accumulation of transcripts for the JNK2/3 kinases and the p53-regulated BH3-only gene Bbc3/Puma. Cell cycle arrest of undifferentiated 661W cells did not increase their sensitivity to HDAC3 expression.

Conclusions: Collectively, these results indicate that HDAC3-induced toxicity to neurons is mediated by the intrinsic apoptotic pathway.


Conflict of interest statement

Disclosure: H.M. Schmitt, None; R.L. Fehrman, None; M.E. Maes, None; H. Yang, None; L.-W. Guo, None; C.L. Schlamp, None; H.R. Pelzel, None; R.W. Nickells, None

Figures

Figure 1.
Figure 1.
Induced expression of HDAC3-mCherry in retinal ganglion cells fails to stimulate widespread histone deacetylation and heterochromatin formation. Mouse retinas were transduced with AAV2/2-Pgk-HDAC3-mCherry and harvested at times between three to 12 weeks for analysis. (A) A retinal whole mount 12 weeks after transduction and immunostained for mCherry (red) showing widespread expression of the fusion protein in the visible ganglion cell layer. Scale bar: 800 µm. (B) Detail of a retinal whole mount, 12 weeks after transduction, co-immunostained for mCherry and the RGC marker BRN3A (green). In this field, there are seven HDAC3-mCherry expressing cells that do not colocalize with BRN3A (arrows), whereas the majority of cells are positive for both proteins. The lack of BRN3A expression in these cells indicates the possibility of AAV2-mediated transduction of some non-RGCs, or could represent the approximately 15% of RGCs that do not express this protein., Scale bar: 60 µm. (C) Whole mounted contralateral retina and (D) a retina transduced with AAV2/2-Pgk-HDAC3-mCherry, five weeks after transduction, immunostained for pan-acetyl histone H4 (green). Although both retinas exhibit nuclei with varying levels of fluorescent staining, the transduced retina displays several cells with dramatically reduced staining (arrows in D). Scale bar: 25 µm. (E) A box and whisker plot of fluorescent staining for acetylated histone H4 (1–99 percentiles graphed). The mean staining intensity (defined as arbitrary units per region of interest, which was set to a fixed circle 7 µm in diameter) in the transduced retinas is ∼22% lower than the contralateral retinas (n = 1524 cells, contralateral; n = 2055 cells, HDAC3-transduced; three retinas each condition) (*P < 0.0001). (F–H) Confocal image of a retinal whole mount 12 weeks after transduction, immunostained for mCherry and counterstained with DAPI. RGC nuclei often appear oval or round and display at least one prominent nucleolus. This morphology is evident in a majority of cells expressing HDAC3-mCherry (examples highlighted by arrows). A substantial minority of cells, however, appear to have a marked increase in euchromatin and reduced or absent nucleoli (asterisks). Scale bar: 10 µm.
Figure 2.
Figure 2.
Induced expression of HDAC3-mCherry induces a moderate loss of cells in the ganglion cell layer. Scatter plot of neuron density in the ganglion cell layer of transduced retinas, depicted as a function of the density of contralateral retinas that were not transduced. Each data point represents a single mouse. The control AAV2 was expressing Pgk-driven Cre. Differences in cell density over this time course were assessed using a linear regression model analysis. At four weeks after transduction, there was no change increase in cell density in eyes injected with either virus (n.s., not significant, P = 0.433). At five weeks and later, HDAC3-mCherry transduced retinas exhibit a marked decrease in density compared to transduced retinas at four weeks (*P = 0.018), but there was no significant difference among retinas transduced with HDAC3-mCherry between five, eight, and 12 weeks (P = 0.588). At these later time points, however, HDAC3-mCherry retinas exhibited significantly different levels of cell density relative to control virus (***P = 0.0002).
Figure 3.
Figure 3.
Induced expression of HDAC3-mCherry sensitizes retinal ganglion cells to optic nerve damage. To validate that transduced cells were executing the intrinsic apoptotic pathway, retinas were co-transduced with AAV2/2-Pgk-GFP-BAX and either AAV2/2-Pgk-Cre (control virus) or AAV2/2-Pgk-HDAC3-mCherry. At four weeks after transduction eyes were subjected to crush surgery and assessed five days later. (A–C) Detail of co-transduced cells in the ganglion cell layer after crush. Two co-transduced cells exhibit punctate localization of GFP-BAX (arrows) indicating recruitment of BAX to the mitochondria. A third co-transduced cell exhibits cytosolic localization of GFP-BAX (asterisk). Scale bar: 15 µm. (D) Scatter plot showing percentage of transduced cells exhibiting punctate GFP-BAX five days after optic nerve crush (ONC). Retinas transduced with either virus exhibited a significant increase in punctate BAX cells after crush compared to contralateral retinas (**P < 0.001), but HDAC3-mCherry co-transduced cells showed significantly greater percentages of punctate BAX than cells co-transduced with the control virus (*P = 0.0034). Each point represents a single microscopic field (minimum of four fields/mouse from three separate mice). To further confirm that transduced cells were dying, retinas were transduced with AAV2/2-Pgk-Cre (control virus) or AAV2/2-Pgk-HDAC3-mCherry. At six weeks after transduction, eyes were subjected to optic nerve crush surgery and assessed five days later. Images of whole mounts labeled for caspase-3 (red) and DAPI (blue) (TUBB3 staining not shown) indicate more visible caspase-3–labeled cells in the HDAC3 overexpressing retina (E, F). Scale bar: 60 µm. Cell count data indicate a significantly higher number of TUBB3 positive/caspase-3 positive cells in HDAC3-mCherry transduced retinas than control retinas (**P = 0.0061). Each point represents a single retina.
Figure 4.
Figure 4.
Differentiated 661W cells are selectively sensitive to HDAC3-induced BAX recruitment and caspase 3 activation. The activation of the BAX proapoptotic protein is a hallmark of the mitochondrial-dependent apoptotic pathway and is often considered the irreversible step in the death process. The recruitment of BAX was visualized in cells expressing a GFP-BAX fusion protein. (A–C) A 661W cell, differentiated with 316 nM STS, transfected with plasmids expressing GFP-BAX and mito-BFP to label mitochondria. In cells lacking induced HDAC3 expression, GFP-BAX occupies a cytosolic distribution indicative of inactive latent protein. (D–F) A differentiated cell transfected with GFP-BAX, mito-BFP, and a plasmid expressing HDAC3-FLAG. Induced HDAC3 expression induces recruitment of GFP-BAX to the mitochondria, which is evident by the punctate labeled aggregates of GFP-BAX colocalized with the mito-BFP, starting between 11 to 14 hours after transfection. Scale bar: 5 µm. (G–N) 661W cells nucleofected with HDAC3-mCherry and GFP-BAX before incubation without or with STS to induce differentiation. Undifferentiated cells retain diffuse localization of both fusion proteins (G–J), whereas differentiated cells exhibit some concentration of HDAC3-mCherry in the nucleus and punctate/aggregations of GFP-BAX (K–N). DAPI counterstain. Scale bar: 5 µm. (O) Quantification of cells with GFP-BAX localization at different time points after STS addition. Differentiated cells show significant punctate GFP-BAX localization after 24 hours (*P ≤ 0.032, relative to the other groups at 24 hours).
Figure 5.
Figure 5.
Characterization of 661W cells after CRISPR/Cas9 editing of the Bax gene. The Bax gene was edited using lentiCRISPRv2 transfected into undifferentiated 661W cells. Plasmid expression was maintained by growing the cells in puromycin, which was subsequently added to the media for all experiments using these cells. Additionally, WT cells were transfected with the lentiCRISPRv2 plasmid, but without a guide RNA. (A) LICOR-generated image of a representative western blot showing endogenous BAX and ACTIN levels in WT and 3 lines edited with different gRNAs against the first exon of the Bax gene. (B) Quantification of three independent Western blots showing BAX protein levels normalized to the ACTIN reference. All three lines showed significant depletion of BAX (P < 0.0001). Sg1 cells were used for further experiments. (C–J) WT and edited Sg1 cells show typical features of differentiation including the extension of neurite-like processes and staining for βIII-tubulin (green—see also Supplemental Fig. S3). Panels show different times after addition of 316 nM STS to induce differentiation. Scale bar: 10 µm. DAPI counterstain. (K–N) Differentiation causes cell cycle arrest in both WT and Sg1 cells. Undifferentiated cells exhibit incorporation of BrdU (brown immunoreaction product) (Scale bar: 15 µm), which is reduced to negligible levels by 24 hours in culture with STS (O). (*P < 0.001).
Figure 6.
Figure 6.
Differentiated Bax-edited 661W cells (Sg1) show reduced apoptotic death in response to induced HDAC3 expression. Wild type (WT) and Sg1 cells were nucleofected with HDAC3-mCherry and then differentiated with 316 nM staurosporine or left undifferentiated. After 24 hours, cells were fixed and immunostained for activated caspase 3. (A–D) Undifferentiated cells show diffuse HDAC3-mCherry and no active caspase 3, but differentiated cells expressing the HDAC3 plasmid are positive for this active protease and exhibit concentration of HDAC3-mCherry in the nucleus (E–H). (I–L) Undifferentiated Sg1 cells also exhibit diffuse HDAC3-mCherry distribution. (M–P) Some differentiated Sg1 cells showed a concentration of HDAC3-mCherry to the nucleus and perinuclear region of the cell and activation of caspase 3. Scale bar: 10 µm. (Q) Quantification of HDAC3-mCherry expressing cells that were positive for activated caspase 3. Differentiated WT and Sg1 both exhibited higher levels of activated caspase 3 relative to undifferentiated cells (*P < 1.0E-07), but Sg1 cells exhibited a reduction of 52% of nucleofected cells showing activation of caspase 3 at this time point (**P = 0.0006).
Figure 7.
Figure 7.
Characterization of BAK expression and knock-down in WT and Sg1 661W cells. (A) Nested PCR yields a 200 bp product for transcripts from the full length Bak splice variant (FL-Bak), which is present in the liver, brain, and both wild-type (WT) and Sg1 661W cells. The brain sample also shows the neuronal Bak (N-Bak) splice variant containing a weak 20 bp exon. N-Bak is not detected in 661W cells. Extraneous lanes were removed for presentation of this figure. (B) Western blot showing full length BAK in spleen and both undifferentiated (Un) and differentiated (D) 661W cells. Full length BAK is virtually undetectable in normal mouse retina. (C) Western blot showing levels of BAK protein in differentiated WT and Sg1 661W cells treated with a scrambled siRNA or an siRNA directed against Bak. Extraneous lanes were removed for presentation of this figure. (D) Bak siRNA results in depletion of BAK protein. Mean (± SD) of 4 independent western blots shown. (*P ≤ 0.033). (E) Graph showing the level of caspase 3 activation in cells expressing HDAC3-FLAG. All data were collected 24 hours after induction of differentiation. WT cells show a significant increase in activated caspase 3 staining after differentiation, which is not affected by scrambled siRNA. Nucleofection with Bak siRNA; however, results in a significant reduction in cells with activated caspase 3. Sg1 cells also show a significant increase in activated caspase 3 staining after differentiation, but this increase is reduced relative to WT cells (no siRNA treatment, P < 0.0001, not indicated on graph) consistent with the results in Figure 6. Nucleofection of scrambled siRNA does not affect caspase 3 activation in 661W cells, but Bak siRNA induces a further reduction in caspase 3 activation over Sg1 cells alone, and over WT cells nucleofected with the Bak siRNA. Values shown are the mean ± (SEM) of three independent experiments. At least 120 cells were scored for each treatment group in each experiment. (*P = 0.0052; **P ≤ 0.0005; ***P < 0.0001).
Figure 8.
Figure 8.
Increased transcript abundance of Jnk2, Jnk3, and Bbc3(Puma) by induced HDAC3 expression in differentiated 661W cells. (A) Schematic of the dual leucine zipper kinase–JNK activation pathway. Previous studies indicate that this pathway is prevalent in damaged neurons including retinal ganglion cells after optic nerve damage. The result of JNK activation is the phosphorylation and activation of two regulatory transcription factors., Activation of cJUN leads to the expression of the BH3-only proteins BIM and HRK, whereas p53 directs the transcription of the BH3-only proteins BBC3 and NOXA. BH3-only proteins, in turn, lead to the activation of BAX. (B) Real time qPCR analysis of transcript abundance of Jnk2 and Jnk3. The data shown represents the fold change in abundance of either undifferentiated, or differentiated, 661W cells expressing HDAC3-mCherry for 24 hours, relative to cells expressing mCherry only (*P < 0.02). (C) Real time qPCR of three BH3-only gene products representative of p53-directed (Bbc3 and Noxa) or JUN-directed (Bim) transcription. Induced HDAC3-mCherry expression in undifferentiated cells induces a significant increase in Noxa expression. Differentiation of 661W cells also induces significant expression of this BH3-only gene that is not increased further by HDAC3-mCherry. Conversely, HDAC3-mCherry expression in differentiated 661W cells induces a significant increase in Bbc3 transcript abundance. (*P ≤ 0.016; **P = 0.002; ***P = 3.28E-05). The mean (± SD) of three independent experiments is shown for all qPCR experiments.
Figure 9.
Figure 9.
Cell cycle arrest mediated by p21WAF-1/Cip-1 does not sensitize undifferentiated cells to induced HDAC3 expression. Immunohistochemical labeling showing BrdU incorporation into (A) undifferentiated 661W cells or (B) undifferentiated cells 36 hours after exogenous expression of p21WAF-1/Cip-1. Scale bar: 10 µm. (C) Quantification of BrdU-positive staining cells showing reduced incorporation after 24 hours, and significantly reduced incorporation after 48 hours (*P = 1.10E-07). (D, E) Quantification of GFP-BAX recruitment in cell cycle-arrested undifferentiated 661W cells with or without induced HDAC3 expression. In this experiment, p21WAF-1/Cip-1 -arrested HeLa cells were used as a non-neuronal cell line for comparison. (D) At 24 hours, and (E) 36 hours, induced HDAC3 expression in both p21WAF-1/Cip-1 nucleofected HeLa and 661W cells failed to induce any increase in GFP-BAX recruitment relative to normal dividing cells. The time points represent the time from nucleofection with plasmids for GFP-BAX, HDAC3-mCherry, and a p21WAF-1/Cip-1 expressing plasmid. Data from three independent experiments are plotted.

References

    1. McIntyre RL, Daniels EG, Molenaars M, Houtkooper RH, Janssens GE.. From molecular promise to preclinical results: HDAC inhibitors in the race for healthy aging drugs. EMBO Mol Med. 2019; 11: e9854. - PMC - PubMed
    1. Thomas EA, D'Mello SR. Complex neuroprotective and neurotoxic effects of histone deacetylases. J Neurochem. 2018; 145: 96–110. - PMC - PubMed
    1. Yang X, Wu Q, Zhang L, Feng L.. Inhibition of histone deacetylase 3 (HDAC3) mediates ischemic preconditioning and protects cortical neurons against ischemia in rats. Front Mol Neurosci. 2016; 9: 131. - PMC - PubMed
    1. Zhao H, Li G, Zhang S, et al. .. Inhibition of histone deacetylase 3 by MiR-494 alleviates neuronal loss and improves neurological recovery in experimental stroke. J Cereb Blood Flow Met. 2019; 39: 2392–2405. - PMC - PubMed
    1. Xu C, Soragni E, Chou CJ, et al. .. Chemical probes identify a role for histone deacetylase 3 in Friedreich's ataxia gene silencing. Chem Biol. 2009; 16: 980–989. - PMC - PubMed

Publication types