

Burden of disease among the world's poorest billion people: An expert-informed secondary analysis of Global Burden of Disease estimates
- PMID: 34398896
- PMCID: PMC8366975
- DOI: 10.1371/journal.pone.0253073
Burden of disease among the world's poorest billion people: An expert-informed secondary analysis of Global Burden of Disease estimates
Abstract
Background: The health of populations living in extreme poverty has been a long-standing focus of global development efforts, and continues to be a priority during the Sustainable Development Goal era. However, there has not been a systematic attempt to quantify the magnitude and causes of the burden in this specific population for almost two decades. We estimated disease rates by cause for the world's poorest billion and compared these rates to those in high-income populations.
Methods: We defined the population in extreme poverty using a multidimensional poverty index. We used national-level disease burden estimates from the 2017 Global Burden of Disease Study and adjusted these to account for within-country variation in rates. To adjust for within-country variation, we looked to the relationship between rates of extreme poverty and disease rates across countries. In our main modeling approach, we used these relationships when there was consistency with expert opinion from a survey we conducted of disease experts regarding the associations between household poverty and the incidence and fatality of conditions. Otherwise, no within-country variation was assumed. We compared results across multiple approaches for estimating the burden in the poorest billion, including aggregating national-level burden from the countries with the highest poverty rates. We examined the composition of the estimated disease burden among the poorest billion and made comparisons with estimates for high-income countries.
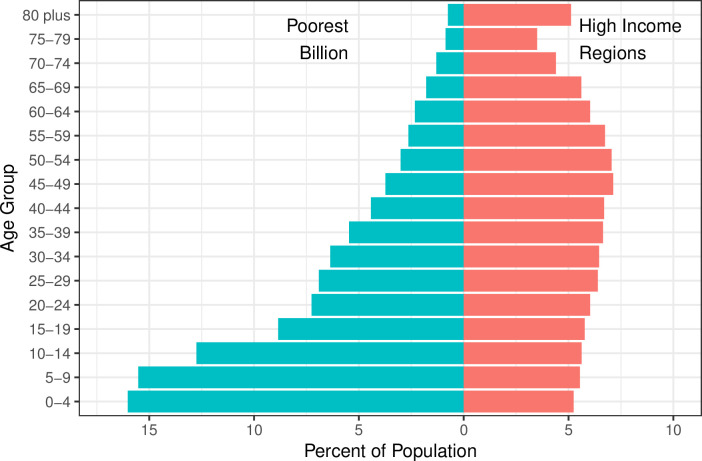
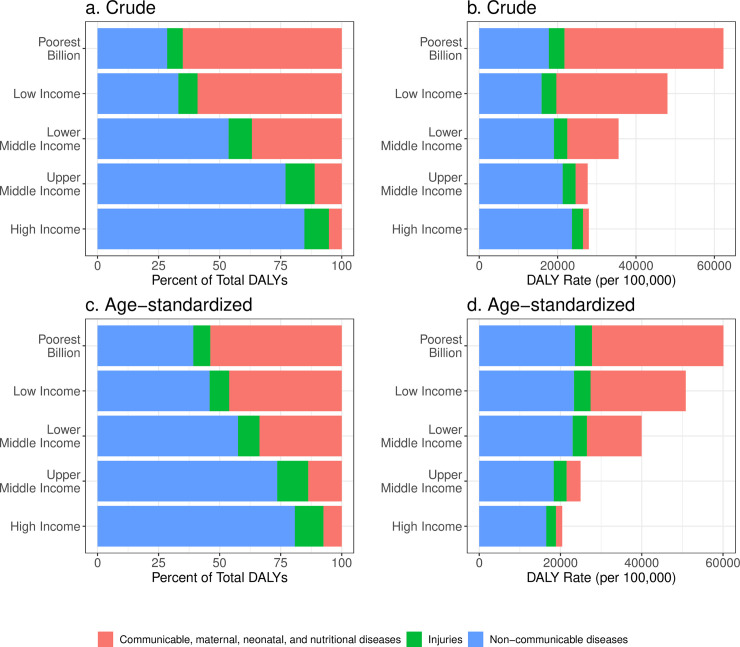
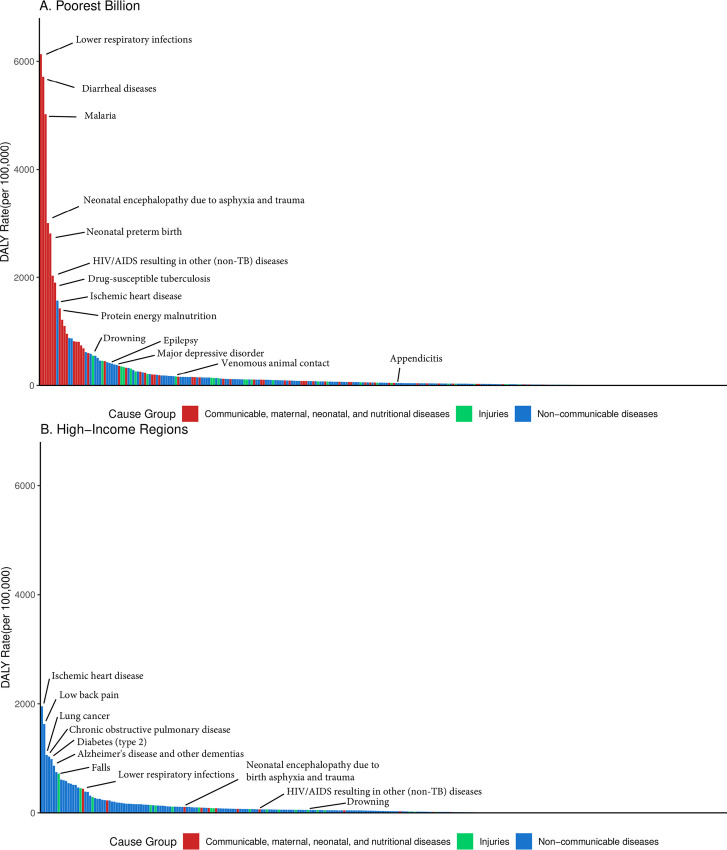
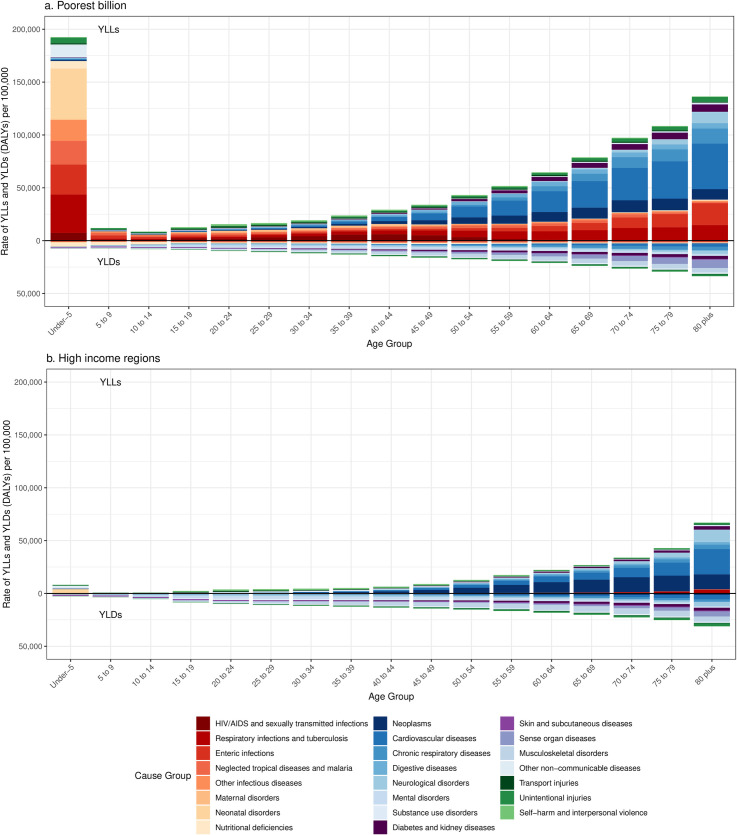
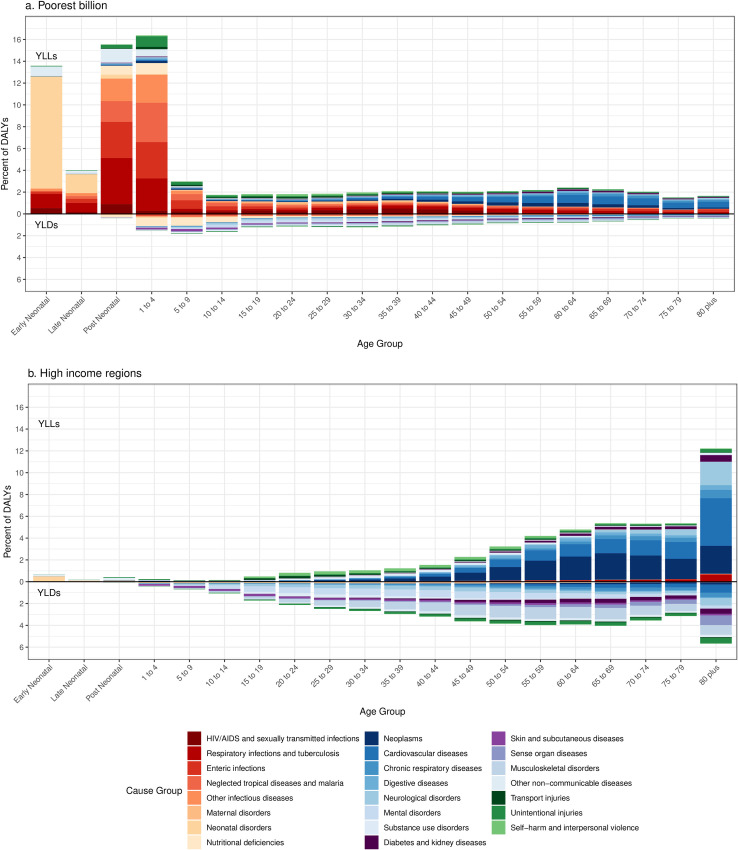
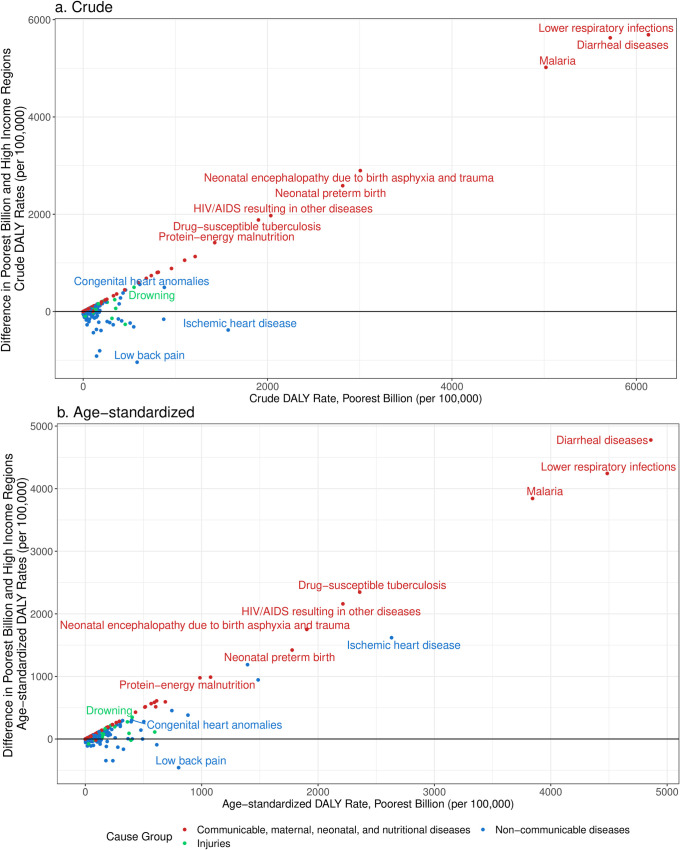
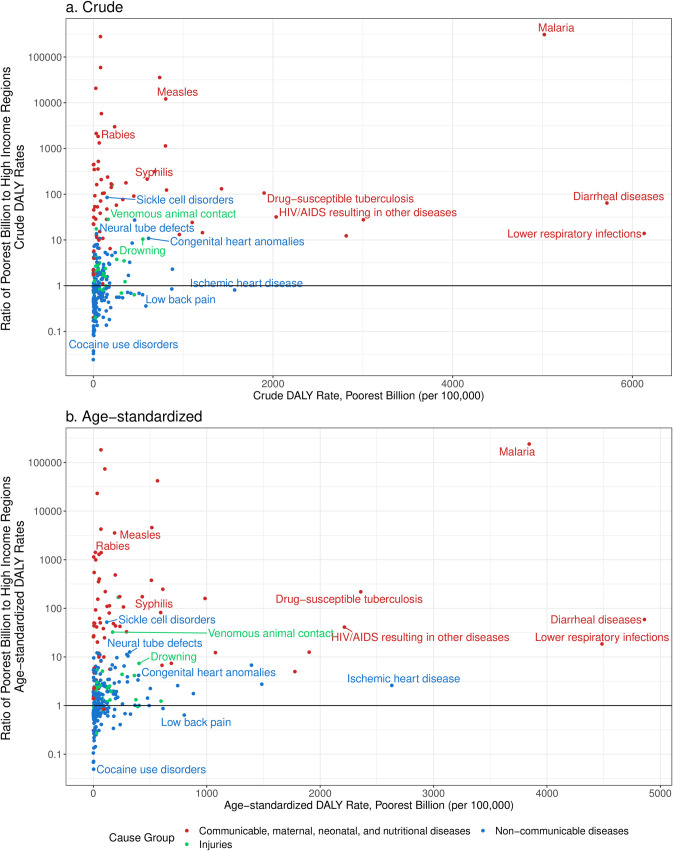
Results: The composition of disease burden among the poorest billion, as measured by disability-adjusted life years (DALYs), was 65% communicable, maternal, neonatal, and nutritional (CMNN) diseases, 29% non-communicable diseases (NCDs), and 6% injuries. Age-standardized DALY rates from NCDs were 44% higher in the poorest billion (23,583 DALYs per 100,000) compared to high-income regions (16,344 DALYs per 100,000). Age-standardized DALY rates were 2,147% higher for CMNN conditions (32,334 DALYs per 100,000) and 86% higher for injuries (4,182 DALYs per 100,000) in the poorest billion, compared to high-income regions.
Conclusion: The disease burden among the poorest people globally compared to that in high income countries is highly influenced by demographics as well as large disparities in burden from many conditions. The comparisons show that the largest disparities remain in communicable, maternal, neonatal, and nutritional diseases, though NCDs and injuries are an important part of the "unfinished agenda" of poor health among those living in extreme poverty.
Conflict of interest statement
The authors have declared no competing interests.
Figures
References
-
- Kyu HH, Abate D, Abate KH, Abay SM, Abbafati C, Abbasi N, et al.. Global, regional, and national disability-adjusted life-years (DALYs) for 359 diseases and injuries and healthy life expectancy (HALE) for 195 countries and territories, 1990–2017: a systematic analysis for the Global Burden of Disease Study 2017. The Lancet. 2018;392: 1859–1922. doi: 10.1016/S0140-6736(18)32335-3 - DOI - PMC - PubMed
-
- Cutler D, Deaton A, Lleras-Muney A. The Determinants of Mortality. J Econ Perspect. 2006;20: 97–120. doi: 10.1257/jep.20.3.97 - DOI
-
- Solar O, Irwin A. A conceptual framework for action on the social determinants of health. Social Determinants of Health Discussion Paper 2 (Policy and Practice). Geneva: World Health Organization; 2010. Available: https://apps.who.int/iris/bitstream/handle/10665/44489/9789241500852_eng...
Publication types
MeSH terms
LinkOut - more resources
Full Text Sources
Medical
