

Severe Acute Respiratory Syndrome Coronavirus 2 Transmission in Georgia, USA, February 1-July 13, 2020
- PMID: 34399085
- PMCID: PMC8462336
- DOI: 10.3201/eid2710.210061
Severe Acute Respiratory Syndrome Coronavirus 2 Transmission in Georgia, USA, February 1-July 13, 2020
Abstract
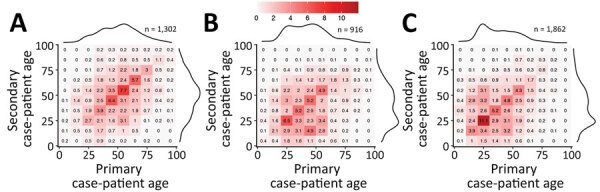
The serial interval and effective reproduction number for coronavirus disease (COVID-19) are heterogenous, varying by demographic characteristics, region, and period. During February 1-July 13, 2020, we identified 4,080 transmission pairs in Georgia, USA, by using contact tracing information from COVID-19 cases reported to the Georgia Department of Public Health. We examined how various transmission characteristics were affected by symptoms, demographics, and period (during shelter-in-place and after subsequent reopening) and estimated the time course of reproduction numbers for all 159 Georgia counties. Transmission varied by time and place but also by persons' sex and race. The mean serial interval decreased from 5.97 days in February-April to 4.40 days in June-July. Younger adults (20-50 years of age) were involved in most transmission events occurring during or after reopening. The shelter-in-place period was not long enough to prevent sustained virus transmission in densely populated urban areas connected by major transportation links.
Keywords: 2019 novel coronavirus disease; COVID-19; Georgia; SARS-CoV-2; United States; coronavirus disease; reproduction number; respiratory infections; serial interval; severe acute respiratory syndrome coronavirus 2; shelter-in-place; transmission; viruses; zoonoses.
Figures


Similar articles
-
Characterizing superspreading events and age-specific infectiousness of SARS-CoV-2 transmission in Georgia, USA.Proc Natl Acad Sci U S A. 2020 Sep 8;117(36):22430-22435. doi: 10.1073/pnas.2011802117. Epub 2020 Aug 20. Proc Natl Acad Sci U S A. 2020. PMID: 32820074 Free PMC article.
-
Time-varying Reproduction Numbers of COVID-19 in Georgia, USA, March 2, 2020 to November 20, 2020.Perm J. 2021 May;25:20.232. doi: 10.7812/TPP/20.232. Perm J. 2021. PMID: 33970085 Free PMC article.
-
SARS-CoV-2 Serial Interval Variation, Montana, USA, March 1-July 31, 2020.Emerg Infect Dis. 2021 May;27(5):1486-1491. doi: 10.3201/eid2705.204663. Emerg Infect Dis. 2021. PMID: 33900189 Free PMC article.
-
Childcare Exposure to Severe Acute Respiratory Syndrome Coronavirus 2 for 4-Year-Old Presymptomatic Child, South Korea.Emerg Infect Dis. 2021 Feb;27(2):341-347. doi: 10.3201/eid2702.203189. Epub 2020 Nov 30. Emerg Infect Dis. 2021. PMID: 33252327 Free PMC article. Review.
-
Human and novel coronavirus infections in children: a review.Paediatr Int Child Health. 2021 Feb;41(1):36-55. doi: 10.1080/20469047.2020.1781356. Epub 2020 Jun 25. Paediatr Int Child Health. 2021. PMID: 32584199 Review.
Cited by
-
When case reporting becomes untenable: Can sewer networks tell us where COVID-19 transmission occurs?Water Res. 2023 Feb 1;229:119516. doi: 10.1016/j.watres.2022.119516. Epub 2022 Dec 20. Water Res. 2023. PMID: 37379453 Free PMC article.
-
Assessing changes in incubation period, serial interval, and generation time of SARS-CoV-2 variants of concern: a systematic review and meta-analysis.BMC Med. 2023 Sep 29;21(1):374. doi: 10.1186/s12916-023-03070-8. BMC Med. 2023. PMID: 37775772 Free PMC article.
-
Missing science: A scoping study of COVID-19 epidemiological data in the United States.PLoS One. 2022 Oct 12;17(10):e0248793. doi: 10.1371/journal.pone.0248793. eCollection 2022. PLoS One. 2022. PMID: 36223335 Free PMC article.
References
-
- Georgia Department of Public Health. Georgia Department of Public Health daily status report, 2021. [cited 2021 Jul 9]. https://dph.georgia.gov/covid-19-daily-status-report
-
- Rubin D, Huang J, Fisher BT, Gasparrini A, Tam V, Song L, et al. Association of social distancing, population density, and temperature with the instantaneous reproduction number of SARS-CoV-2 in counties across the United States. JAMA Netw Open. 2020;3:e2016099. 10.1001/jamanetworkopen.2020.16099 - DOI - PMC - PubMed
Publication types
MeSH terms
LinkOut - more resources
Full Text Sources
Medical
Miscellaneous
