. 2021 Aug 31;12(4):e0163821.
doi: 10.1128/mBio.01638-21. Epub 2021 Aug 17.

Hidden Viral Sequences in Public Sequencing Data and Warning for Future Emerging Diseases

Affiliations

Hidden Viral Sequences in Public Sequencing Data and Warning for Future Emerging Diseases

Junna Kawasaki et al. mBio. .

Abstract

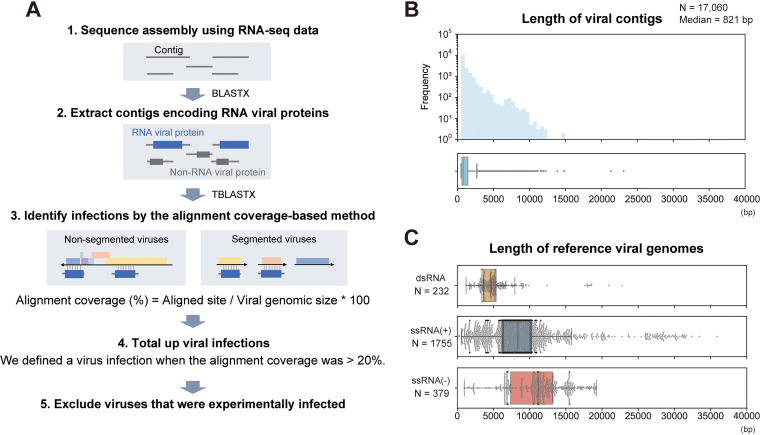
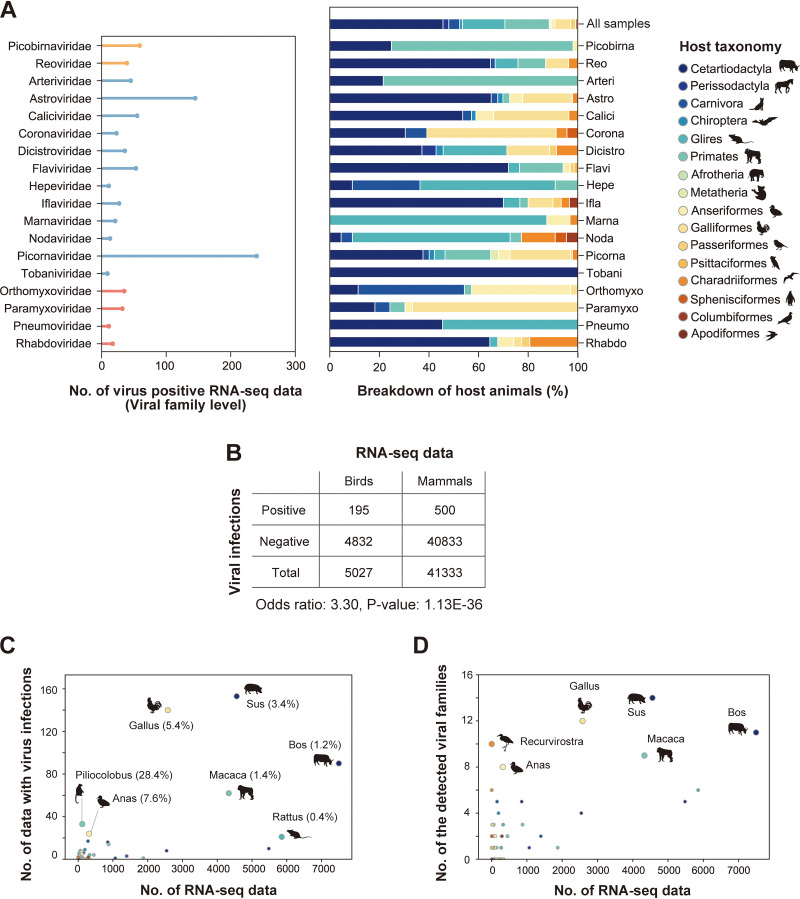
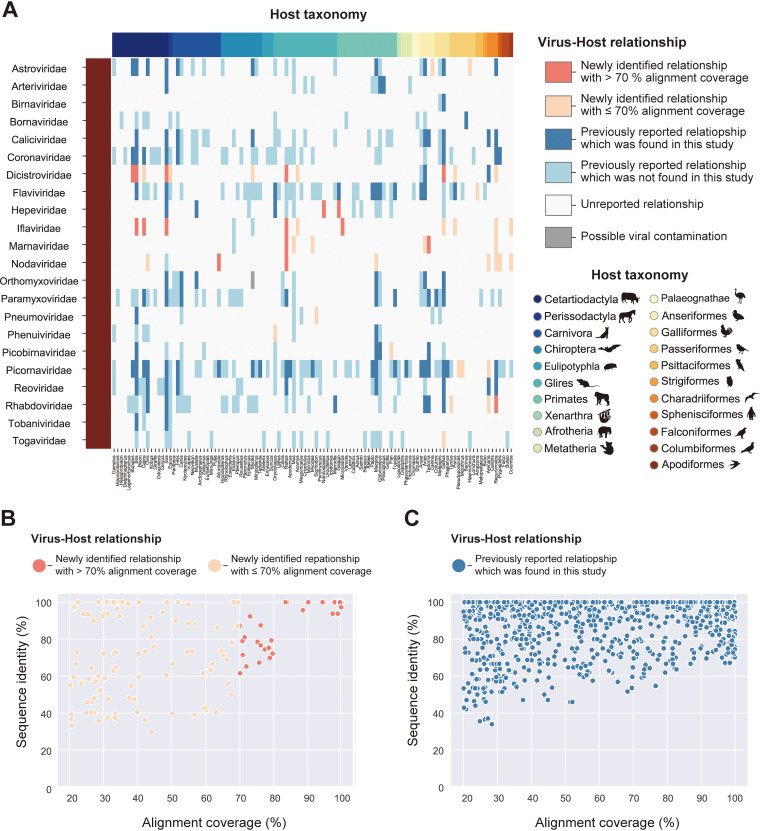
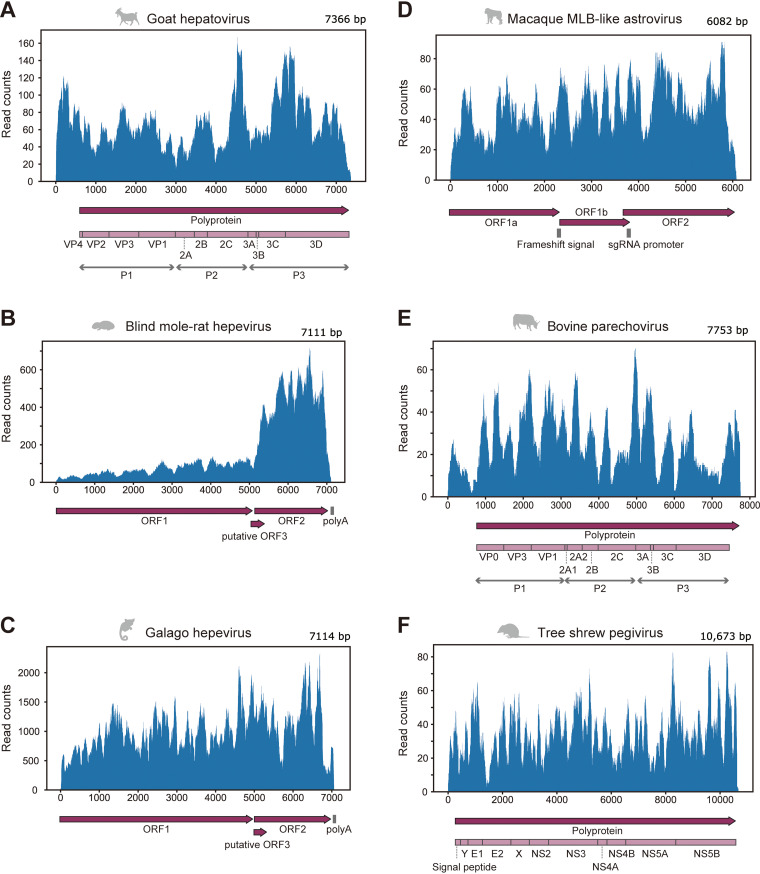
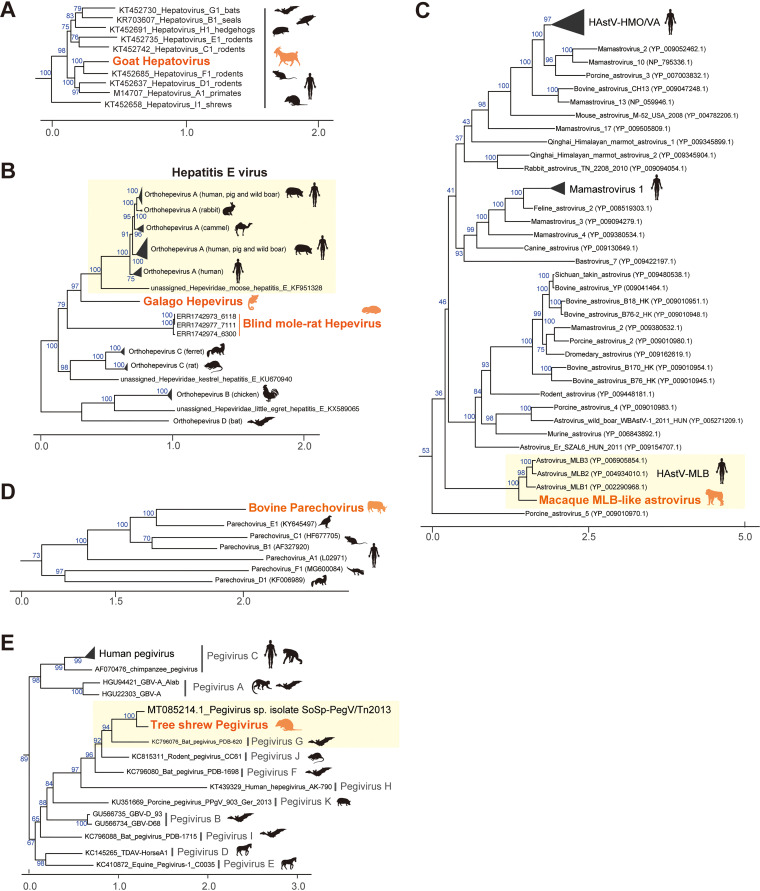
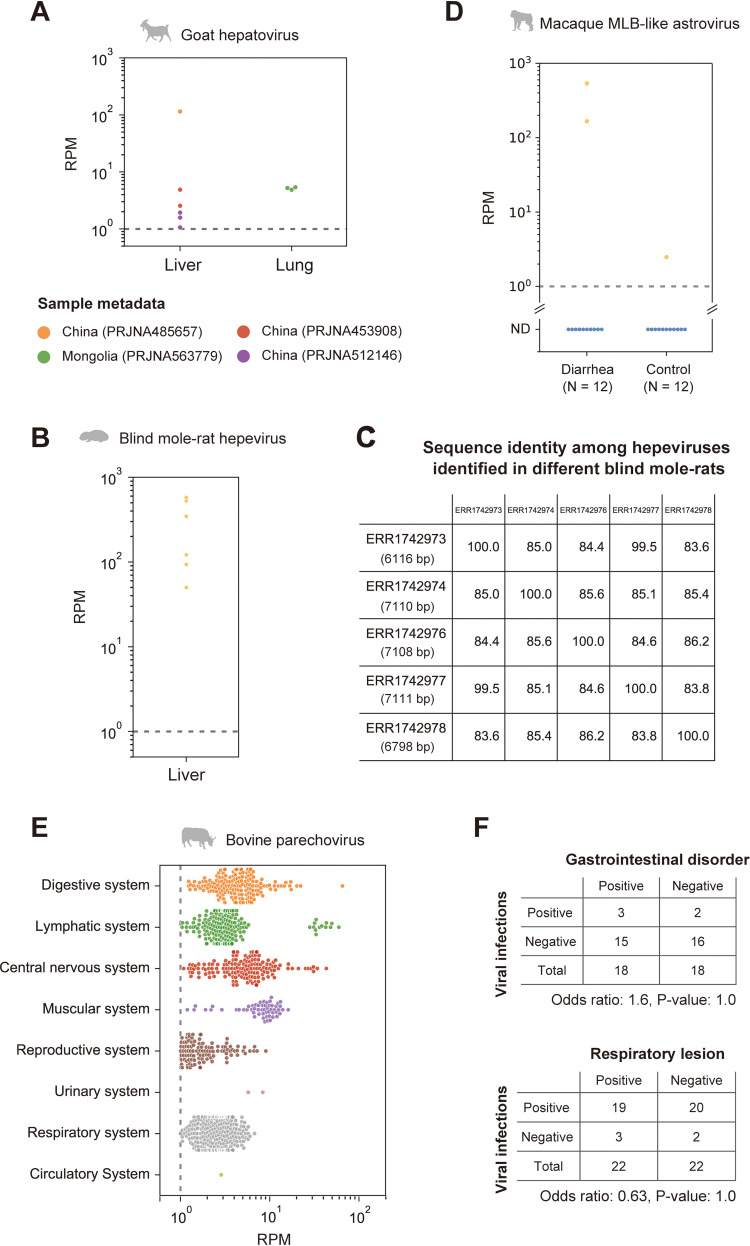
RNA viruses cause numerous emerging diseases, mostly due to transmission from mammalian and avian reservoirs. Large-scale surveillance of RNA viral infections in these animals is a fundamental step for controlling viral infectious diseases. Metagenomic analysis is a powerful method for virus identification with low bias and has contributed substantially to the discovery of novel viruses. Deep-sequencing data have been collected from diverse animals and accumulated in public databases, which can be valuable resources for identifying unknown viral sequences. Here, we screened for infections of 33 RNA viral families in publicly available mammalian and avian sequencing data and found approximately 900 hidden viral infections. We also discovered six nearly complete viral genomes in livestock, wild, and experimental animals: hepatovirus in a goat, hepeviruses in blind mole-rats and a galago, astrovirus in macaque monkeys, parechovirus in a cow, and pegivirus in tree shrews. Some of these viruses were phylogenetically close to human-pathogenic viruses, suggesting the potential risk of causing disease in humans upon infection. Furthermore, infections of five novel viruses were identified in several different individuals, indicating that their infections may have already spread in the natural host population. Our findings demonstrate the reusability of public sequencing data for surveying viral infections and identifying novel viral sequences, presenting a warning about a new threat of viral infectious disease to public health. IMPORTANCE Monitoring the spread of viral infections and identifying novel viruses capable of infecting humans through animal reservoirs are necessary to control emerging viral diseases. Massive amounts of sequencing data collected from various animals are publicly available, and these data may contain sequences originating from a wide variety of viruses. Here, we analyzed more than 46,000 public sequencing data and identified approximately 900 hidden RNA viral infections in mammalian and avian samples. Some viruses discovered in this study were genetically similar to pathogens that cause hepatitis, diarrhea, or encephalitis in humans, suggesting the presence of new threats to public health. Our study demonstrates the effectiveness of reusing public sequencing data to identify known and unknown viral infections, indicating that future continuous monitoring of public sequencing data by metagenomic analyses would help prepare and mitigate future viral pandemics.

Keywords: RNA virus; bioinformatics; molecular epidemiology; public health; virus diversity; zoonosis.


Figures

FIG 1
FIG 1
Strategy for detecting viral infections in public RNA-seq data. (A) Schematic diagram of the procedure for detecting viral infections. First, we performed de novo sequence assembly using publicly available mammalian and avian RNA-seq data. Second, we extracted contigs encoding RNA viral proteins by BLASTX. Third, we constructed sequence alignments by TBLASTX using the viral contigs in each RNA-seq data and reference viral genomes because most viral contigs were shorter than complete viral genomes, as shown in panels B and C. The alignment coverage is defined as the proportion of aligned sites in the entire reference viral genome. Fourth, we determined a viral infection when the alignment coverage was >20%. Finally, we totaled the infections at the virus family level after excluding experimentally infected viruses (see Materials and Methods). (B) Distributions of viral contig length: histogram (upper panel) and box plot (lower panel). The x axis indicates the viral contig length. Among 17,060 viral contigs, the median length was 821 bp. (C) Length of reference viral genomes. Each panel corresponds to the Baltimore classification: the upper, middle, and lower panels show double-stranded RNA (dsRNA) viruses, positive-sense single-stranded RNA [ssRNA(+)] viruses, and negative-sense single-stranded RNA [ssRNA(−)] viruses, respectively. The x axis indicates the viral genome size. These viral genomes were obtained from the RefSeq genomic viral database. The genomic size of segmented viruses is the sum length of all segments in a virus species.
FIG 2
FIG 2
RNA viral infections in the public sequencing data. (A) RNA viral infections detected in public sequencing data. Left panel, the x axis indicates the number of virus-positive RNA-seq data, and the y axis indicates viral families. Although infections by 22 RNA viral families were identified in this study, 18 families that were detected in more than five RNA-seq data are shown here. Bar colors correspond to the Baltimore classification: orange, dsRNA viruses; blue, ssRNA(+) viruses; red, ssRNA(−) viruses. Right panel, breakdown by host animals in which viral family infections were detected. The filled colors correspond to the host taxonomy shown in the key. The top row indicates the animal-wide breakdown of all RNA-seq data used in this study. (B) Comparison of viral detection rates between avian and mammalian samples. The table shows the numbers of RNA-seq data with and without viral infections. The odds ratio and P value were obtained by Fisher’s exact test. (C) Scatterplot between the numbers of RNA-seq data investigated in this study (x axis) and those with viral infections (y axis). Each dot indicates the animal genus. Dot colors correspond to the host taxonomy shown in panel A. The animal genera in which viral infections were detected in ≥20 samples are annotated with the representative animal species silhouettes. The percentages in parentheses indicate the ratios of virus-positive RNA-seq data to the investigated data. (D) Scatterplot between the number of RNA-seq data investigated in this study (x axis) and those of detected viral families (y axis). Each dot indicates the animal genus. Dot colors correspond to the host taxonomy shown in panel A. The animal genera in which eight or more viral families were detected are annotated with the representative animal species silhouettes.
FIG 3
FIG 3
Search for unknown reservoir hosts and novel virus sequences. (A) Heatmap showing the newness of virus-host relationships. Rows indicate viral families that reportedly infect vertebrate hosts. Columns indicate animal genera, and filled colors correspond to the host taxonomy shown in the lower right corner. Heatmap colors are according to six categories of virus-host relationships shown in the upper right corner: a relationship was newly identified in this study and a viral infection was detected with  >70% alignment coverage (coral), a relationship was newly identified in this study but the viral infection was detected with  ≤70% alignment coverage (salmon), a relationship was previously reported and the viral infection was also detected in this study (blue), a relationship was previously reported but the viral infection was not detected in this study (light blue), a relationship was unreported so far (white), and a relationship was newly identified in this study but it may be attributed to contamination (gray) (see Discussion). (B and C) Scatterplot between alignment coverages (x axis) and sequence identities with known viruses (y axis). Each dot represents the viral infections identified in this study. Viral infections related to novel virus-host relationships are shown in panel B, and those related to known relationships are shown in panel C. The dot colors correspond to the virus-host relationships shown in panel A. Sequence identity represents the maximum value of the percentage of identical matches obtained by TBLASTX.
FIG 4
FIG 4
Mapping analysis using RNA-seq data in which the full-length viral genome was identified. (A to F) Read distributions were mapped to the genomic sequence of goat hepatovirus (A), blind mole-rat hepevirus (B), galago hepevirus (C), macaque MLB-like astrovirus (D), bovine parechovirus (E), and tree shrew pegivirus (F). The upper panel shows the virus genomic positions (x axis) and read counts at each position (y axis). The lower panel shows genomic annotations, such as protein-coding regions or signal sequences. Dark purple arrows indicate open reading frames (ORFs) in the viral genome. Light purple boxes show mature proteins predicted based on aligned positions with reference viruses (see Materials and Methods). Gray vertical lines indicate nucleotide sequence features, such as polyadenylation signal [poly(A)], ribosomal frameshift signal (frameshift signal), and promoter sequence for subgenomic RNA synthesis (sgRNA promoter).
FIG 5
FIG 5
Characterization of virus sequences identified in this study. (A to E) Phylogenetic analyses of the genus Hepatovirus of the family Picornaviridae (A), the family Hepeviridae (B), the genus Mamastrovirus of the family Astroviridae (C), the genus Parechovirus of the family Picornaviridae (D), and the genus Pegivirus of the family Flaviviridae (E). These phylogenetic trees were constructed based on the maximum likelihood method (see Materials and Methods). Orange labels indicate viruses identified in this study, and colored animal silhouettes indicate the viral host species. Black labels and animal silhouettes indicate known viruses and their representative hosts, respectively. Scale bars indicate the genetic distance (substitutions per site). Blue numbers on branches indicate the bootstrap supporting values (%) with 1,000 replicates. Yellow boxes highlight viruses genetically similar to the novel virus identified in this study.
FIG 6
FIG 6
Detection of viral infections in the natural host population. (A, B, and E) Investigation of viral infections in the natural host population by quantifying viral reads for goat hepatovirus (A), blind mole-rat hepevirus (B), and bovine parechovirus (E). The graph indicates the viral read amount (read per million reads [RPM]) in each tissue or organ system. The gray dotted line indicates the criterion used to determine viral infections (RPM, 1.0). The lower portion of panel A shows the sample metadata. (C) Comparison of nucleotide sequence identities among the hepeviral sequences identified in five different blind mole-rats. The numbers in parentheses in each row are the total number of aligned sites between the viral contigs identified in each individual and the blind mole-rat hepevirus identified in accession no. ERR1742977. (D) Quantification of the macaque MLB-like viral infection levels in the patients with diarrhea and control macaque monkeys. The x axis indicates the diagnosis for the 24 monkeys, and the y axis indicates the RPM. The average RPM for each individual is plotted because six samples were collected from each individual. The dotted line indicates the criterion used for detecting viral infections (RPM, 1.0). We considered samples with RPMs below the criterion as nondetectable (ND). (F) Association between the parechovirus infections and symptoms. The tables show the number of RNA-seq data with and without parechovirus infections in two independent studies, which provide diagnostic information for gastrointestinal disorder (upper panel) and respiratory lesion (lower panel). The odds ratios and P values were obtained by Fisher’s exact test.

References

    1. Carroll D, Daszak P, Wolfe ND, Gao GF, Morel CM, Morzaria S, Pablos-Méndez A, Tomori O, Mazet JAK. 2018. The Global Virome Project. Science 359:872–874. doi:10.1126/science.aap7463. - DOI - PubMed
    1. Karesh WB, Dobson A, Lloyd-Smith JO, Lubroth J, Dixon MA, Bennett M, Aldrich S, Harrington T, Formenty P, Loh EH, Machalaba CC, Thomas MJ, Heymann DL. 2012. Ecology of zoonoses: natural and unnatural histories. Lancet 380:1936–1945. doi:10.1016/S0140-6736(12)61678-X. - DOI - PMC - PubMed
    1. Otte M, Nugent R, McLeod A. 2004. Transboundary animal diseases: assessment of socio-economic impacts and institutional responses, p 119–126. Food and Agriculture Organization, Rome, Italy.
    1. Zhang Y-Z, Chen Y-M, Wang W, Qin X-C, Holmes EC. 2019. Expanding the RNA virosphere by unbiased metagenomics. Annu Rev Virol 6:119–139. doi:10.1146/annurev-virology-092818-015851. - DOI - PubMed
    1. Greninger AL. 2018. A decade of RNA virus metagenomics is (not) enough. Virus Res 244:218–229. doi:10.1016/j.virusres.2017.10.014. - DOI - PMC - PubMed

Publication types

MeSH terms