. 2021 Aug 16;22(1):226.
doi: 10.1186/s13059-021-02453-5.

Chromatin interaction neural network (ChINN): a machine learning-based method for predicting chromatin interactions from DNA sequences

Affiliations

Chromatin interaction neural network (ChINN): a machine learning-based method for predicting chromatin interactions from DNA sequences

Fan Cao et al. Genome Biol. .

Abstract

Chromatin interactions play important roles in regulating gene expression. However, the availability of genome-wide chromatin interaction data is limited. We develop a computational method, chromatin interaction neural network (ChINN), to predict chromatin interactions between open chromatin regions using only DNA sequences. ChINN predicts CTCF- and RNA polymerase II-associated and Hi-C chromatin interactions. ChINN shows good across-sample performances and captures various sequence features for chromatin interaction prediction. We apply ChINN to 6 chronic lymphocytic leukemia (CLL) patient samples and a published cohort of 84 CLL open chromatin samples. Our results demonstrate extensive heterogeneity in chromatin interactions among CLL patient samples.

Keywords: 3D genome organization; Bioinformatics; ChIA-PET; Chromatin interactions; DNA sequence; Hi-C; Leukemia; Machine learning.


Conflict of interest statement

The authors declare that they have no competing interests.

Figures

Fig. 1
Fig. 1
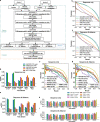
Performances of the functional genomic models on distance-matched datasets. The “Pol2” in the figure represents “RNA Pol II”. a Illustration of resolution discrepancy between cis-regulatory elements and chromatin interaction anchors. Precision-recall curves of the functional genomic models on distance-matched datasets using features based on b functional genomic data and distance (dis), c only functional genomic data, and d only distance. Numbers in brackets indicate the area-under precision-recall curve. e, f, Across-sample performances using distance (dis) and e signal values and f peak counts
Fig. 2
Fig. 2
Architecture and performances of the ChINN sequence-based models on distance-matched datasets. The “Pol2” in the figure represents “RNA Pol II”. a The architecture of the sequence-based models using to train on distance-matched datasets. Precision-recall curves of the sequence-based models on distance-matched datasets using b only sequence features or c sequence features with distance. The numbers in the brackets indicates the area-under precision-recall curves. Across-sample performances as measured by area-under precision-recall curve (auPRC) of the models on distance-matched datasets using d only sequence features or e sequence features with distance. Precision-recall curves of the sequence-based models on distance-matched Hi-C datasets using f only sequence features or g sequence features with distance. The numbers in the brackets indicates the area-under precision-recall curves. Across-sample performances as measured by area-under precision-recall curve (auPRC) of the models on distance-matched Hi-C datasets using h only sequence features or i sequence features with distance
Fig. 3
Fig. 3
Sequence feature importance scores of gradient boosted trees trained on extended datasets. The “Pol2” in the figure represents “RNA Pol II”. a, b The importance scores of sequence features extracted from both directions (F, forward; RC, reverse complement) of the two anchors (left and right) by models trained on different datasets. The orange horizontal lines indicate average importance scores of the features from the strand of the anchor. c Pearson correlations between feature importance scores of the two anchors. d The importance scores of sequence features extracted from both directions (F, forward; RC, reverse complement) of the two anchors (left and right) by models trained on Hi-C datasets. The orange horizontal lines indicate average importance scores of the features from the strand of the anchor. e Pearson correlations between feature importance scores of the two anchors in Hi-C datasets
Fig. 4
Fig. 4
Performances of the final “from-open chromatin” models and validations. The “Pol2” in the figure represents “RNA Pol II”. a Illustration of the two parameters, merging distance and extension size, used in constructing putative chromatin interactions anchors from open chromatin regions. b Area-under precision-recall curves of the “from-open ChIA-PET chromatin” models. c Area-under precision-recall curves of the Hi-C “from-open chromatin” models
Fig. 5
Fig. 5
Applying Hi-C model on new CLL samples. a The auPRC values achieved by GM12878 and K562 Hi-C model, x-axis: new CLL samples. b, c The confusion matrices for 6 new CLL samples using K562 Hi-C model with threshold of 0.016 and GM12878 Hi-C model with threshold of 0.025. x-axis, true label; y-axis, predicted label; 0, negative; 1, positive. d Summary of the predicted chromatin interactions in the 6 new CLL samples and the differential chromatin interactions between uCLL and mCLL samples. e Conservation analysis of predicted chromatin interactions in new CLL samples. All pairs, all possible pairs used for prediction; y-axis, the proportion of total chromatin interactions that can be found in a particular number of samples. f Uniqueness analysis of open chromatin regions that overlap with Hi-C peaks from GM12878 cells in new CLL samples. All, all open chromatin regions; y-axis, the proportion of total chromatin interactions that can be found in a particular number of samples
Fig. 6
Fig. 6
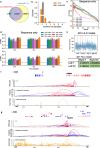
Performances of the sequence-based models in new CLL samples. a Venn diagram of chromatin interactions identified by Juicer in unmutated and mutated CLL samples. b Uniqueness analysis of real Hi-C and predicted Hi-C chromatin interactions in new CLL samples. Hi-C, real Hi-C interactions; predicted, predicted chromatin interactions using CLL 401 model. c Precision-recall curves of the sequence-based models on distance-matched Hi-C datasets using only sequence features. d Across-sample performances as measured by area-under precision-recall curve (auPRC) of the models on distance-matched Hi-C datasets using only sequence features. e The importance scores of sequence features extracted from both directions (F, forward; RC, reverse complement) of the two anchors (left and right) by models trained on CLL 401 sample. The orange horizontal lines indicate average importance scores of the features from the strand of the anchor. Pearson correlations between feature importance scores of the two anchors are given in the table. f Validations of predicted chromatin interactions by 4C-seq at GREB1 gene region in MCF-7 cells. In the predicted Hi-C interaction panel, only those interactions connected to GREB1 promoter were shown. g Validations of predicted chromatin interactions by 4C-seq at SIAH2 gene region in MCF-7 cells. In the predicted Hi-C interaction panel, only those interactions connected to SIAH2 promoter were shown
Fig. 7
Fig. 7
Predicted chromatin interactions in CLL samples. The “Pol2” in the figure represents “RNA Pol II”. a Summary of the predicted chromatin interactions in the 84 CLL samples and the differential chromatin interactions between uCLL and mCLL samples. b Conservation analysis of predicted chromatin interactions in the CLL samples. All pairs, all possible pairs used for prediction. c Uniqueness analysis of open chromatin regions that overlap with CTCF or RNA Pol II peaks from GM12878 cells in the CLL samples. All, all open chromatin regions. d Distribution of differential CTCF and RNA Pol II chromatin interactions based on whether both anchors (both), one anchor (one-side), or neither anchors (neither) showed the same level of differences between uCLL and mCLL samples as the associated chromatin interaction. e Association of differences in chromatin interactions between uCLL and mCLL samples with differentially expressed genes identified from a set of microarray samples. IFC, the fold change of the average number of chromatin interactions observed at the gene promoter in uCLL samples over that in mCLL samples. p-values were calculated using the Kruskal-Wallis test. f, g Examples of genes, ZBTB20 and LPL, whose different connectivity are associated with differences in distal regions. The red bars and curves indicate significantly different open chromatin regions and chromatin interactions based on Fisher’s exact test
Fig. 8
Fig. 8
Predicted chromatin interactions in CLL samples using GM12878 Hi-C model. a Summary of the predicted chromatin interactions in the 84 CLL samples and the differential chromatin interactions between uCLL and mCLL samples. b Conservation analysis of predicted chromatin interactions in the CLL samples. All pairs, all possible pairs used for prediction; y-axis, the proportion of total chromatin interactions that can be found in a particular number of samples. c Uniqueness analysis of open chromatin regions that overlap with Hi-C peaks from GM12878 cells in the CLL samples. All, all open chromatin regions; y-axis, the proportion of total chromatin interactions that can be found in a particular number of samples. d Distribution of differential Hi-C chromatin interactions based on whether both anchors (both), one anchor (one-side), or neither anchors (neither) showed the same level of differences between uCLL and mCLL samples as the associated chromatin interaction. e Association of differences in chromatin interactions between uCLL and mCLL samples with differentially expressed genes identified from a set of microarray samples. IFC, the fold change of the average number of chromatin interactions observed at the gene promoter in uCLL samples over that in mCLL samples. p-values were calculated using the Kruskal-Wallis test. f, g Examples of genes, ZBTB20 and LPL, whose different connectivity are associated with differences in distal regions. The red bars and curves indicate significantly different open chromatin regions and chromatin interactions based on Fisher’s exact test

References

    1. Babu D, Fullwood MJ. 3D genome organization in health and disease: emerging opportunities in cancer translational medicine. Nucleus. 2015;6:382–393. doi: 10.1080/19491034.2015.1106676. - DOI - PMC - PubMed
    1. Schottenfeld D, JDaly JM. Gastrointesinal cancer: epidemiology. In: Kelsen DP, Levin B, Kern SE, Tepper JE, editors. Gastrointestinal oncology: principles and practice. Philadelphia: Lippincott Williams and Wilkins; 2002.
    1. Akıncılar SC, Ekta K, Boon PLS, Unal B, Fullwood MJ, Tergaonkar V. Long-range chromatin interactions drive mutant TERT promoter activation. Cancer Disc. 2016;6(11):1276–1291. doi: 10.1158/2159-8290.CD-16-0177. - DOI - PubMed
    1. Li G, Ruan X, Auerbach RK, Sandhu KS, Zheng M, Wang P, Poh HM, Goh Y, Lim J, Zhang J, et al. Extensive promoter-centered chromatin interactions provide a topological basis for transcription regulation. Cell. 2012;148:84–98. doi: 10.1016/j.cell.2011.12.014. - DOI - PMC - PubMed
    1. Jin F, Li Y, Dixon JR, Selvaraj S, Ye Z, Lee AY, Yen CA, Schmitt AD, Espinoza CA, Ren B. A high-resolution map of the three-dimensional chromatin interactome in human cells. Nature. 2013;503:290–294. doi: 10.1038/nature12644. - DOI - PMC - PubMed