. 2021 Sep;31(9):1531-1545.
doi: 10.1101/gr.275133.120. Epub 2021 Aug 16.

Transposable elements and their KZFP controllers are drivers of transcriptional innovation in the developing human brain

Affiliations

Transposable elements and their KZFP controllers are drivers of transcriptional innovation in the developing human brain

Christopher J Playfoot et al. Genome Res. 2021 Sep.

Abstract

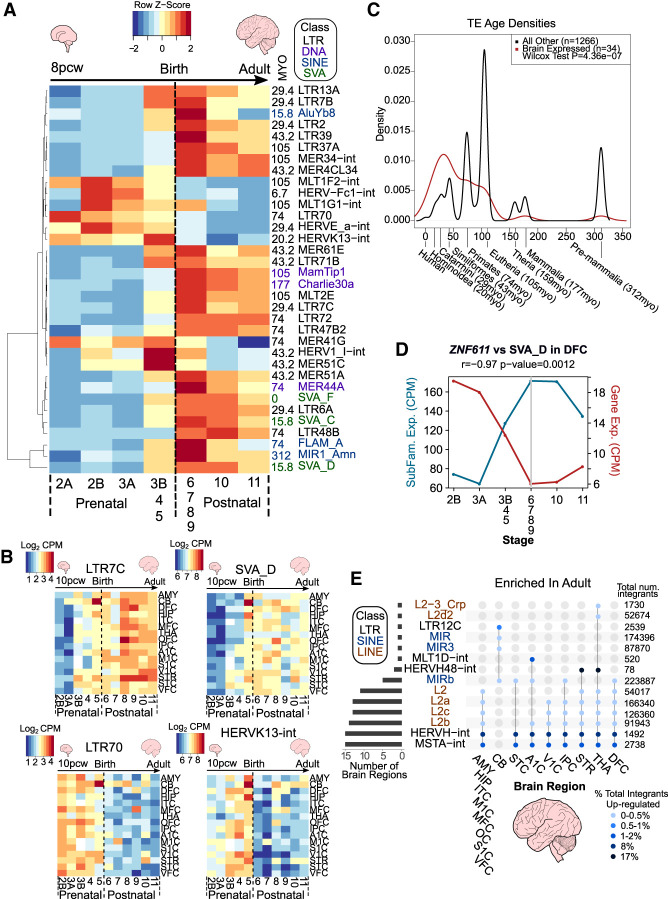
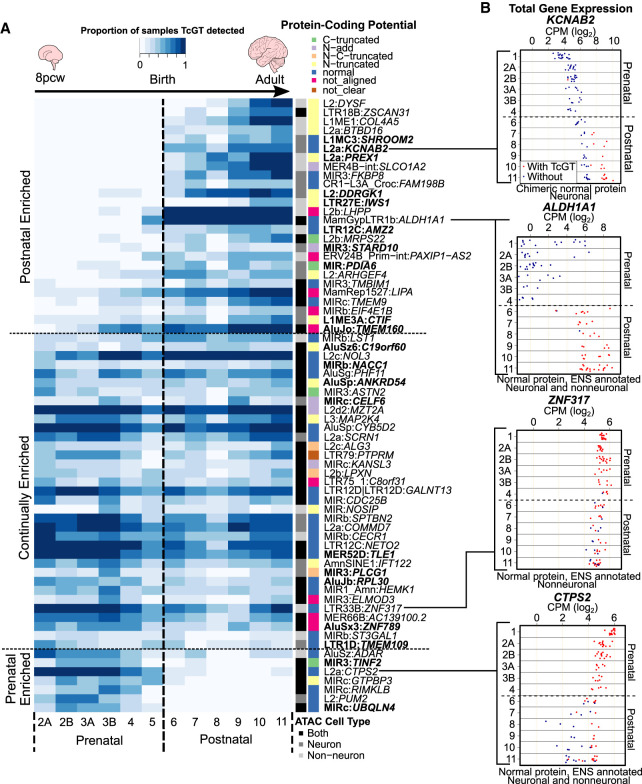
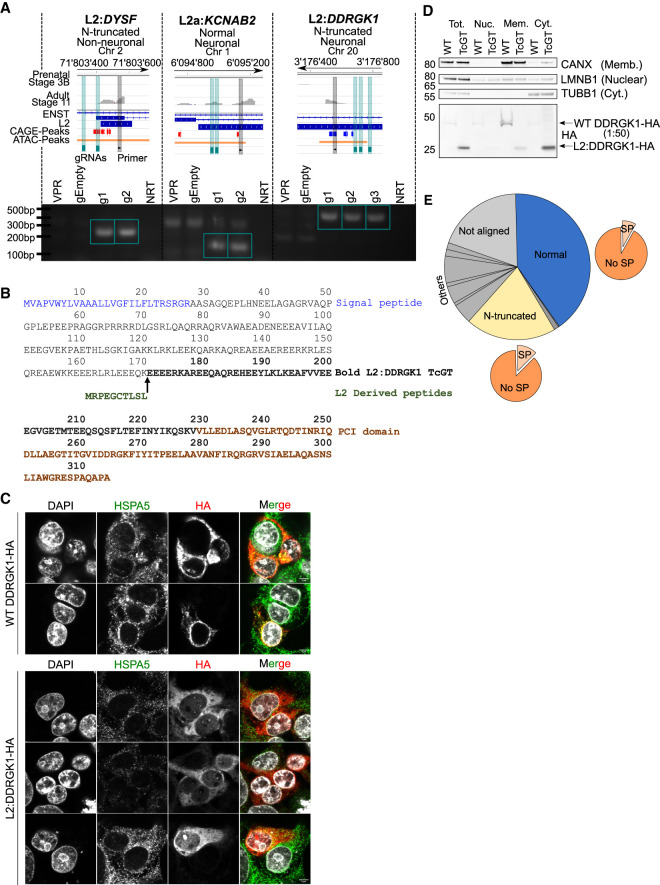
Transposable elements (TEs) account for more than 50% of the human genome and many have been co-opted throughout evolution to provide regulatory functions for gene expression networks. Several lines of evidence suggest that these networks are fine-tuned by the largest family of TE controllers, the KRAB-containing zinc finger proteins (KZFPs). One tissue permissive for TE transcriptional activation (termed "transposcription") is the adult human brain, however comprehensive studies on the extent of this process and its potential contribution to human brain development are lacking. To elucidate the spatiotemporal transposcriptome of the developing human brain, we have analyzed two independent RNA-seq data sets encompassing 16 brain regions from eight weeks postconception into adulthood. We reveal a distinct KZFP:TE transcriptional profile defining the late prenatal to early postnatal transition, and the spatiotemporal and cell type-specific activation of TE-derived alternative promoters driving the expression of neurogenesis-associated genes. Long-read sequencing confirmed these TE-driven isoforms as significant contributors to neurogenic transcripts. We also show experimentally that a co-opted antisense L2 element drives temporal protein relocalization away from the endoplasmic reticulum, suggestive of novel TE dependent protein function in primate evolution. This work highlights the widespread dynamic nature of the spatiotemporal KZFP:TE transcriptome and its importance throughout TE mediated genome innovation and neurotypical human brain development. To facilitate interactive exploration of these spatiotemporal gene and TE expression dynamics, we provide the "Brain TExplorer" web application freely accessible for the community.


Figures

Figure 1.
Figure 1.
KZFP genes show a global pre- to postnatal decrease in expression. (A) Heatmaps of KZFP expression across human neurogenesis in the DFC. Scale represents the row Z-score. See also Supplemental Table S2. (B) Dot plot of differential expression analysis of KZFP genes in the DFC comparing adult (stage 11) to early prenatal stages (stage 2A–3B) of neurogenesis. Only KZFPs differentially expressed in both data sets are shown. Up (orange) represents KZFPs significantly up-regulated in adult versus early prenatal (fold change ≥ 2, FDR ≤ 0.05). Down (blue) represents KZFPs significantly down-regulated in the adult (fold change ≤ –2, FDR ≤ 0.05). See also Supplemental Table S3. (C) Density plot depicting estimated age of KZFPs of each category in B (P ≤ 0.05, Wilcoxon test). (D) Heatmaps of TF expression across human neurogenesis in the DFC. Scale same as in A. (E) Dot plot of differential expression analysis of TFs (as defined by Lambert et al. 2018) in the DFC, excluding KZFP genes, comparing adult (stage 11) to early prenatal stages (stage 2A to 3B) of neurogenesis. Only TFs differentially expressed in both data sets are shown. Up (orange) represents TFs significantly up-regulated in the adult versus early prenatal (fold change ≥ 2, FDR ≤ 0.05). Down (blue) represents KZFPs significantly down-regulated in the adult (fold change ≤ –2, FDR ≤ 0.05). See also Supplemental Table S3. (F) Correlation plots representing the Pearson correlation coefficient of temporal KZFP expression (left) and TF expression (right) between all 16 regions. Size of spot and color both represent the correlation coefficient. (0) No correlation, (1) strong correlation. (G) Heatmaps depicting the log2 counts per million (CPM) for selected KZFPs and TFs over the 16 regions included. See also Supplemental Tables S1 and S2. All plots show expression data from BrainSpan.
Figure 2.
Figure 2.
TE subfamilies and unique loci show spatiotemporal expression patterns. (A) Heatmap of TE subfamilies with concordant expression behaviors between both data sets (Pearson correlation coefficient ≥ 0.7) across human neurogenesis in the DFC. See also Supplemental Table S4. The mean expression values for stages 3B, 4, and 5 and for stages 6, 7, 8, and 9 were combined and averaged to reduce inherent variability owing to low numbers of samples for some stages (see Supplemental Fig. S1B). Scale represents the row Z-score. TE subfamily age in million years old (MYO) and class are shown to the right of the plot. (B) Heatmaps of TE subfamily expression across human neurogenesis in all 16 regions. See also Supplemental Tables S4 and S5. Scale represents log2 counts per million (CPM). Stage 2A was omitted owing to the lack of samples for some brain regions (see Supplemental Fig. S1B). (C) Density plot depicting estimated age of TEs in A (P ≤ 0.05, Wilcoxon test). Evolutionary stages and corresponding ages in MYO are shown beneath the plot. (D) Line plot showing expression in CPM of ZNF611 and its main TE target subfamily, SVA_D, and their Pearson correlation coefficient (−0.97, P-value = 0.0012). Gray line indicates birth at stage 6. (E) UpSet plot showing the significantly enriched differentially expressed subfamilies between adult and early prenatal stages per region from unique mapping analyses. Joined points represent combinations of significantly differentially expressed TE subfamilies. Points are colored with respect to the percentage of total integrants up-regulated. The total number of TE subfamily integrants in the genome is shown to the right of the plot. See also Supplemental Tables S6 and S7. All plots show expression data from BrainSpan.
Figure 3.
Figure 3.
TE co-option as genic promoters drives spatiotemporal gene expression in human neurogenesis. (A) Dot plot showing the proportion of pre- or postnatal samples TcGTs were detected in and behaving similarly in both data sets (prenatal, postnatal, or continual). A TcGT was classed as “detected” if one or more reads were spliced between a TE and a genic exon. (B) Sashimi browser plots from the Integrative Genomics Viewer (IGV; Robinson et al. 2011; Thorvaldsdóttir et al. 2013) showing the splicing events in representative samples for prenatal enriched TcGT L2a:CTPS2 and the postnatal enriched LTR12C:SEMA4D. (C) Heatmap indicating the proportion of samples per GTEx tissue in which each TcGT from A was detected. Each row represents an individual TcGT and each column a different tissue. (C, inset) Pie chart indicating the proportion of neurodevelopmental TcGTs detected in GTEx. (D) Stacked barplots indicating the proportion of TcGT TE TSS loci overlapping an ATAC-seq peak from BOCA (left) and CAGE-peak from FANTOM5 (right), and pie charts indicating their cell type distribution (bottom left); ATAC and CAGE peak overlaps (center) and highlighting 21 novel, non-Ensembl-annotated transcripts. (E) Stacked barplots indicating the TE subfamily, TE class, TE age, and the Ensembl overlap of each TcGT TE TSS loci. For all TcGT information, see also Supplemental Table S8.
Figure 4.
Figure 4.
TcGTs are temporally expressed throughout neurogenesis in a cell type–specific manner, show protein-coding potential, and potentially drive transcript expression. (A) Heatmap showing the proportion of samples per developmental stage the 68 TcGTs (from Fig. 3D) were detected in the BrainSpan data set, regardless of region. Cell type–specific ATAC-seq overlaps and protein-coding potential determined via in silico translation are shown to the right of the plot. Bold indicates novel transcripts not annotated in Ensembl. See also Supplemental Table S8. (B) Dot plots showing the gene expression level per stage for the specified gene for samples in which the TcGT was detected (red) and in which it was not (blue) from the Cardoso data set in comparison to A. Dashed line represents birth at stage 6.
Figure 5.
Figure 5.
TcGTs are major contributors to neurodevelopmental transcript expression. (A, inset) Pie chart showing the number of TcGTs from Figure 4A detected with the same TE-derived TSS and isoform structure in PacBio long-read sequencing in the adult from Jeffries et al. (2020) in hg38. Bar charts show the proportion of total transcripts that are TcGT derived. Numbers above each bar represent the TcGT isoform PacBio transcript counts (red numbers) and annotated non-TcGT isoform PacBio transcript counts (blue numbers) in adult samples as determined by Jeffries et al. (2020). If some non-TcGT Ensembl-annotated isoforms had appreciably higher counts than others, only these were used. 5′-Truncated incomplete splice matches (as defined by Jeffries et al. 2020) for non-TcGTs were omitted unless similar in number to nontruncated transcripts. Red bars indicate the TcGT isoform is the primary transcript; black bars, TcGT isoforms have “equivalent” expression to canonical isoforms; and blue bars, TcGTs are subsidiary transcript isoforms. (B) Genome browser images of TcGTs (red) detected in long-read sequencing in prenatal and adult samples in hg38. Only the non-TcGT isoforms (blue) with the most PacBio transcript counts are shown for clarity. Vertical orange bars highlight the TE-derived TSS of the TcGTs and are the same as detected in our short-read RNA-seq analyses in hg19.
Figure 6.
Figure 6.
Antisense L2 elements directly drive TcGTs and contribute to chimeric protein formation and cytosolic relocalization of the ER membrane–associated DDRGK1. (A) Schematic of TcGT TE TSS loci for indicated genes and representative prenatal (stage 3B) and adult (stage 11) RNA-seq tracks. Their associated protein-coding potential and cell type specificity are highlighted, and CAGE peak loci (red sense strand, blue antisense strand), CRISPRa gRNAs (green vertical bar), and TE-associated PCR primers are shown (black vertical bar; top). RT-PCR on cDNA generated from HEK293T cells transiently transfected with dCAS9-VPR plasmid and individual gRNA plasmids containing sequences targeting the TcGT TE TSS loci denoted in the schematic. dCAS9-VPR (VPR) or empty gRNA plasmids (gEmpty) alone were used as controls. Green box indicates bands of correct PCR product size absent in controls. (NRT) No reverse transcriptase. (B) Canonical WT DDRGK1- and TcGT L2:DDRGK1-derived protein sequence. (C) Overexpression of canonical WT DDRGK1-HA and L2:DDRGK1-HA in HEK293T cells followed by immunofluorescent staining for HSPA5 (an ER membrane–associated protein) and HA tag, followed by confocal imaging (scale bar, 5 µm). (D) Overexpression of canonical WT DDRGK1-HA and L2:DDRGK1-HA (TcGT) in HEK293T cells followed by cellular fractionation and western blot for the indicated marker proteins (right of western blot) and HA tag. For WT DDRGK1, 50× less protein lysate compared with L2:DDRGK1 was loaded for the HA blot owing to high levels of protein expressed. Image is representative of two independent experiments. (E) Pie charts showing the in silico protein-coding potential of the 480 TcGTs identified in Figure 3A with the proportion containing a signal peptide shown with the orange pie charts. See also Supplemental Table S8.

References

    1. Adam SA, Schnell O, Pöschl J, Eigenbrod S, Kretzschmar HA, Tonn J-C, Schüller U. 2012. ALDH1A1 is a marker of astrocytic differentiation during brain development and correlates with better survival in glioblastoma patients. Brain Pathol 22: 788–797. 10.1111/j.1750-3639.2012.00592.x - DOI - PMC - PubMed
    1. Almagro Armenteros JJ, Tsirigos KD, Sønderby CK, Petersen TN, Winther O, Brunak S, von Heijne G, Nielsen H. 2019. SignalP 5.0 improves signal peptide predictions using deep neural networks. Nat Biotechnol 37: 420–423. 10.1038/s41587-019-0036-z - DOI - PubMed
    1. Attig J, Young GR, Hosie L, Perkins D, Encheva-Yokoya V, Stoye JP, Snijders AP, Ternette N, Kassiotis G. 2019. LTR retroelement expansion of the human cancer transcriptome and immunopeptidome revealed by de novo transcript assembly. Genome Res 29: 1578–1590. 10.1101/gr.248922.119 - DOI - PMC - PubMed
    1. Bashir R, Britton S, Strachan T, Keers S, Vafiadaki E, Lako M, Richard I, Marchand S, Bourg N, Argov Z, et al.1998. A gene related to Caenorhabditis elegans spermatogenesis factor fer-1 is mutated in limb-girdle muscular dystrophy type 2B. Nat Genet 20: 37–42. 10.1038/1689 - DOI - PubMed
    1. Bourque G, Leong B, Vega VB, Chen X, Lee YL, Srinivasan KG, Chew J-L, Ruan Y, Wei C-L, Ng HH, et al.2008. Evolution of the mammalian transcription factor binding repertoire via transposable elements. Genome Res 18: 1752–1762. 10.1101/gr.080663.108 - DOI - PMC - PubMed

Publication types

Substances