

Economic impacts of tipping points in the climate system
- PMID: 34400500
- PMCID: PMC8403967
- DOI: 10.1073/pnas.2103081118
Economic impacts of tipping points in the climate system
Abstract
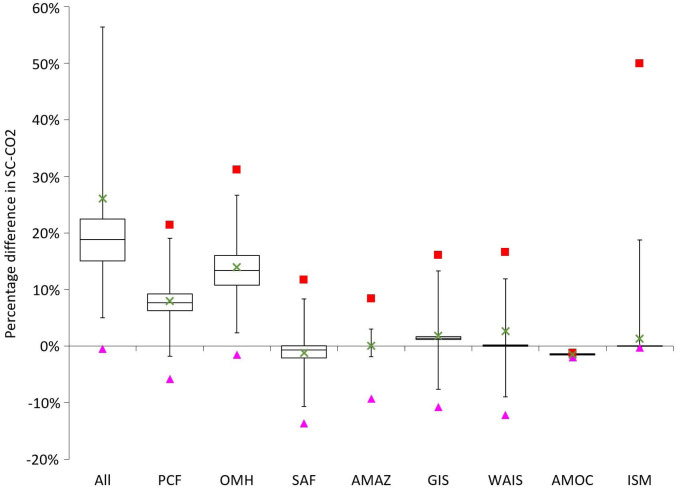
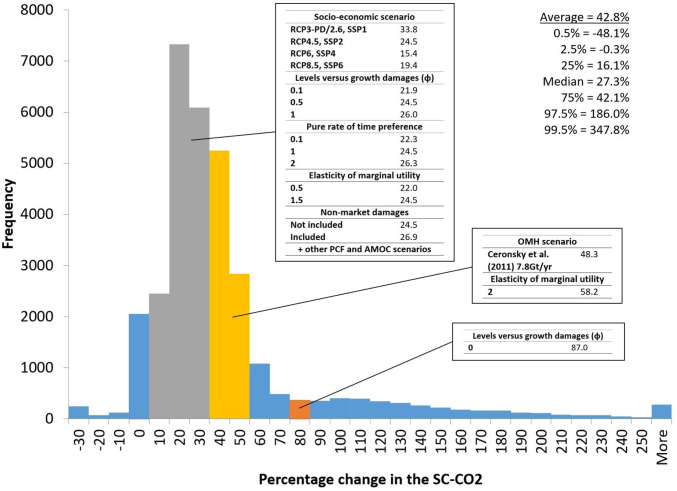
Climate scientists have long emphasized the importance of climate tipping points like thawing permafrost, ice sheet disintegration, and changes in atmospheric circulation. Yet, save for a few fragmented studies, climate economics has either ignored them or represented them in highly stylized ways. We provide unified estimates of the economic impacts of all eight climate tipping points covered in the economic literature so far using a meta-analytic integrated assessment model (IAM) with a modular structure. The model includes national-level climate damages from rising temperatures and sea levels for 180 countries, calibrated on detailed econometric evidence and simulation modeling. Collectively, climate tipping points increase the social cost of carbon (SCC) by ∼25% in our main specification. The distribution is positively skewed, however. We estimate an ∼10% chance of climate tipping points more than doubling the SCC. Accordingly, climate tipping points increase global economic risk. A spatial analysis shows that they increase economic losses almost everywhere. The tipping points with the largest effects are dissociation of ocean methane hydrates and thawing permafrost. Most of our numbers are probable underestimates, given that some tipping points, tipping point interactions, and impact channels have not been covered in the literature so far; however, our method of structural meta-analysis means that future modeling of climate tipping points can be integrated with relative ease, and we present a reduced-form tipping points damage function that could be incorporated in other IAMs.
Keywords: climate risk; climate tipping points; integrated assessment model; social cost of carbon.
Copyright © 2021 the Author(s). Published by PNAS.
Conflict of interest statement
The authors declare no competing interest.
Figures

Comment in
-
Estimates of economic and environmental damages from tipping points cannot be reconciled with the scientific literature.Proc Natl Acad Sci U S A. 2022 May 24;119(21):e2117308119. doi: 10.1073/pnas.2117308119. Epub 2022 May 19. Proc Natl Acad Sci U S A. 2022. PMID: 35588449 Free PMC article. No abstract available.
-
Reply to Keen et al.: Dietz et al. modeling of climate tipping points is informative even if estimates are a probable lower bound.Proc Natl Acad Sci U S A. 2022 May 24;119(21):e2201191119. doi: 10.1073/pnas.2201191119. Epub 2022 May 19. Proc Natl Acad Sci U S A. 2022. PMID: 35588452 Free PMC article. No abstract available.
References
-
- Alley R. B., et al. ., Abrupt climate change. Science 299, 2005–2010 (2003). - PubMed
-
- IPCC, Summary for Policymakers in Climate Change 2014: Impacts, Adaptation, and Vulnerability. Contribution of Working Group II to the Fifth Assessment Report of the Intergovernmental Panel on Climate Change (Cambridge University Press, Cambridge, United Kingdom, 2014).
-
- IPCC, Summary for Policymakers in Global Warming of . An IPCC Special Report on the Impacts of Global Warming of C above Pre-Industrial Levels and Related Global Greenhouse Gas Emission Pathways, in the Context of Strengthening the Global Response to the Threat of Climate Change, Sustainable Development, and Efforts to Eradicate Poverty, V. Masson-Delmotte et al., Eds. (Cambridge University Press, Cambridge, United Kingdom, 2018).
-
- Oppenheimer M., et al. , Emergent Risks and Key Vulnerabilities in Climate Change 2014: Impacts, Adaptation, and Vulnerability. Contribution of Working Group II to the Fifth Assessment Report of the Intergovernmental Panel on Climate Change, Field C. B., et al., Eds. (Cambridge University Press, Cambridge, United Kingdom, 2014), pp. 1039–1099.
Publication types
LinkOut - more resources
Full Text Sources
Research Materials
