. 2021 Aug 16;9(1):37.
doi: 10.1038/s41413-021-00163-z.

Spatially defined single-cell transcriptional profiling characterizes diverse chondrocyte subtypes and nucleus pulposus progenitors in human intervertebral discs

Affiliations

Spatially defined single-cell transcriptional profiling characterizes diverse chondrocyte subtypes and nucleus pulposus progenitors in human intervertebral discs

Yibo Gan et al. Bone Res. .

Abstract

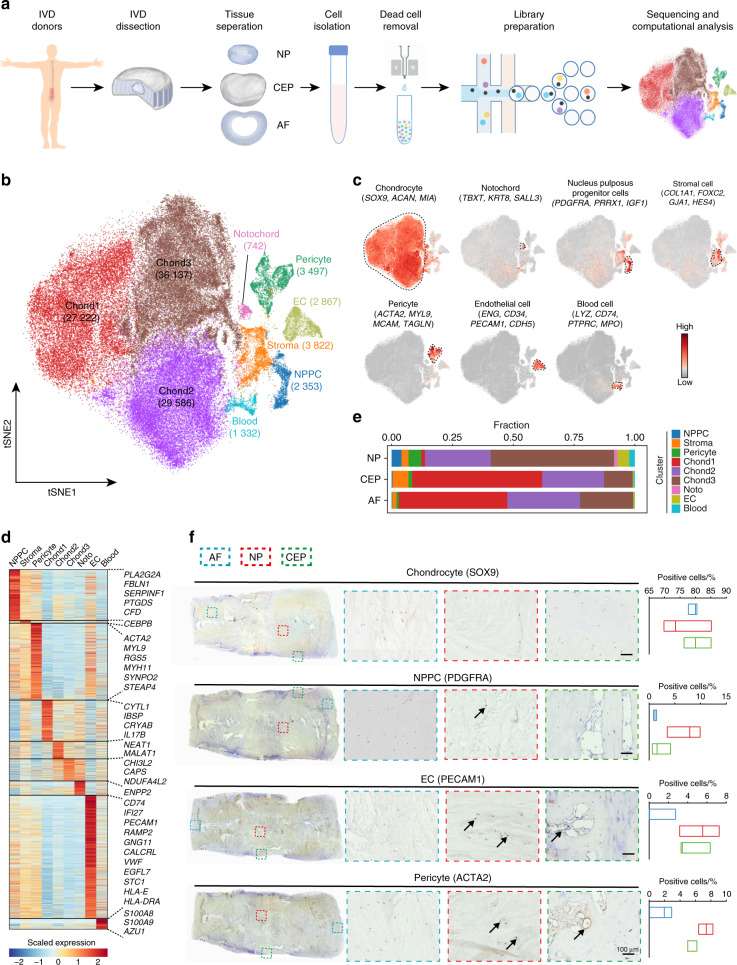
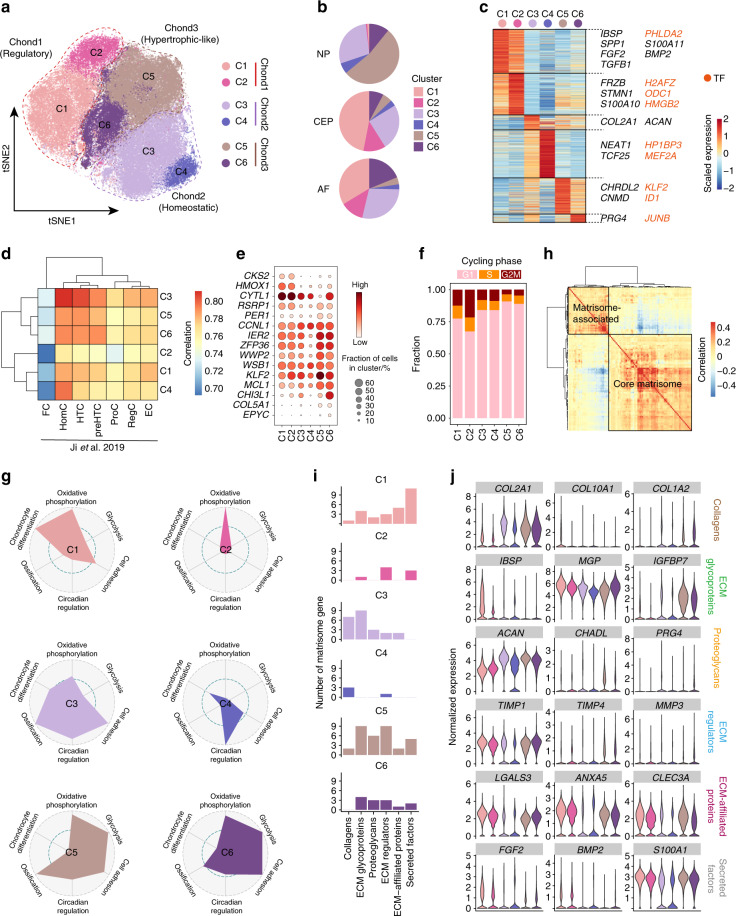
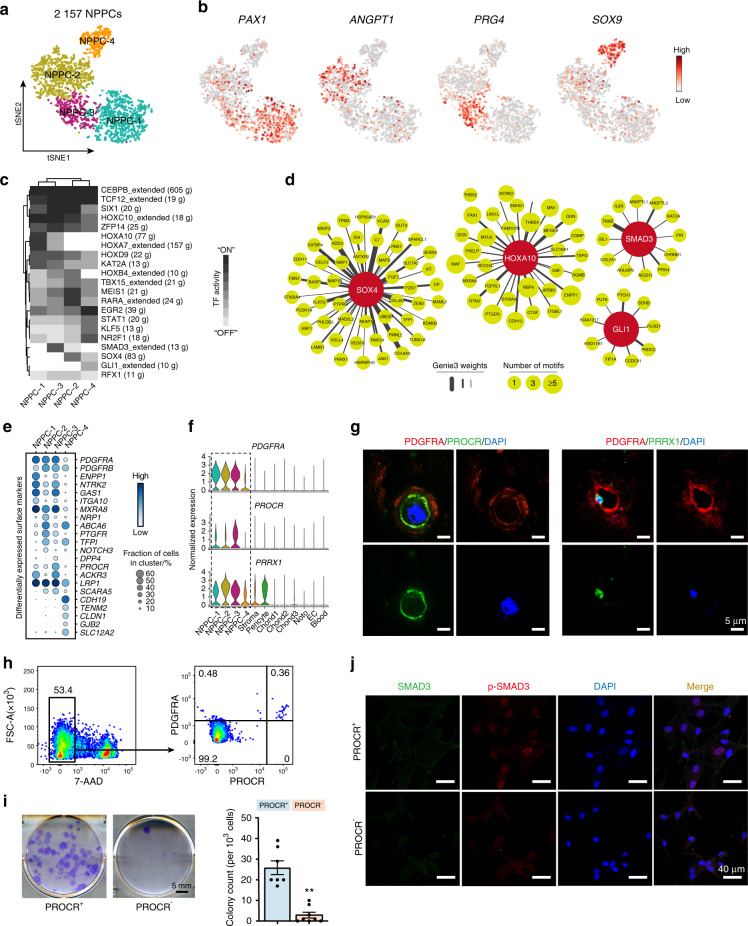
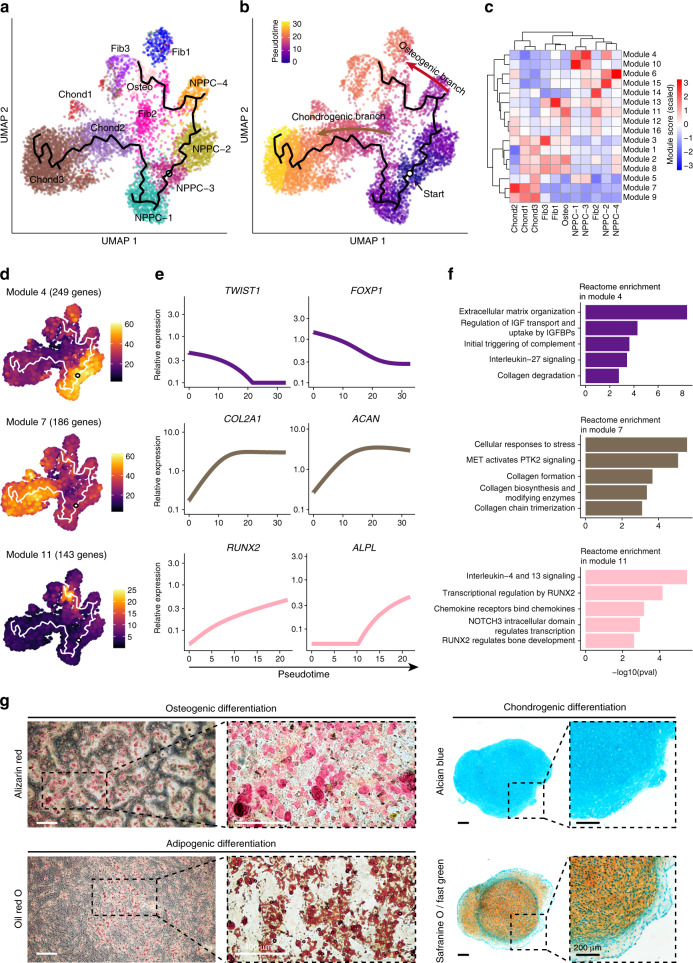
A comprehensive understanding of the cellular heterogeneity and molecular mechanisms underlying the development, homeostasis, and disease of human intervertebral disks (IVDs) remains challenging. Here, the transcriptomic landscape of 108 108 IVD cells was mapped using single-cell RNA sequencing of three main compartments from young and adult healthy IVDs, including the nucleus pulposus (NP), annulus fibrosus, and cartilage endplate (CEP). The chondrocyte subclusters were classified based on their potential regulatory, homeostatic, and effector functions in extracellular matrix (ECM) homeostasis. Notably, in the NP, a PROCR+ resident progenitor population showed enriched colony-forming unit-fibroblast (CFU-F) activity and trilineage differentiation capacity. Finally, intercellular crosstalk based on signaling network analysis uncovered that the PDGF and TGF-β cascades are important cues in the NP microenvironment. In conclusion, a single-cell transcriptomic atlas that resolves spatially regulated cellular heterogeneity together with the critical signaling that underlies homeostasis will help to establish new therapeutic strategies for IVD degeneration in the clinic.


Conflict of interest statement

The authors declare no competing interests.

Figures

Fig. 1
Fig. 1
Single-cell transcriptomic landscape of human intervertebral disc (IVD) cells. a Schematic workflow of the experimental strategy. Cells isolated from the NP, AF, and CEP of the human IVD were subjected to droplet-based scRNA-seq. NP nucleus pulposus, CEP cartilage endplate, AF annulus fibrosus, IVD intervertebral disc, scRNA-seq single-cell RNA sequencing. b Distribution of 108 108 cells from human intervertebral disks. Eight cell clusters were visualized by a tSNE plot. Cell numbers for each cluster are indicated in brackets. NPPC nucleus pulposus progenitor cell, EC endothelial cell, Chond chondrocyte, tSNE t-distributed stochastic neighbor embedding. c The average expression of curated feature genes for cell clusters defined in b on the tSNE map. d Heatmap revealing the scaled expression of DEGs for each cell cluster. DEGs differentially expressed genes. e Fraction of cell clusters in the NP, CEP, and AF. f Representative immunohistochemistry staining of signature markers of the indicated cell clusters in the AF, NP, and CEP of healthy human IVD tissues and quantification of positive cells displayed with a box plot (n = 3). Scale bar, 100 μm
Fig. 2
Fig. 2
Characterization of chondrocytes in the human IVD. a tSNE plot of the six subclusters of 93 495 chondrocytes defined in the IVD. b Fraction of each chondrocyte subcluster in the NP, CEP, and AF. c Heatmap revealing the scaled expression of DEGs for each chondrocyte subcluster. d Heatmap showing pairwise Pearson correlations in the global transcriptome between IVD chondrocytes and articular chondrocytes (Ji et al.,). FC fibrocartilage chondrocyte, HomC homeostatic chondrocyte, HTC hypertrophic chondrocyte, preHTC prehypertrophic chondrocyte, ProC proliferative chondrocyte, RegC regulatory chondrocyte, EC effector chondrocyte. e Dot plot showing the mean expression of selected chondrocyte function-associated genes among the six chondrocyte subclusters. Dot size indicates the percentage of cells in subclusters with detected expression. f The fraction of each chondrocyte subcluster arrested in the different cell-cycle phases. g Radar map showing the performance of six gene sets associated with the indicated function and metabolic pathway among each chondrocyte subcluster. h Heatmap showing pairwise Pearson correlations of expressed matrisome genes in chondrocytes. Two signature patterns (matrisome-associated and core matrisome) were identified by hierarchical clustering. i The number of expressed genes associated with six matrisome patterns in each chondrocyte subcluster. ECM extracellular matrix. j Violin plots showing the expression levels of representative genes associated with six matrisome patterns in each chondrocyte subcluster
Fig. 3
Fig. 3
Characterization of NPPC in human IVD. a Four subclusters of 2 157 NPPCs were visualized by a tSNE plot. b tSNE plot of signature gene expression in NPPCs. c Heatmap revealing binary regulon activities analyzed with SCENIC in each subcluster of NPPCs. “ON” indicates active regulons; “OFF” indicates inactive regulons. SCENIC Single-Cell Regulatory Network Inference and Clustering. d The HOXA10, SOX4, SMAD3, and GLI1 regulon networks in NPPC subclusters. The TFs are in dark red, and the corresponding target genes are in light green. The line thickness indicates the level of GENIE3 weights. The dot size indicates the number of enriched TF motifs. TFs transcription factors, GENIE3 GEne Network Inference with Ensemble of trees. e Dot plot showing differentially expressed genes encoding surface markers in each subcluster of NPPCs. f Violin plots showing the expression levels of the signature genes of NPPC-3 in the IVD. g Immunofluorescence staining showing the coexpression of PDGFRA, PROCR, and PRRX1 in human IVD cells in situ (n = 3). Scale bar, 5 μm. h Flow cytometry gating strategies for sorting PDGFRA+PROCR+ in the human IVD. i Representative crystal violet staining of CFU-F colonies generated by sorted primary PROCR+ cells of the human IVD (left, n = 3). Scale bar, 5 mm. Quantification of the number of CFU-F colonies (right). The statistical significance of differences was determined using one-way ANOVA with multiple comparison tests (LSD). **P < 0.000 1. Error bars indicate the SEM. CFU-F colony-forming unit-fibroblast, ANOVA Analysis of Variance, LSD least significant difference, SEM Standard Error of the Mean. j Immunofluorescence staining of SMAD3 and p-SMAD3 in the PROCR+ and PROCR cells of the human IVD (n = 3). Scale bar, 40 μm
Fig. 4
Fig. 4
Reconstruction of bilineage trajectories in NP cells. a UMAP visualization of NPPC, chondrocyte, fibroblast, and osteogenic subclusters. The principal graph of trajectories reported by Monocle 3 was rooted in NPPC-3, as indicated by a cycle. UMAP, Uniform manifold approximation and projection. b Developmental pseudotime for cells present along the trajectory inferred by Monocle 3, with osteogenic and chondrogenic branches coming from NPPC subclusters. c Heatmap showing the scaled mean expression of modules of coregulated genes grouped by Louvain community analysis across the subclusters. d UMAP plots showing the relative expression level of representative gene modules in NP cell subclusters. e Pseudotime kinetics of the indicated genes in the modules in d from the root along the trajectories to chondrogenic and osteogenic differentiation. f Histogram showing the pathways enriched by ReactomePA for each module indicated in d. g Representative alizarin red (top left), oil red O (bottom left), alcian blue (top right), and safranine O/fast green (bottom right) staining after the osteogenic, adipogenic, and chondrogenic differentiation of PROCR+ cells (n = 3). Magnified images of the boxed areas are shown on the right. White scale bars, 400 μm. Black scale bars, 200 μm
Fig. 5
Fig. 5
Overview of the crosstalk networks among the clusters in the NP. a Overview of the cellular network regulating the homeostasis of the NP. Dots indicate cell clusters. The dot size indicates the relative quantity of each cluster. The thickness of the directed line indicates the relative quantity of significant ligand-receptor pairs between any two pairs of cell clusters. b-e Circle plots showing the inferred VEGF (b), TGF-β (c), PDGF (d), and FGF (e) signaling networks. f Dot plot showing the communication probability of the indicated ligand-receptor pairs between EC, Pericyte, Neu, and Fib3 subclusters (sending signals) and four NPPC subclusters (accepting signals). g Representative alcian blue and toluidine blue staining for the chondrogenic effect of TGF-β3 supplementation (10 ng·mL−1) for 28 days on PROCR+ cells from the human IVD. Scale bars, 400 μm. h Histogram showing the proliferation of PDGF-AA (20 ng·mL−1) on PROCR+ cells from the human IVD detected by a CCK-8 kit (n = 3). The statistical significance of differences was determined using one-way ANOVA with multiple comparison tests (LSD). **P < 0.01 compared with the control group at day 10. ##P < 0.01 compared with the PDGF-AA group at day 10. Error bars indicate the SEM

References

    1. Katz JN. Lumbar disc disorders and low-back pain: socioeconomic factors and consequences. J. Bone Jt. Surg. Am. 2006;88:21–24. - PubMed
    1. Colombier P, Camus A, Lescaudron L, Clouet J, Guicheux J. Intervertebral disc regeneration: a great challenge for tissue engineers. Trends Biotechnol. 2014;32:433–435. doi: 10.1016/j.tibtech.2014.05.006. - DOI - PubMed
    1. Lewis RA, et al. Comparative clinical effectiveness of management strategies for sciatica: systematic review and network meta-analyses. Spine J. 2015;15:1461–1477. doi: 10.1016/j.spinee.2013.08.049. - DOI - PubMed
    1. Cloyd JM, et al. Material properties in unconfined compression of human nucleus pulposus, injectable hyaluronic acid-based hydrogels and tissue engineering scaffolds. Eur. Spine J. 2007;16:1892–1898. doi: 10.1007/s00586-007-0443-6. - DOI - PMC - PubMed
    1. Risbud MV, Shapiro IM. Notochordal cells in the adult intervertebral disc: new perspective on an old question. Crit. Rev. Eukaryot. Gene Expr. 2011;21:29–41. doi: 10.1615/CritRevEukarGeneExpr.v21.i1.30. - DOI - PMC - PubMed