. 2021 Aug 16;12(1):4961.
doi: 10.1038/s41467-021-25202-5.

Large-scale and high-resolution mass spectrometry-based proteomics profiling defines molecular subtypes of esophageal cancer for therapeutic targeting

Affiliations

Large-scale and high-resolution mass spectrometry-based proteomics profiling defines molecular subtypes of esophageal cancer for therapeutic targeting

Wei Liu et al. Nat Commun. .

Abstract

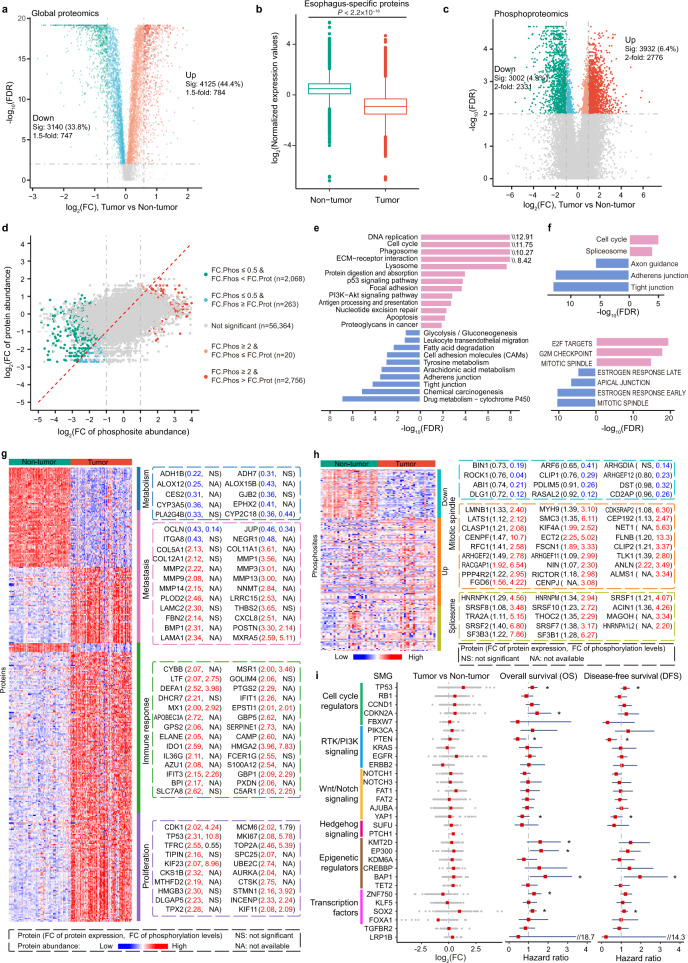
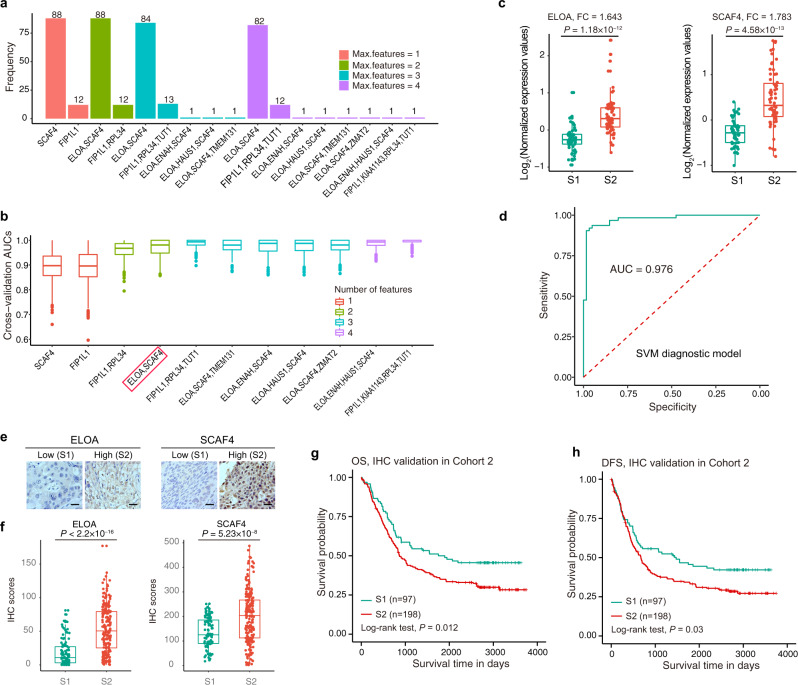
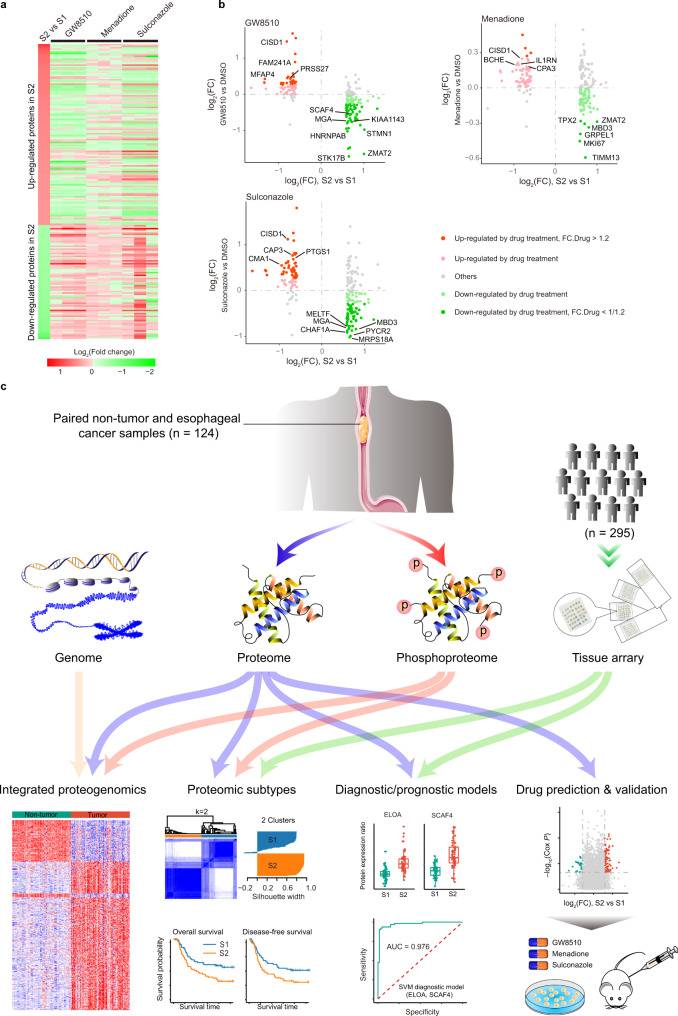
Esophageal cancer (EC) is a type of aggressive cancer without clinically relevant molecular subtypes, hindering the development of effective strategies for treatment. To define molecular subtypes of EC, we perform mass spectrometry-based proteomic and phosphoproteomics profiling of EC tumors and adjacent non-tumor tissues, revealing a catalog of proteins and phosphosites that are dysregulated in ECs. The EC cohort is stratified into two molecular subtypes-S1 and S2-based on proteomic analysis, with the S2 subtype characterized by the upregulation of spliceosomal and ribosomal proteins, and being more aggressive. Moreover, we identify a subtype signature composed of ELOA and SCAF4, and construct a subtype diagnostic and prognostic model. Potential drugs are predicted for treating patients of S2 subtype, and three candidate drugs are validated to inhibit EC. Taken together, our proteomic analysis define molecular subtypes of EC, thus providing a potential therapeutic outlook for improving disease outcomes in patients with EC.


Conflict of interest statement

The authors declare no competing interests.

Figures

Fig. 1
Fig. 1. Large-scale proteomic and phosphoproteomic analysis of esophageal cancer (EC).
a Summary of EC samples and cell lines for proteomic, phosphoproteomic and/or immunohistochemical analysis. One hundred and twenty-four paired EC tumor and adjacent normal samples (cohort 1) were divided into 25 groups for TMT proteomics, and 31 paired samples were subjected to lable-free phosphoproteomics. EC tumor samples from 295 patients (cohort 2) were used for immunohistochemistry. b The overlap of proteins and phosphoproteins. Seven thousand one hundred and fifty-one proteins were identified with 66,446 phosphosites. Seven thousand one hundred and one proteins were identified with only their non-phosphorylated forms. Three hundred and forty-three proteins were identified with only their phosphorylated forms. Prot1: proteins with quantified values in at least one of those 25 groups of samples used for proteomic analysis as shown in a; Phos2: phosphorylation sites with quantified values in at least one of those 31 pairs of samples used for phosphoproteomics analysis as shown in a. c Cumulative number of proteins quantified in 25 groups of samples. d Distribution of the number of groups in which the proteins were quantifiable. Ten thousand six hundred and ninety-three proteins were identified in ≥10 groups, and 7545 proteins were quantified in all 25 groups. e Principle component (PC) analysis of the TMT proteomic data separated tumor samples from non-tumor samples, and no batch effects were observed. Samples analyzed in different TMT groups (batches) are shown with different shapes. Tumor and non-tumor samples are colored in red and green, respectively. The ellipse presents the 0.9 confidence intervals for each type. Var.: variation. f Hierarchical clustering of the 124 paired tumor and non-tumor samples. g Subcellular distribution of all proteins, upregulated proteins, downregulated proteins, and phosphoproteins detected.
Fig. 2
Fig. 2. Dysregulated proteins and pathways were identified by proteomic analysis.
a Volcano plot indicating proteins upregulated or downregulated in tumors. Light red and green colors represent proteins with BH adjusted P value (< 0.01) (Sig), whereas red and green represent proteins with BH adjusted P value (< 0.01) and more than 1.5-fold change. Other proteins are colored in gray. P values were calculated using the two-sided Wilcoxon signed-rank test. b Box plot of log2-transformed fold change of esophageal-specific proteins (Tumor, n = 124; Non-tumor, n = 124). P value was calculated using the two-sided Wilcoxon rank-sum test. In the box plots, the middle bar represents the median, and the box represents the interquartile range; bars extend to 1.5× the interquartile range. c Volcano plot indicating phosphosites upregulated and downregulated in tumors. Colors are the same as describe in a except that red and green represent proteins with more than 2-fold change. d Comparison of the changes of phosphosite abundance (FC.Phos) with those of the corresponding protein abundance (FC.Prot). The red dashed line indicates the diagonal line. Green and light green colors indicate significantly downregulated phosphosites (BH adjusted P value < 0.01 and FC.Phos ≤ 0.5), whereas green further requires FC.Phos < FC.Prot. Red and light red colors indicate significantly upregulated phosphosites (BH adjusted P value < 0.01 and FC.Phos ≥ 2), whereas red further requires FC.Phos > FC.Prot. Other phosphosites are colored in gray. P values were calculated using the two-sided Wilcoxon signed-rank test. e Enriched KEGG pathways for differential proteins colored by red and green as shown in a. Pink bars indicate pathways enriched in the upregulated proteins (n = 784). Blue bars indicate pathways enriched in the downregulated proteins (n = 747). f KEGG pathways (top) and hallmark get sets (bottom) enriched for differential phosphoproteins. Pink bars indicate pathways enriched in the upregulated phosphoproteins (n = 1040). Blue bars indicate pathways enriched in the down-regulated phosphoproteins (n = 576). g Heat map representation of the expression levels of selected, differential expressed proteins between tumor and non-tumor samples (FC >1.5 or <0.67). Functional categories related to selected proteins are denoted beside the heat map. The right panel shows the proteins whose expression levels changed larger than 2-fold between tumor and non-tumor samples, and that are significant correlated with patient risk. The two-sided log-rank P values (without correction for multiple testing) were calculated by the Xtile method. h Heat map representation of the phosphorylation levels of differential phosphosites. The right panel shows the phosphoproteins that changed larger than 2-fold in phosphorylation abundance between tumor and non-tumor samples. i Protein expression variations of significantly mutated genes (SMGs). Left, log2-transformed fold change between paired tumor (n = 124) and non-tumors (n = 124) (mean in red). Middle, the red points indicate the overall survival hazard ratios of SMGs, and the endpoints represent lower or upper of the 95% confidence intervals. Right, the red points indicate the disease-free survival hazard ratios, and the endpoints represent lower or upper of the 95% confidence intervals. *Cox P value < 0.1. The two-sided Cox P values (without correction for multiple testing) were calculated using the Cox PH model.
Fig. 3
Fig. 3. Molecular subtypes of EC were defined by proteomic analysis.
a Consensus clustering of EC tumor samples. The left panel shows consensus matrices of the 124 EC samples with two clusters (k = 2). Consensus clustering was performed on the top 25% most-variant proteins in Prot5 as described in Supplementary Fig. 2a. The right panel shows the silhouette-width plot. b Average silhouette-width plot. The average silhouette width takes the maximum value when number of clusters was 2 (k = 2). c Kaplan–Meier curves of overall survival (left) and disease-free survival (right) for subtype S1 and S2. P values were calculated by two-sided log-rank test. d Heatmap representation of the relative protein abundance of differentially expressed proteins between S2 and S1 (BH adjusted P value < 0.01, FC > 1.5 or <0.67). The upper panel shows the association between molecular subtypes and clinicopathologic characteristics. GO (gene ontology) biological functions related to these proteins are denoted on the right. The P values were calculated by chi-squared test. e Volcano plot indicating proteins upregulated and downregulated in subtype S2. Light red and green colors represent proteins with BH adjusted P value < 0.01 (Sig), whereas red and green represent proteins with BH adjusted P value < 0.01 and fold change more than 1.5. Other proteins are colored in gray. P values were calculated using the two-sided Wilcoxon rank-sum test. f Volcano plot indicating phosphosites upregulated and downregulated in subtype S2. Colors are the same as in e except that red and green represent proteins with fold change more than 2. P values were calculated using the two-sided Wilcoxon rank-sum test. g KEGG pathways (left) and hallmark get sets (right) enriched in differentially expressed proteins between subtype S1 and S2. Pink bars indicate pathways enriched in the upregulated proteins (n = 137). Blue bars indicate pathways enriched in the downregulated proteins (n = 93). h KEGG pathways (left) and hallmark get sets (right) enriched for phosphoproteins with differential phosphorylation between subtype S1 and S2. Pink bars indicate pathways enriched in the upregulated phosphoproteins (n = 541). Blue bars indicate pathways enriched in the downregulated phosphoproteins (n = 519).
Fig. 4
Fig. 4. Subtype diagnostic signature composed of ELOA and SCAF4 were identified in EC.
a Bar plots of the frequency of the signatures in 100 times feature selections. Red, green, cyan, and purple indicate that the maximum number of features is 1, 2, 3, and 4, respectively. b Box plots of the cross-validation AUCs (area under the ROC curve, n = 100) of the 11 signatures shown. c Box plots of log2-transformed protein expression ratios of ELOA (left) and SCAF4 (right) (S1, n = 61; S2, n = 63). P values are calculated by the two-sided Wilcoxon rank-sum test. d ROC curve of the SVM model with signature 4 (ELOA, SCAF4). e Representative IHC (immunohistochemistry) images of ELOA and SCAF4 protein expression in the independent EC Cohort (Cohort 2, n = 295). Scale bars, 100 µm. f Box plots of IHC scores of ELOA (left) and SCAF4 (right) in the predicted S1 and S2 patients in Cohort 2 (S1, n = 97; S2, n = 198). P values are calculated by the two-sided Wilcoxon rank-sum test. g, h Kaplan–Meier curves of OS (g) and DFS (h) for each predicted subtype in the independent EC Cohort 2. P values are calculated by two-sided log-rank test. In the box plots b, c, f), the middle bar represents the median, and the box represents the interquartile range; bars extend to 1.5× the interquartile range.
Fig. 5
Fig. 5. Drug prediction and validation for EC based on molecular subtype defined.
a Workflow of drug prediction. Volcano plot indicates proteins that are differentially expressed between S1 and S2 and significantly associated with overall survival (Cox P value < 0.05). The two-sided Cox P values (without correction for multiple testing) were calculated using the Cox PH model. Red and green represent proteins with fold change larger than 1.5 between S1 and S2. Other genes are colored in gray. The 86 upregulated and 24 downregulated proteins were used as the query signature to match the reference profiles of perturbagens in CMAP to calculate connectivity scores. Perturbagens are sorted by connectivity score in increasing order, and the top perturbagens are predicted as candidate drugs. b Protein–protein interaction network of the query signature in a. The protein–protein interactions were obtained from the STRING database. The width of the line indicates the edge confidence. Upregulated proteins are colored in red, and downregulated proteins in blue. Several significantly enriched biological processes are highlighted by different colors. c Viabilities of six EC cell lines treated with six candidate drugs at concentrations as indicated for 24 h. Representative data from four biological repeats was shown (mean ± SD). d Colony formation assays of six EC cell lines treated with DMSO or three drugs as indicated. Representative data from three biological repeats was shown (mean ± SD). P values were calculated by unpaired two-sided Student’s t-test. Sulconazole, 50 μM; Menadione, 20 μM; GW8510, 15 μM. e, g Tumor growth in KYSE30 (e) and KYSE150 (g)-derived tumor xenograft mouse models treated with DMSO or three drugs as indicated. GW8510, 5 mg/kg; Menadione,10 mg/kg; Sulconazole, 10 mg/kg. f, h Growth curve of tumors as described in e and g (n = 5 independent animals). Data are presented as mean ± SD. P values were calculated by unpaired two-sided Student’s t-test.
Fig. 6
Fig. 6. The effects of Sulconazole, Menadione and GW8510 on EC cell growth were linked to their regulation of differentially expressed proteins in the S1 and S2 subtypes.
a The expression of proteins differentially expressed between S1 and S2 subtype in response to the three drugs as indicated in KYSE150 cells. Three biological repeats were performed. b Altered proteins in KYSE150 cells treated with three drugs. Light green indicates proteins that are up-regulated in S2 (n = 137) but downregulated by drug treatment. Light red indicates proteins that are downregulated in S2 (n = 93) but upregulated by drug treatment. Green and red indicate proteins that had fold change more than 1.2 in response to drug treatment. Other proteins are colored in gray. Representative subtype-risk proteins are marked. All P values were calculated by unpaired two-sided Student’s t-test. *P < 0.05, **P < 0.01, ***P < 0.001, ns, not significant. c Schematic of the proteomic analyses of esophageal cancer (EC). A large-scale, high-resolution mass spectrometry-based proteomic and phosphoproteomics profiling of paired non-tumor and esophageal cancer samples was reported. Genomic information and tissue arrays were integrated with the proteomic data for proteogenomic analysis, proteomic subtype definition, diagnostic/prognostic model construction, drug prediction, and validation. The analysis defined subtypes and subtype signature of EC, and provided molecular basis for finding potential treatments for EC.

References

    1. Bray F, et al. Global cancer statistics 2018: GLOBOCAN estimates of incidence and mortality worldwide for 36 cancers in 185 countries. Cancer J. Clin. 2018;68:394–424. doi: 10.3322/caac.21492. - DOI - PubMed
    1. Chen W, et al. Cancer statistics in China, 2015. Cancer J. Clin. 2016;66:115–132. doi: 10.3322/caac.21338. - DOI - PubMed
    1. Pennathur A, Gibson MK, Jobe BA, Luketich JD. Oesophageal carcinoma. Lancet. 2013;381:400–412. doi: 10.1016/S0140-6736(12)60643-6. - DOI - PubMed
    1. Song Y, et al. Identification of genomic alterations in oesophageal squamous cell cancer. Nature. 2014;509:91–95. doi: 10.1038/nature13176. - DOI - PubMed
    1. Lin DC, et al. Genomic and molecular characterization of esophageal squamous cell carcinoma. Nat. Genet. 2014;46:467–473. doi: 10.1038/ng.2935. - DOI - PMC - PubMed

Publication types