. 2021 Aug 16;11(1):16539.
doi: 10.1038/s41598-021-95930-7.

Exploring rare cellular activity in more than one million cells by a transscale scope

Affiliations

Exploring rare cellular activity in more than one million cells by a transscale scope

T Ichimura et al. Sci Rep. .

Abstract

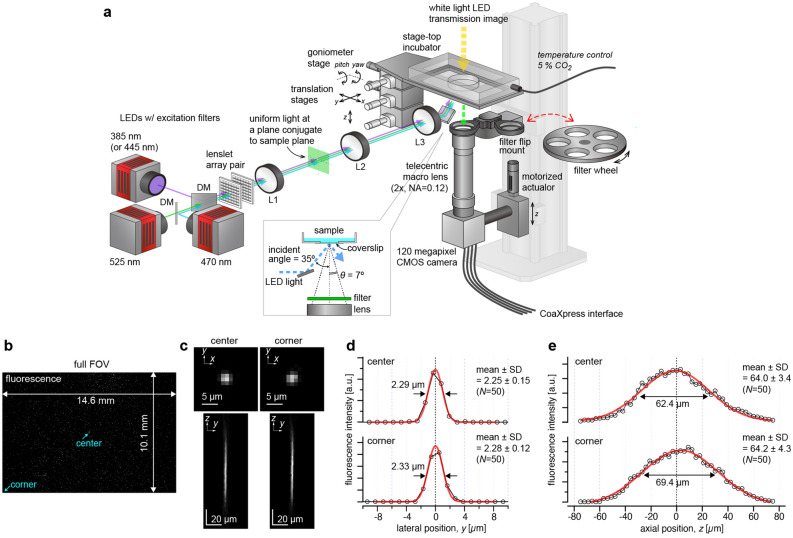
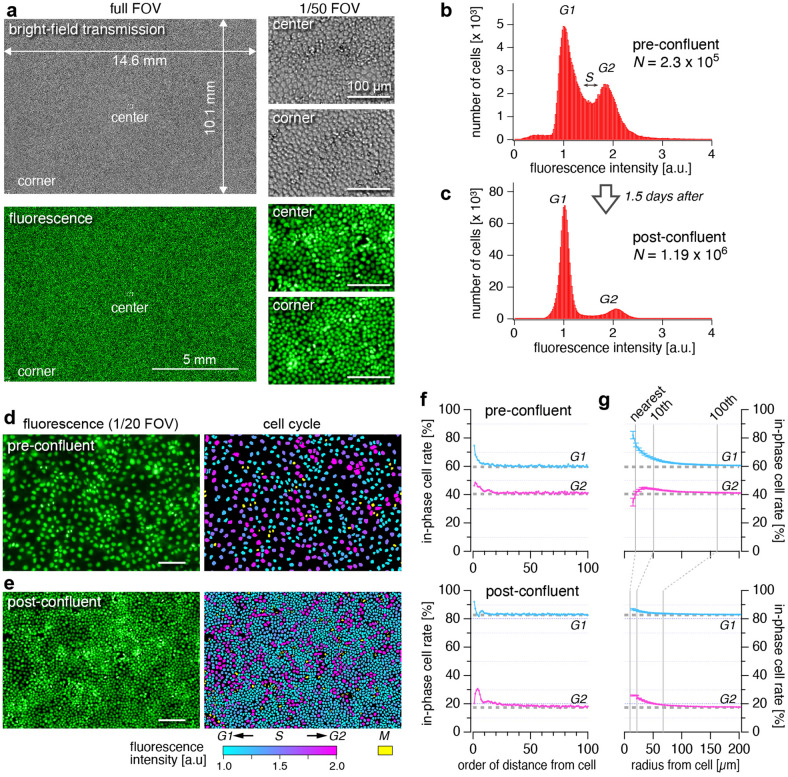
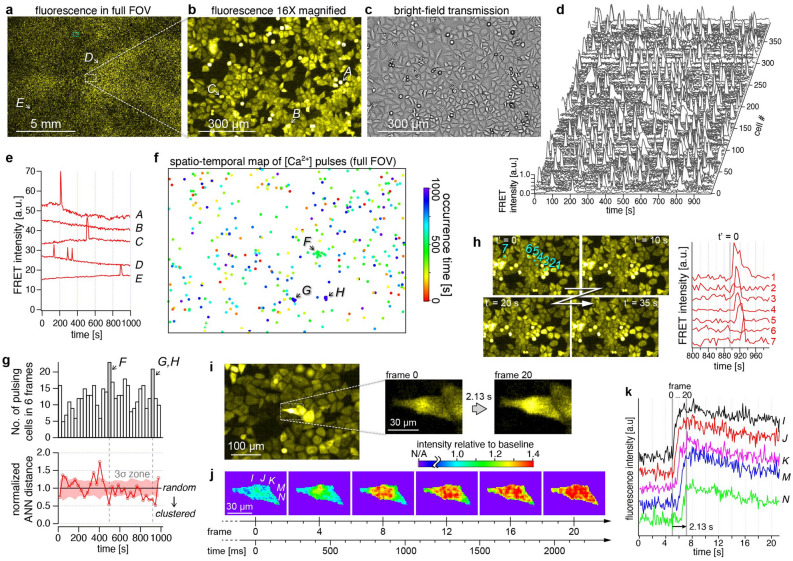
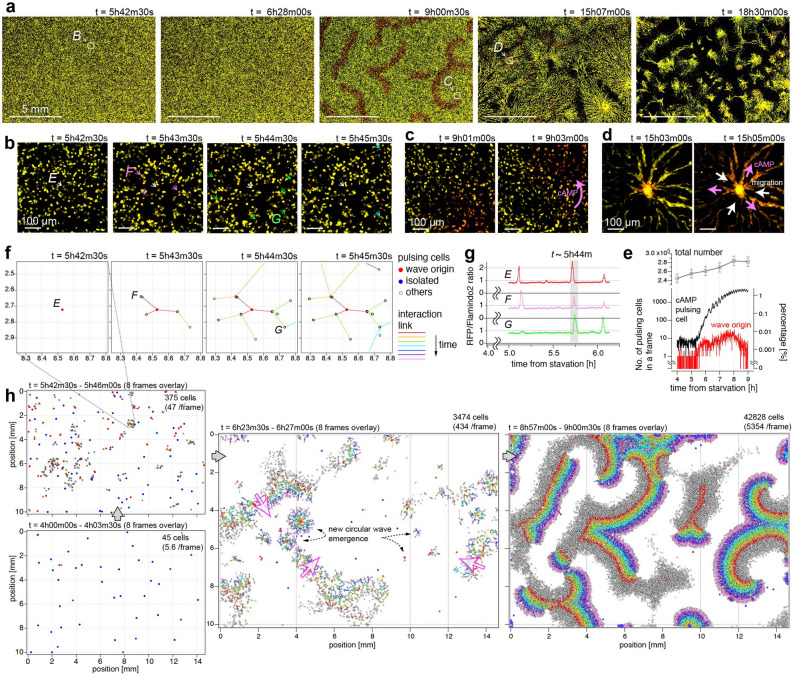
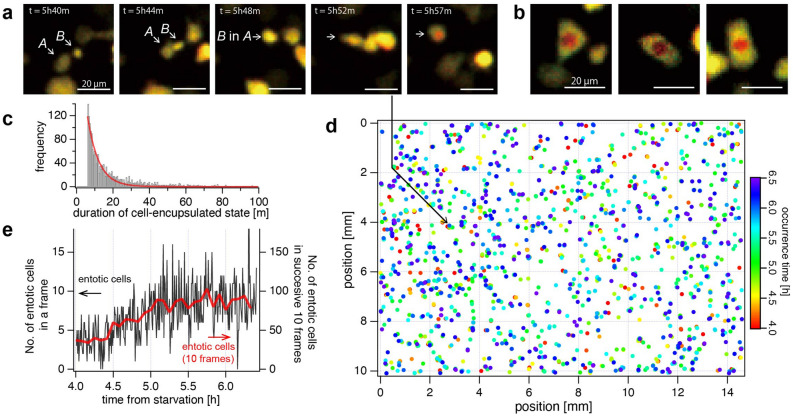
In many phenomena of biological systems, not a majority, but a minority of cells act on the entire multicellular system causing drastic changes in the system properties. To understand the mechanisms underlying such phenomena, it is essential to observe the spatiotemporal dynamics of a huge population of cells at sub-cellular resolution, which is difficult with conventional tools such as microscopy and flow cytometry. Here, we describe an imaging system named AMATERAS that enables optical imaging with an over-one-centimeter field-of-view and a-few-micrometer spatial resolution. This trans-scale-scope has a simple configuration, composed of a low-power lens for machine vision and a hundred-megapixel image sensor. We demonstrated its high cell-throughput, capable of simultaneously observing more than one million cells. We applied it to dynamic imaging of calcium ions in HeLa cells and cyclic-adenosine-monophosphate in Dictyostelium discoideum, and successfully detected less than 0.01% of rare cells and observed multicellular events induced by these cells.


Conflict of interest statement

The authors declare no competing interests.

Figures

Figure 1
Figure 1
Configuration and performance of the trans-scale imaging system AMATERAS1.0. (a) Schematic representation of the system configuration. See “Methods” for detail. (be) Evaluation of the imaging performance with fluorescent beads of 200 nm in diameter dispersed on a glass-bottom dish. The central wavelength of LED-excitation was 470 nm, and the emission peak wavelength was 520 nm. (b) An image captured with full FOV. (c) Representative images of individual beads in a transverse plane (xy plane) and a longitudinal plane (yz plane) at the center and the corner of the FOV (indicated by light-blue arrows in b), which can be regarded as PSF. The yz plane image is a longitudinal cross-section of an image-stack obtained by scanning the sample-lens distance in the z-direction. (d) Line profiles depicting the fluorescence intensities on the y-axis at the in-focus plane (c, top), shown with black circles. (e) Line profiles depicting the fluorescence intensities on the z-axis penetrating the center of the PSF (c, bottom), shown with black circles. The red lines in (de) represent a Gauss function curve fit to the experimental data.
Figure 2
Figure 2
Imaging of mouse brain slice. Multi-color image of a mouse brain slice with a thickness of 25 µm. Two regions indicated by light-blue squares, namely, cerebral cortex (A) and hippocampus (B), in the whole brain image (left) are magnified by fivefold (middle). The local regions of light-blue squares in the 5 × images are further magnified by fivefold (right). Red, green, and blue represent the fluorescence intensity of tdTomato expressed in excitatory projection neurons, EGFP expressed in inhibitory interneurons, and Hoechst 33342 attached to nuclear DNA, respectively. The three color-channels were excited by the use of three LED wavelengths (center wavelengths: 525 nm, 470 nm, 385 nm) with an exposure time of two seconds for each channel.
Figure 3
Figure 3
Single shot detection and analysis of more than one million cells. Imaging of the cultured MDCK cells that were fixed with paraformaldehyde and stained with NucleoSeeing was performed with an excitation LED wavelength of 470 nm. (a) Full FOV image and closeup images of the area covering 1/50 of the FOV region at the center and corner, obtained with the bright-field transmission (top three) and fluorescence (bottom three) modes. (b,c) Histograms of fluorescence intensity of cells with two different cell densities (b: pre-confluent, c: post-confluent), which correspond to the populations of cells in the G1, S and G2 phases. The fluorescence intensity was normalized by the peak position for the G1 phase. (d,e) Closeup views of areas comprising 1/20 of the FOV region obtained at the pre-confluent condition (d) and the post-confluent condition (e). In the right panels, nuclei of interphase cells are painted with colors indicating fluorescence intensities of the cells, with each color corresponding to different phases of the cell cycle, i.e., cyan and magenta represent the G1 and G2 phases, respectively. Nuclei of the M phase cells are painted with yellow. Scale bars: 100 µm. (f,g) Spatial analysis of the cells in the two phases. (f) In-phase cell rate of neighboring cells as a function of order of cell-cell distance (G1: cyan, G2: magenta). (g) In-phase cell rate among the cells in the neighboring area was plotted as a function of the radius of the area (G1: cyan, G2: magenta). The error bars represent standard errors. The dashed gray lines in f and g represent the expected values for random distribution.
Figure 4
Figure 4
Rare event detection by calcium ion imaging in HeLa cells. (a,b) Fluorescence intensity image of the FRET channel in (a) the full FOV, and (b) a 16 × magnified image of the dashed square region indicated in (a). (c) Bright-field image of the region described in (b). (d) Temporal profiles of FRET channel intensity of 394 detected cells exhibiting spontaneous calcium pulse. (e) Temporal profiles of FRET channel intensity of five cells indicated with alphabets A-E in (a) and (b), including those exhibiting 1 and 3 peaks of spontaneous [Ca2+] pulses (A, C-E) and one with no peak (B). Images were acquired at 5-s intervals. (f) A plot of all cell positions detected in the 1000-s measurement time. The occurrence time is indicated with red-green-blue color. (g) Time variation of the number of pulsing cells in the full FOV (top) and normalized average nearest neighbor (ANN) distance (bottom). The time bin width of the histogram is 6 frames (= 30 s). The light-red shade represents three times the width of the standard deviation. (h) Four image frames showing the [Ca2+] propagation at the location g, along with a part of temporal profiles of the seven cells numbered 1–7. (i,j) Intracellular propagation of [Ca2+] observed at 9.4 fps. (i) A raw image in the region indicated with a dashed light-blue square in (a), with the closeups just before and after the [Ca2+] increase. (j) Emergence and propagation of [Ca2+] within a cell displayed with an intensity relative to the baselines of temporal profiles at each pixel. (k) Temporal profiles with offsets at five positions indicated with I-N in the left panel of (j). Power densities for the imaging with 5-s intervals (dh) and with 9.4 fps (ik) were 25.8 mW/cm2 and 40.8 mW/cm2, respectively.
Figure 5
Figure 5
Rare-cell-triggered macroscale pattern formation of D. discoideum on a centimeter scale. The D. discoideum cells express two fluorescent proteins, namely, Flamindo2 and mRFP, which are sensitive and insensitive to [cAMP], respectively. Images were recorded every 30 s over 16 h after 4 h following cellular starvation (t = 0h00m). Light power densities of 470 nm and 525 nm were 13.4 mW/cm2 and 15.4 mW/cm2, respectively. (a) Evolution of macroscale pattern on a large time scale. The images are shown in 8bit-RGB, in which the green and red colors reflect the intensity of Flamindo2 and mRFP, respectively. The color scales were adjusted so that the cell color changed from yellow to red upon an increase in the [cAMP] from low to high. The time counters indicate the time conceded since the starvation. (bd) Closeups of three locations indicated by dashed squares in (a) at the three time-regions; region B at t ~ 5h42m (b), C at t ~ 9h01m (c) and D at t ~ 15h03m (d). (b) The central cell, denoted with a white arrow, originated a [cAMP] wave, which propagated to several cells denoted with pink, green, and light-blue arrows. (cd) Propagation of [cAMP] and cell migration are indicated with pink and white arrows, respectively. (e) Time evolution of the number of pulsing cells (black), cells working as wave origins (red), all cells (gray). Their percentage in total cells are represented by the right axis. (f) Distribution of auto-detected cell positions with tree-network diagram of [cAMP] propagation at the same location and frames as (b). (g) Temporal profiles of the fluorescence intensity ratio (mRFP/Flamindo2) of the three cells marked with EG in (f). (h) Scatter plots of cell positions across 8 successive frames with their tree-network diagram in the full FOV at four time-regions.
Figure 6
Figure 6
Detection and analysis of entotic event of D. discoideum. Entotic events were detected in the same image-set as Fig. 5 from 1st to 300th frame (t = 4h00m–6h29m30s). (a) An example of entotic event observed from 5h40m to 5h57m. The larger cell marked with A came into contact with the smaller cell marked with B, and the two cells have unified at t = 5h48m. Within the next ten minutes, the inside of the unified cell turned red. (b) Three examples of the typical color appearance of entotic cells. (c) Histogram of the time duration of “red-cell”-encapsulated state. (d) Spatiotemporal distribution of the occurrence of detected entotic events in the entire FOV. The Rainbow color table represents the time of occurrence. (e) The temporal evolution of the number of entotic events detected in each frame (black line) and in successive 10 frames (red line).

References

    1. Sun YC, Sun XF, Dyce PW, Shen W, Chen H. The role of germ cell loss during primordial follicle assembly: A review of current advances. Int. J. Biol. Sci. 2017;13:449–457. doi: 10.7150/ijbs.18836. - DOI - PMC - PubMed
    1. Wenzel M, Hamm JP, Peterka DS, Yuste R. Acute focal seizures start as local synchronizations of neuronal ensembles. J. Neurosci. 2019;39:8562–8575. doi: 10.1523/JNEUROSCI.3176-18.2019. - DOI - PMC - PubMed
    1. Goedert M, Spillantini MG. Propagation of Tau aggregates Tim Bliss. Mol. Brain. 2017;10:18. doi: 10.1186/s13041-017-0298-7. - DOI - PMC - PubMed
    1. Paterlini-Brechot P, Benali NL. Circulating tumor cells (CTC) detection: Clinical impact and future directions. Cancer Lett. 2007;253:180–204. doi: 10.1016/j.canlet.2006.12.014. - DOI - PubMed
    1. Proserpio V, Lönnberg T. Single-cell technologies are revolutionizing the approach to rare cells. Immunol. Cell Biol. 2016;94:225–229. doi: 10.1038/icb.2015.106. - DOI - PMC - PubMed

Publication types

MeSH terms