. 2021 Aug 16;4(1):968.
doi: 10.1038/s42003-021-02494-3.

Early alterations of large-scale brain networks temporal dynamics in young children with autism

Affiliations

Early alterations of large-scale brain networks temporal dynamics in young children with autism

Aurélie Bochet et al. Commun Biol. .

Abstract

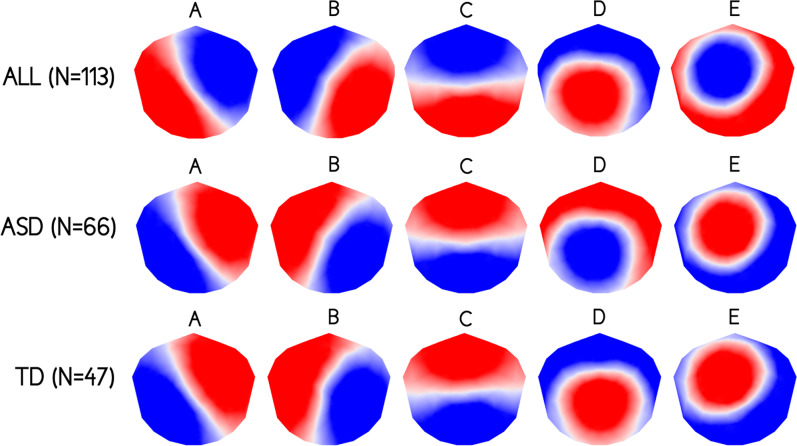
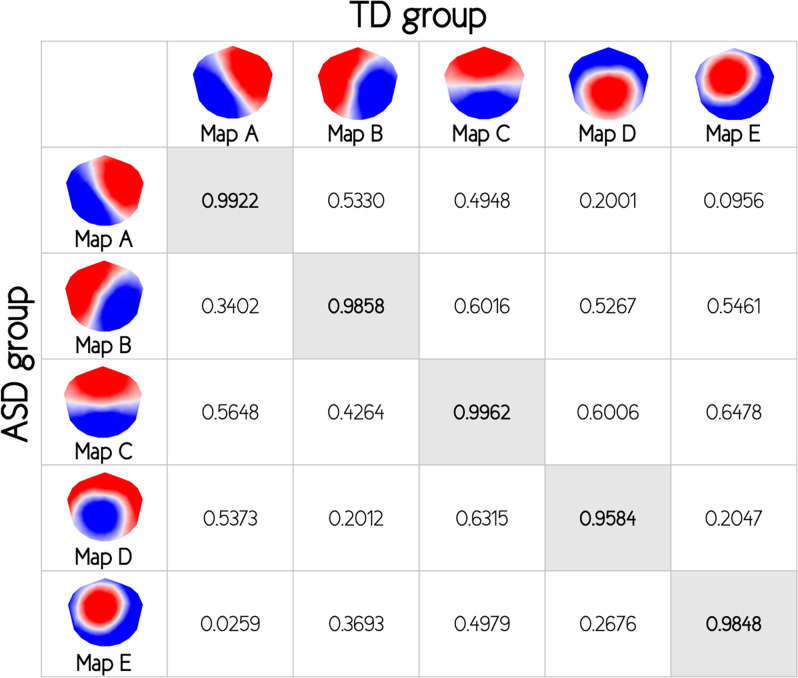
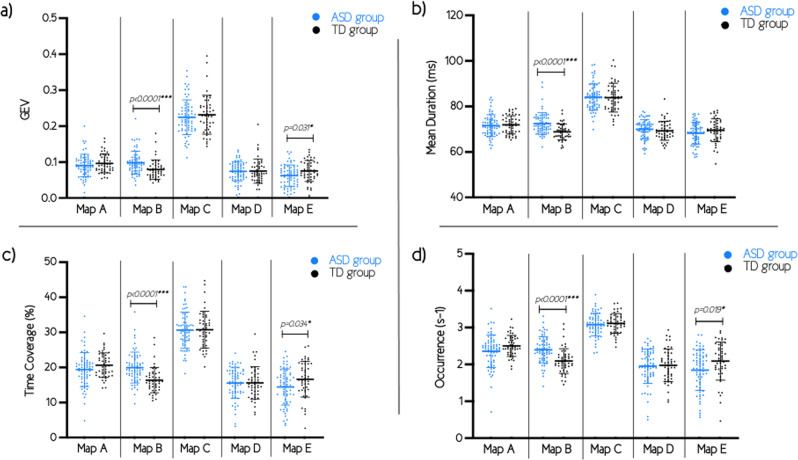
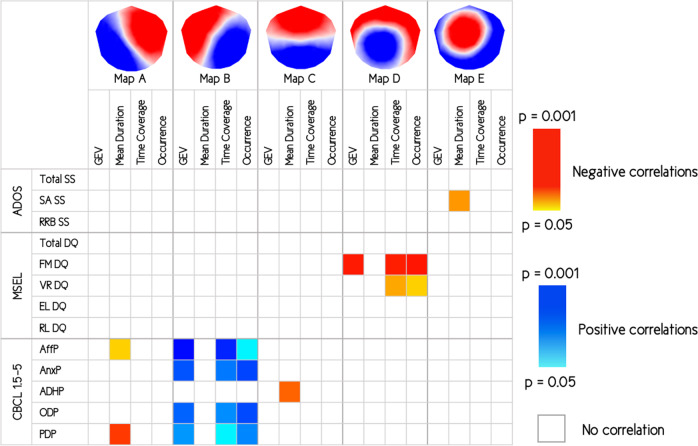
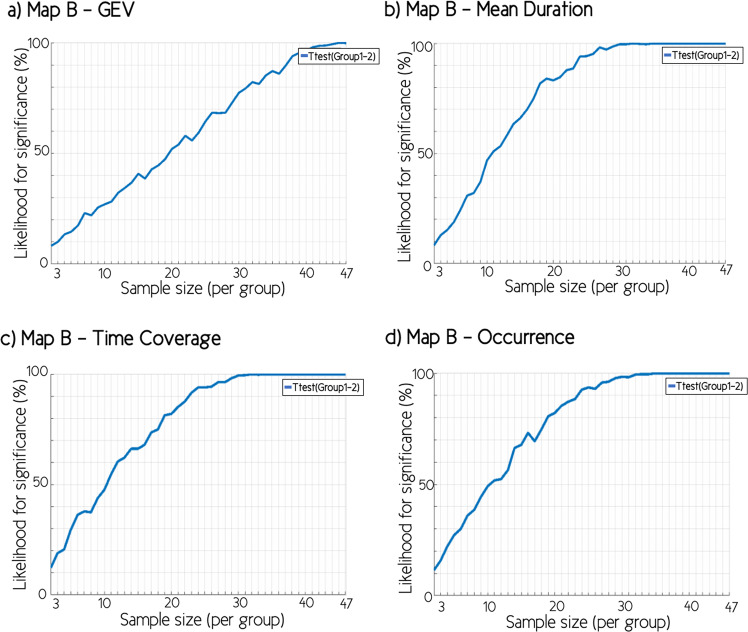
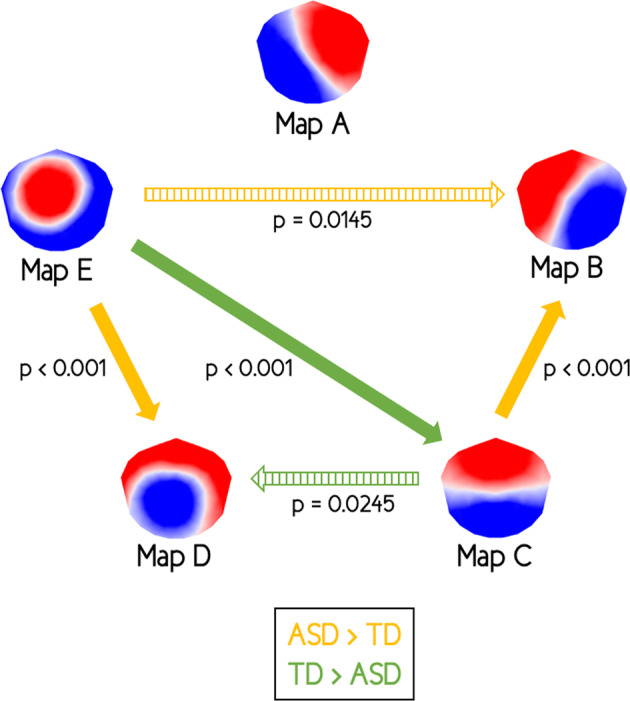
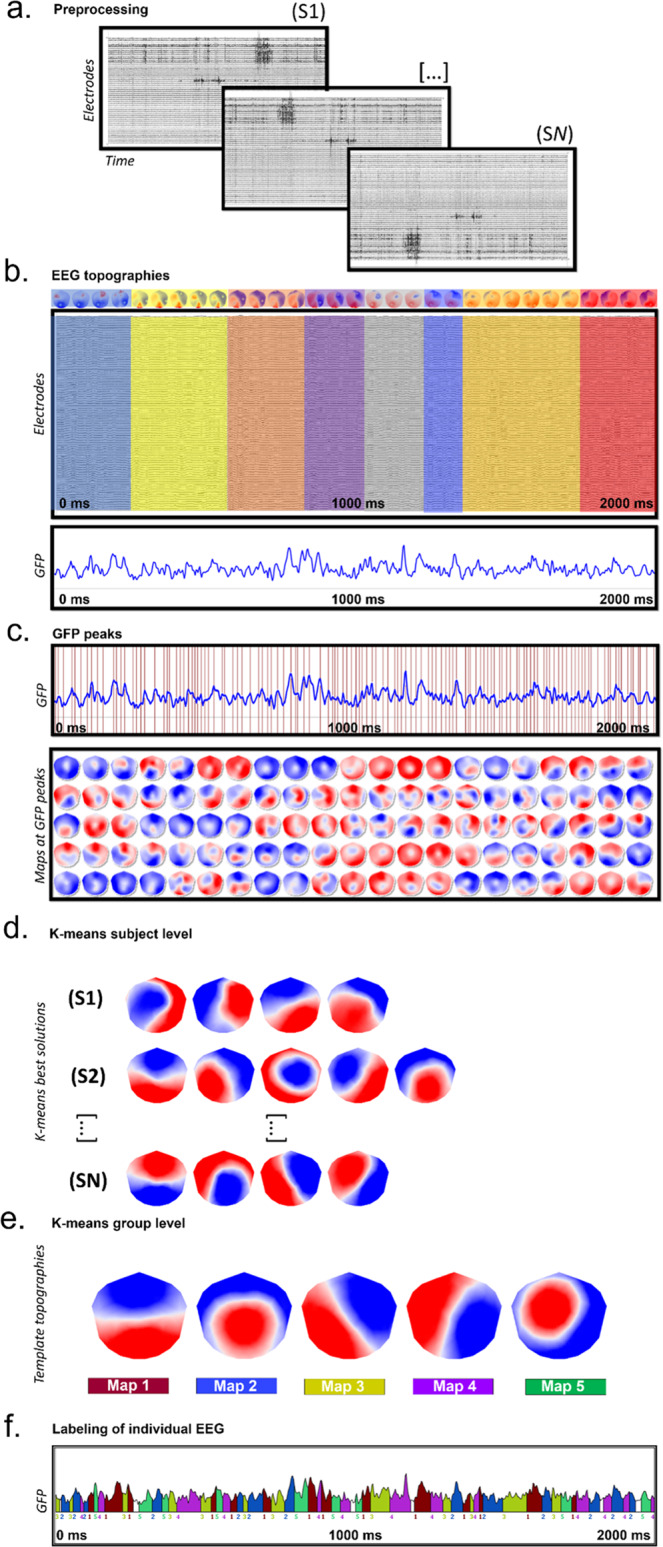
Autism spectrum disorders (ASD) are associated with disruption of large-scale brain network. Recently, we found that directed functional connectivity alterations of social brain networks are a core component of atypical brain development at early developmental stages in ASD. Here, we investigated the spatio-temporal dynamics of whole-brain neuronal networks at a subsecond scale in 113 toddlers and preschoolers (66 with ASD) using an EEG microstate approach. We first determined the predominant microstates using established clustering methods. We identified five predominant microstate (labeled as microstate classes A-E) with significant differences in the temporal dynamics of microstate class B between the groups in terms of increased appearance and prolonged duration. Using Markov chains, we found differences in the dynamic syntax between several maps in toddlers and preschoolers with ASD compared to their TD peers. Finally, exploratory analysis of brain-behavioral relationships within the ASD group suggested that the temporal dynamics of some maps were related to conditions comorbid to ASD during early developmental stages.


Conflict of interest statement

The authors declare no competing interests.

Figures

Fig. 1
Fig. 1. Microstate topographies.
The five microstate topographies identified in the global clustering across all subjects (N = 113), the autism spectrum disorders (ASD) group (N = 66), and the typically developing (TD) group (N = 47). Polarity of microstate topographies is not relevant meaning that topographies with opposite polarity are considered as the same microstate.
Fig. 2
Fig. 2. Spatial correlations between template maps.
Values of Pearson’s spatial correlations coefficients between the 5 template maps of both autism spectrum disorders (ASD) and typically developing (TD) groups.
Fig. 3
Fig. 3. Temporal parameters of the microstates.
Results of both autism spectrum disorders (ASD) and typically developing (TD) groups for the temporal parameters: a global explained variance (GEV); b mean duration; c time coverage; and d occurrence. Error bars represent means and standard deviations. Uncorrected p-values. ***p-values that survive false discovery rate (FDR) correction for multiple comparisons.
Fig. 4
Fig. 4. Correlations with clinical measures.
Matrix of exploratory correlations with clinical measures within autism spectrum disorders (ASD) group. Uncorrected p-values. ADOS = Autism Diagnostic Observation Schedule; SS = severity score; SA = social affect; RRB = repetitive and restricted behaviors; MSEL = Mullen Scales of Early Learning; DQ = developmental quotient; FM = fine motor; VR = visual reception; EL = expressive language; RL = receptive language; CBCL = Child Behavior Checklist; AffP = affective problems; AnxP = anxiety problems; ADHP = attention deficit/hyperactivity problems; ODP = oppositional defiant problems; PDP = pervasive developmental problems.
Fig. 5
Fig. 5. Bootstrapping analyses.
The likelihood to observe a significant difference between toddlers and preschoolers with autism spectrum disorders (ASD) and their typically developing (TD) peers, simulating sample sizes ranging from 3 to 47 individuals in each group, for parameters of microstate class B: a global explained variance (GEV); b mean duration; c time coverage; and d occurrence.
Fig. 6
Fig. 6. Dynamic syntax results using Markov chains.
Comparison of the transition probabilities between autism spectrum disorders (ASD) group and typically developing (TD) group. Uncorrected p-values. Orange arrows: transition probabilities in ASD group > TD group; green arrows: transition probabilities in TD group > ASD group; full arrows: p-values that survive false discovery rate (FDR) correction for multiple comparisons; hatched arrows: p-values that do not survive to FDR correction.
Fig. 7
Fig. 7. Microstate analysis pipeline.
a Standard preprocessing of all the acquired high-density electroencephalography (EEG) recordings (110 channels). b A 2 s cleaned EEG and its corresponding global field power (GFP). Periods of quasi-stable map topographies (on top) are superimposed on the cleaned EEG and marked in different colors. c For each individual recording, peaks of GFP were determined (red vertical lines) and their specific potential maps were selected and submitted to a k-means clustering procedure (d). The best k-means clustering solutions at the individual level were selected based on the meta-criterion. e The best solutions obtained for each subject in step (d) were submitted altogether to a second k-means group cluster analysis. The meta-criterion identified a best solution with 5 template topographies (microstate classes). f The template topographies obtained in (e) were fitted back to the individual EEG recordings and each time point was labeled with the cluster map having the highest spatial correlation (winner-takes-all). The microstate sequence was used, for each subject, to extract the temporal parameters and statistical analysis.

References

    1. Michel CM, Murray MM. Towards the utilization of EEG as a brain imaging tool. NeuroImage. 2012;61:371–85. doi: 10.1016/j.neuroimage.2011.12.039. - DOI - PubMed
    1. Sperdin HF, et al. Early alterations of social brain networks in young children with autism. eLife. 2018;7:e31670. doi: 10.7554/eLife.31670. - DOI - PMC - PubMed
    1. Adolphs R. The social brain: neural basis of social knowledge. Annu. Rev. Psychol. 2009;60:693–716. doi: 10.1146/annurev.psych.60.110707.163514. - DOI - PMC - PubMed
    1. Brothers L. The social brain: a project for integrating primate behavior and neurophysiology in a new domain. Concepts Neurosci. 1990;1:27–61.
    1. Welsh JP, Estes AM. Exploring the social brain. eLife. 2018;7:e35392. doi: 10.7554/eLife.35392. - DOI - PMC - PubMed

Publication types