. 2021 Aug 16;4(1):967.
doi: 10.1038/s42003-021-02501-7.

Phase separation of Epstein-Barr virus EBNA2 protein reorganizes chromatin topology for epigenetic regulation

Affiliations

Phase separation of Epstein-Barr virus EBNA2 protein reorganizes chromatin topology for epigenetic regulation

Yiting Yang et al. Commun Biol. .

Abstract

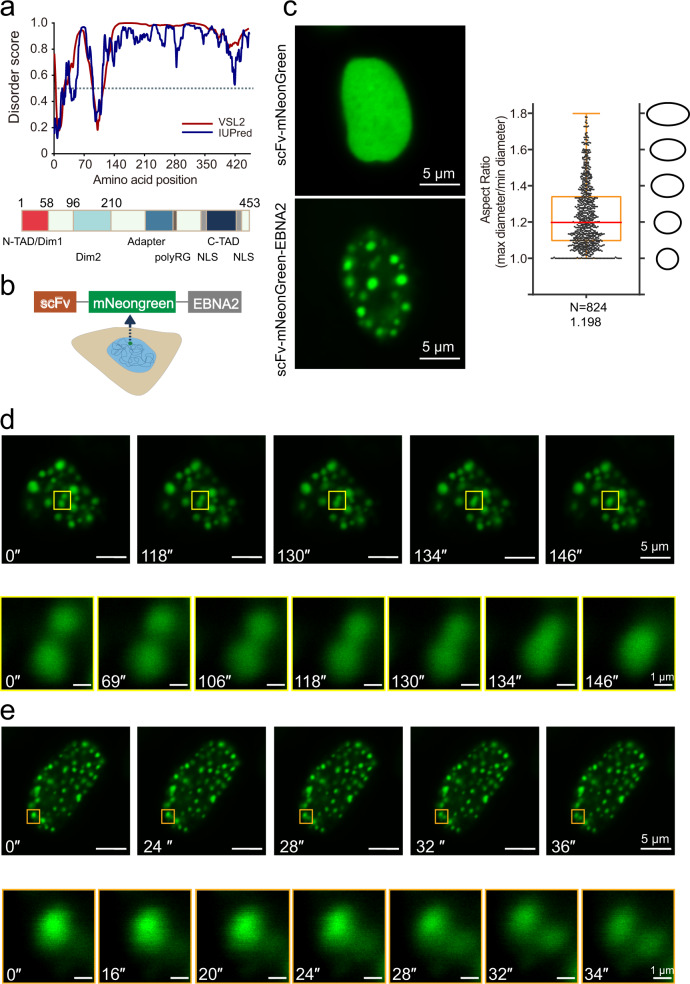
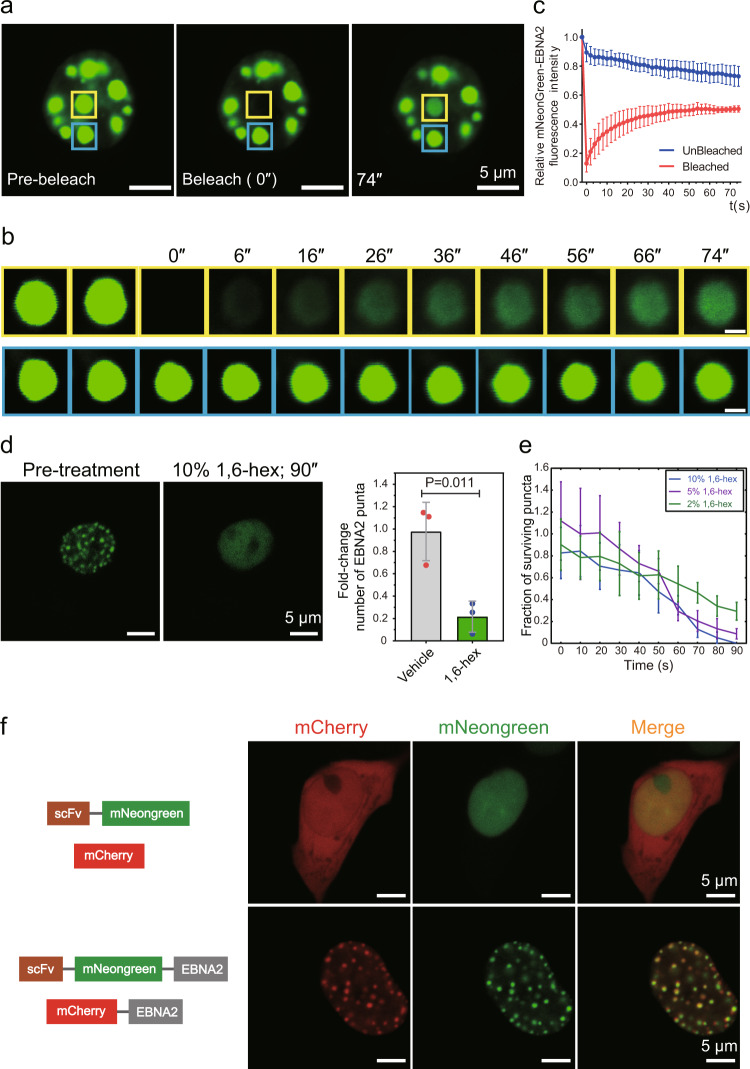
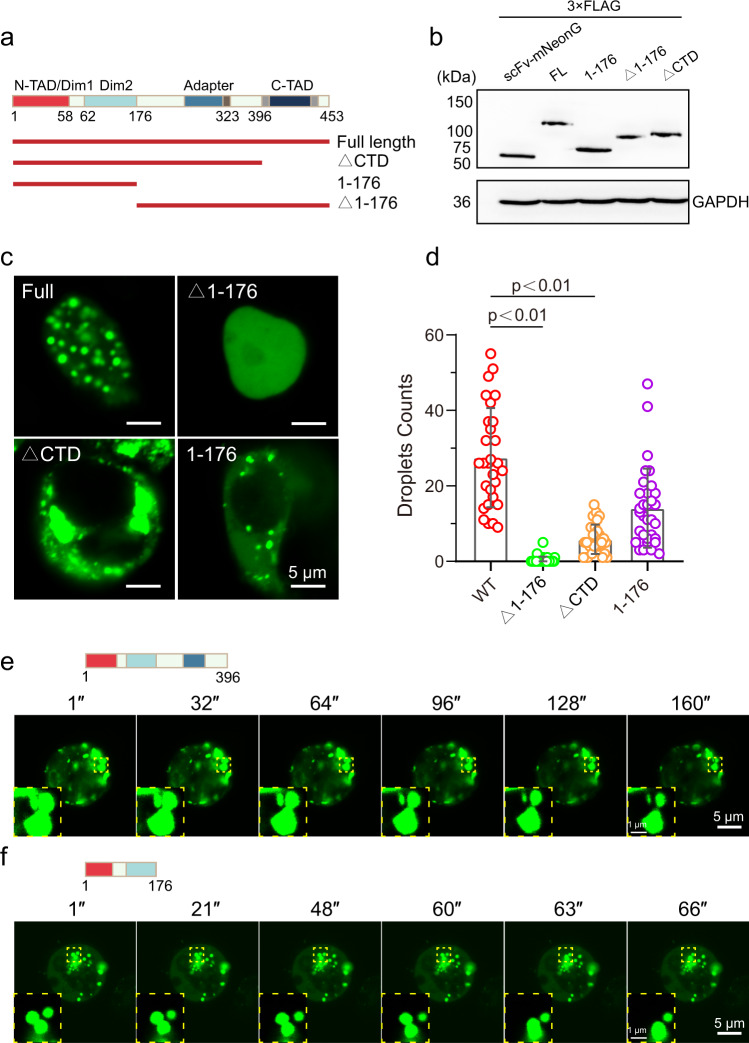
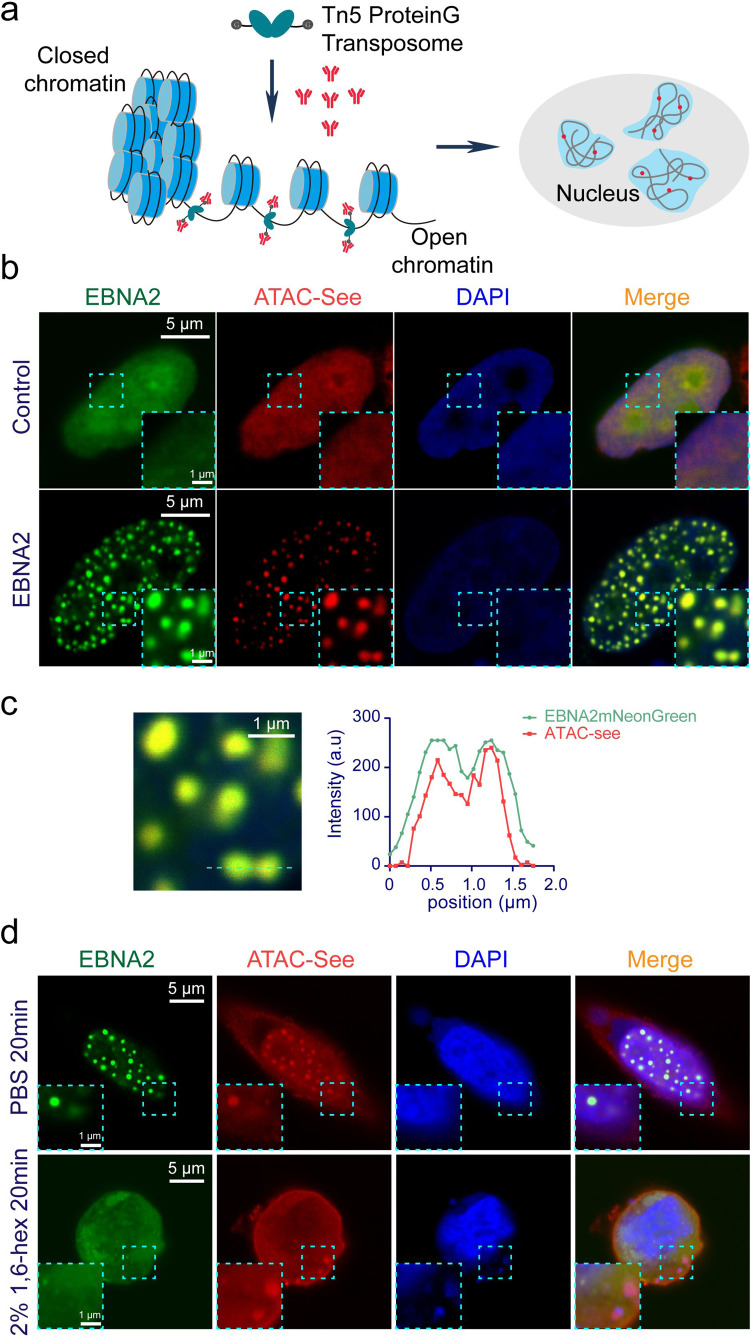
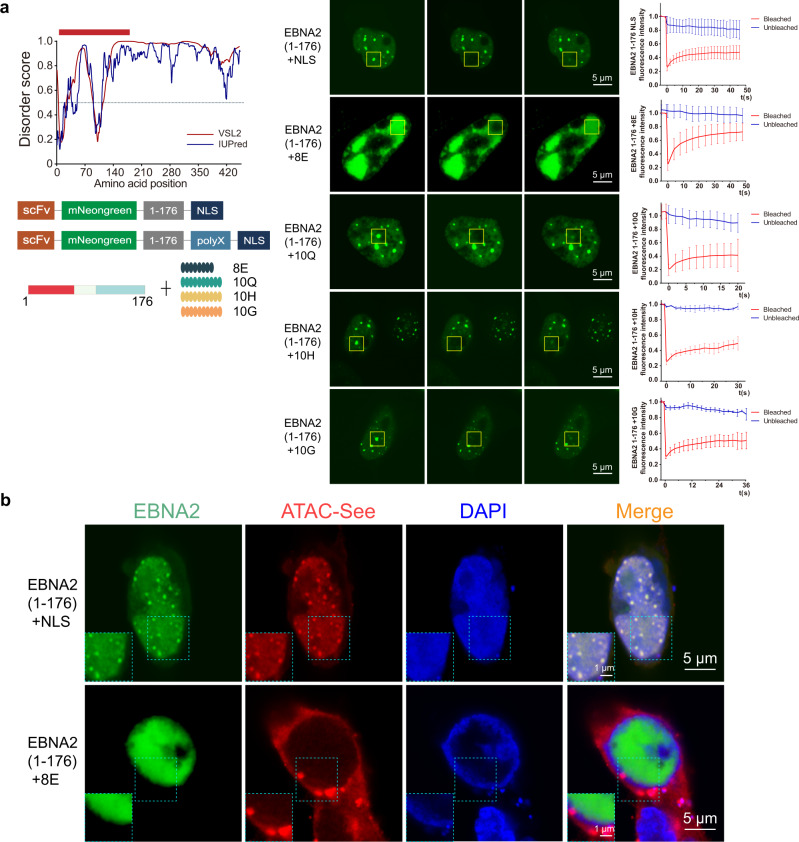
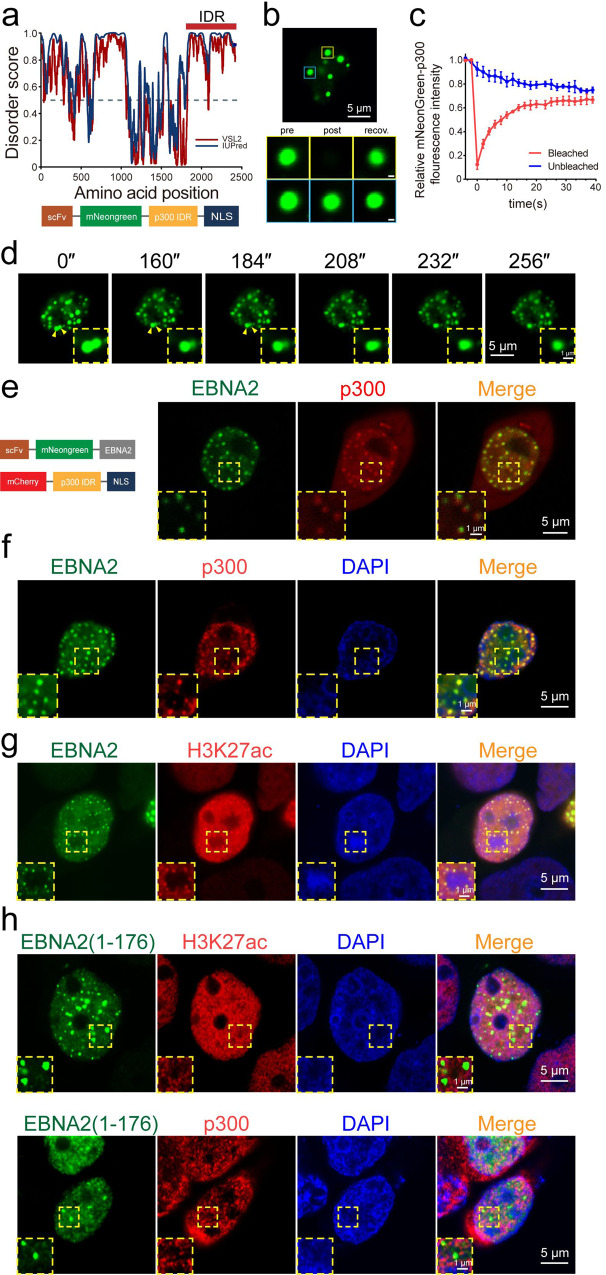
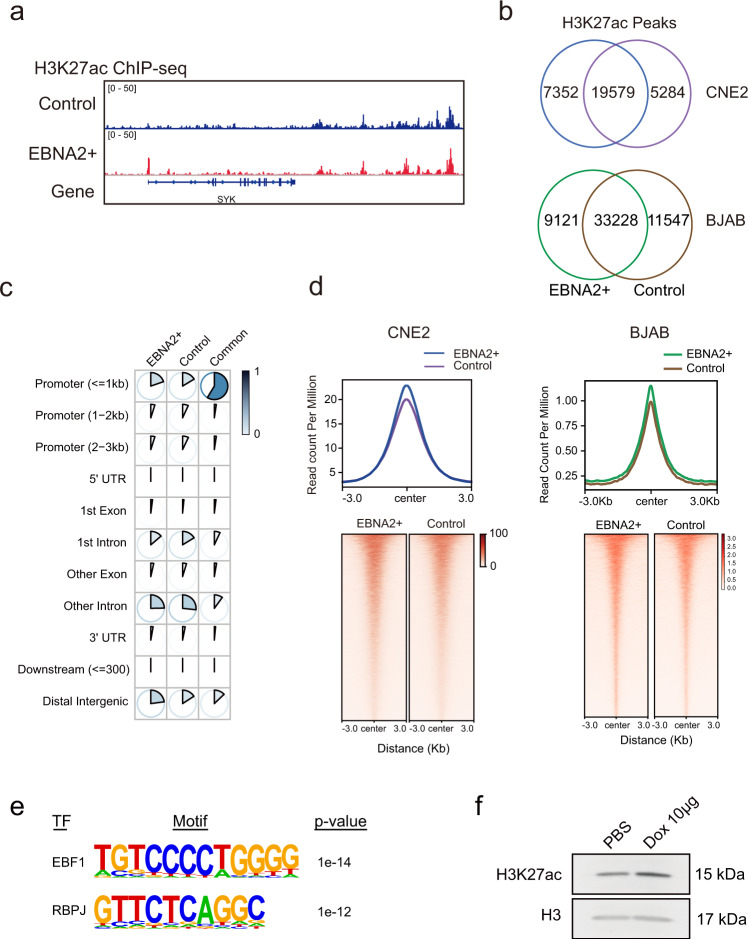
Epstein-Barr virus nuclear antigen 2 (EBNA2) is a transactivator of viral and cellular gene expression, which plays a critical role in the Epstein-Barr virus-associated diseases. It was reported that EBNA2 regulates gene expression by reorganizing chromatin and manipulating epigenetics. Recent studies showed that liquid-liquid phase separation plays an essential role in epigenetic and transcriptional regulation. Here we show that EBNA2 reorganized chromatin topology to form accessible chromatin domains (ACDs) of the host genome by phase separation. The N-terminal region of EBNA2, which is necessary for phase separation, is sufficient to induce ACDs. The C-terminal domain of EBNA2 promotes the acetylation of accessible chromatin regions by recruiting histone acetylase p300 to ACDs. According to these observations, we proposed a model of EBNA2 reorganizing chromatin topology for its acetylation through phase separation to explain the mechanism of EBNA2 hijacking the host genome by controlling its epigenetics.


Conflict of interest statement

The authors declare no competing interests.

Figures

Fig. 1
Fig. 1. EBNA2 forms liquid-like puncta in the nucleus.
a Disorder sequence analysis of EBNA2 protein (top) using the algorithms IUPred (blue) and VSL2 (magenta). IUPred and VSL2 scores are shown on the y axis, and amino acid positions are shown on the x-axis. The dotted line indicates 0.5 disordered score. The diagram below shows the domains and motifs of EBNA2 protein: N-TAD N-terminal transactivation domain; C-TAD C-terminal transactivation domain; Dim1 and Dim2 dimerization motif 1 and 2; NLS nuclear localization signal; and adapter region. b Schematic representation for the scFv- mNeonGreen-EBNA2 plasmid. c Live imaging of HEK 293T cells transfected with scFv- mNeonGreen-EBNA2 and scFv mNeongreen plasmids (left). Box plots showing the distribution of aspect ratios for droplets of mNeonGreen-EBNA2 (right). The numbers of droplets examined and the mean aspect ratios are shown. Box plot represents min to max. d, e Time-lapse images of the nucleus of a HEK 293T cell transiently transfected scFv-mNeongreen-EBNA2 subjected to laser excitation every 4 s for the times indicated. A droplet fusion and fission event occur respectively in the region highlighted by the yellow (d) and orange box (e).
Fig. 2
Fig. 2. EBNA2 undergoes phase separation in host cells.
a Image and b time-lapse and close-up view of a mNeonGreen EBNA2 droplet (yellow box) before (left), during (middle), and after (right) photobleaching. The blue box highlights an unbleached region for comparison. Time relative to photobleaching (0 s) indicated. Scale bars, 1 μm (b). c Quantification of FRAP for mNeonGreen-EBNA2 puncta. The bleaching event occurs at t = 0 s. For the bleached area and the unbleached control, background-subtracted fluorescence intensities are plotted relative to a prebleach time point (t = −2 s). Data are plotted as mean + SD (n = 3). d Representative images of mNeonGreen-EBNA2 before and after treatment with 10% 1,6-hexanediol for 90 s (left). The fold change of the number of mNeonGreen-EBNA2 puncta observed after the addition of 1,6-hexanediol to the final concentration of 10% (right). e Number of nuclear puncta formed by mNeonGreen-EBNA2 surviving over time upon addition of 1,6-hexanediol at different concentrations. Error bars represent SE. f Schematic representation of recombinant mNeonGreen/mCherry fusion proteins used in this experiment (left). The mNeonGreen-EBNA2, mCherry-EBNA2, mNeonGreen, and mCherry plasmids were transiently transfected into 293T cells. Double immunofluorescence revealed co-localization of mNeonGreen-EBNA2 and mCherry-EBNA2 proteins in HEK 293T cells (right).
Fig. 3
Fig. 3. The N-terminal of EBNA2 is necessary for phase separation.
a Diagram of the Full length and truncated EBNA2. b Western blot of scFv-mNeonGreen protein, and full length and truncates of scFv-mNeonGreen EBNA2 protein. c Immunofluorescence images of the truncated EBNA2 in HEK 293 T cells (left). d The droplet counts per area of the mNeonGreen-truncated-EBNA2. Error bars represent SD. e, f Time-lapse images of both mNeonGreen-EBNA2(1-396) and mNeonGreen-EBNA2(1-176). Zoom in shows two truncated EBNA2 fusion events. Scale bars, 5 μm, and zoom in 1 μm.
Fig. 4
Fig. 4. EBNA2 reorganized chromatin topology to form accessible chromatin domains.
a The modified ATAC-see schematic diagram. The protein G-fused Tn5 adapter transposase (pG-Tn5) forms the active transposome complex in vitro. The cells were fixed, permeabilized, and the accessible sites were labeled with the pG-Tn5 transposome. The pG-Tn5 was stained with rabbit-derived IgG DyLightTM 549 conjugated antibody. b Representative images show the colocalization of the accessible chromatin domains and mNeonGreen-EBNA2 condensates. The experiment was repeated three times independently. Scale bars, 5 μm. Magnified regions, scale bars, 1 μm. c Magnification of the box region (left) in (b) and line plot of the dotted line in the magnified image (right). Scale bars, 1 μm. d Representative images show the colocalization of the accessible chromatin domains and EBNA2 condensates after treatment with PBS or 2% 1,6-hex for 20 min. The experiment was repeated three times independently. Scale bars, 5 μm. Magnified region scale bars, 1 μm.
Fig. 5
Fig. 5. The N-terminal of EBNA2 is necessary and sufficient to induce ACDs.
a Immunofluorescence images of the polyX-modified EBNA2 N-terminal. Graphs plotting intrinsic disorder analysis for EBNA2 and the design of the polyX-modified EBNA2 N-terminal (left). The sequence (amino acid from 1 to 176) cloned for subsequent experiments is highlighted with a red bar. Below is a schematic diagram of the polyX-modified EBNA2 N-terminal. FRAP recovery images of the EBNA2(1-176), EBNA2(1-176) + 8E, EBNA2(1-176) + 10Q, EBNA2(1-176) + 10H, and EBNA2(1-176) + 10G condensates (middle). The yellow box highlights the condensate before, during, and after photobleaching. Data are plotted (right) as SD (n = 3). Scale bars, 5 μm. b Representative images show the colocalization of the accessible chromatin domains and mNeonGreen-EBNA2(1-176) (top) or mNeonGreen-EBNA2(1-176) + 8E (bottom) condensates. The experiment was repeated three times independently with similar results. Scale bars, 5 μm. Magnified regions, scale bars, 1 μm.
Fig. 6
Fig. 6. EBNA2 recruits p300 for histone H3K27 acetylation.
a Disorder analysis of the histone acetyltransferase p300 2415 amino acid (top). The algorithms used were: IUPred (blue) and VSL2 (magenta). The IDR (amino acid from 1851 to 2415) cloned for subsequent experiments is highlighted with a red bar. The schematic below representation of the p300 IDR plasmid. The plasmid consists of the p300 IDR fused to scFv-mNeongreen and NLS. b Live cell images of HEK 293T cells transfected with mNeonGreen-p300-IDR plasmid (top) and a mNeonGreen-p300-IDR droplet (bottom, yellow box) before (left), during (middle), and after (right) photobleaching. The blue box highlights an unbleached region for comparison. Scale bars, 1 μm. c Quantification of FRAP data for mNeonGreen-p300-IDR droplets. The bleaching event occurs at t = 0 s. For the bleached area and the unbleached control, background-subtracted fluorescence intensities are plotted relative to a prebleach time point (t = −4 s). Data are plotted as mean + SD (n = 3). d Example of p300-IDR fusion (yellow arrowheads and magnified regions), scale bars, 5 μm. Magnified regions, scale bars, 1 μm. e Double immunofluorescence imaging revealed co-localization of EBNA2 and p300 IDR in HEK 293T cells. Insets are enlarged areas indicated in the main panel. Scale bars, 5 μm. Magnified region scale bars, 1 μm. f Colocalization between stably expressing EBNA2 and endogenous p300 by Immunofluorescence in HEK 293T cells. Double immunofluorescent staining revealed co-localization of EBNA2 and p300. Insets are enlarged areas indicated in the main panel. The experiment was repeated three times independently with similar results. Scale bars, 50 μm. Magnified regions, scale bars, 5 μm. g Representative immunofluorescence images showing colocalization of mNeonGreen-EBNA2 condensates with H3K27ac foci in HEK 293T cells. The experiment was repeated three times independently with similar results. Scale bars, 5 μm. Magnified regions, scale bars, 1 μm. h Representative immunofluorescence images of HEK 293T cells transfected with mNeonGreen-EBNA2(1-176). The p300 and H3K27ac were stained with the specific antibodies. The experiment was repeated three times independently with similar results. Scale bars, 5 μm (b, d, e, g, h (whole-cell images)), 1 μm (b, d, e, g, h (magnified views of the boxed regions)).
Fig. 7
Fig. 7. ENBA2 promoted the acetylation of the histone H3K27 in genome-wide.
a ChIP-seq tracks of H3K27ac in the Dox-induced EBNA2+ CNE2 cells (blue track) and control CNE2 cells (purple track). b Venn diagram of H3K27ac peaks in the Dox-induced EBNA2+ CNE2 cells (green track) and control CNE2 cells (brown track), EBNA2+ BJAB cells (green track), and control cells (brown track) c Annotation of H3K27ac peaks. EBNA2+: EBNA2+ cell unique peaks, control: control cell unique peaks, common: peaks of overlapped in both cell types. d The plot and heatmap of common peaks in the Dox-induced EBNA2+ cells (blue track) and control cells (purple track), EBNA2+ BJAB cells (green track), and control cells (green track). e Selected transcription factor binding motifs overrepresented in CUT&Tag peaks, the most enriched factor for each family is shown. f Western blot of H3K27ac of the EBNA2-expressing HEK 293T cells treated with 10 μg/mL Doxycycline or vehicle for 24 h. H3 served as a loading control.

References

    1. Taylor GS, Long HM, Brooks JM, Rickinson AB, Hislop AD. The immunology of Epstein-Barr virus-induced disease. Annu. Rev. Immunol. 2015;33:787–821. doi: 10.1146/annurev-immunol-032414-112326. - DOI - PubMed
    1. Kanda T. EBV-encoded latent genes. Adv. Exp. Med. Biol. 2018;1045:377–394. doi: 10.1007/978-981-10-7230-7_17. - DOI - PubMed
    1. Kempkes B, Ling PD. EBNA2 and its coactivator EBNA-LP. Curr. Top. Microbiol. Immunol. 2015;391:35–59. - PubMed
    1. Gordadze AV, Poston D, Ling PD. The EBNA2 polyproline region is dispensable for Epstein-Barr virus-mediated immortalization maintenance. J. Virol. 2002;76:7349–7355. doi: 10.1128/JVI.76.14.7349-7355.2002. - DOI - PMC - PubMed
    1. Zimber-Strobl U, Strobl LJ. EBNA2 and notch signalling in Epstein-Barr virus-mediated immortalization of B lymphocytes. Semin. Cancer Biol. 2001;11:423–434. doi: 10.1006/scbi.2001.0409. - DOI - PubMed

Publication types