. 2021 Oct;24(10):1392-1401.
doi: 10.1038/s41593-021-00896-4. Epub 2021 Aug 16.

Placental endocrine function shapes cerebellar development and social behavior

Affiliations

Placental endocrine function shapes cerebellar development and social behavior

Claire-Marie Vacher et al. Nat Neurosci. 2021 Oct.

Abstract

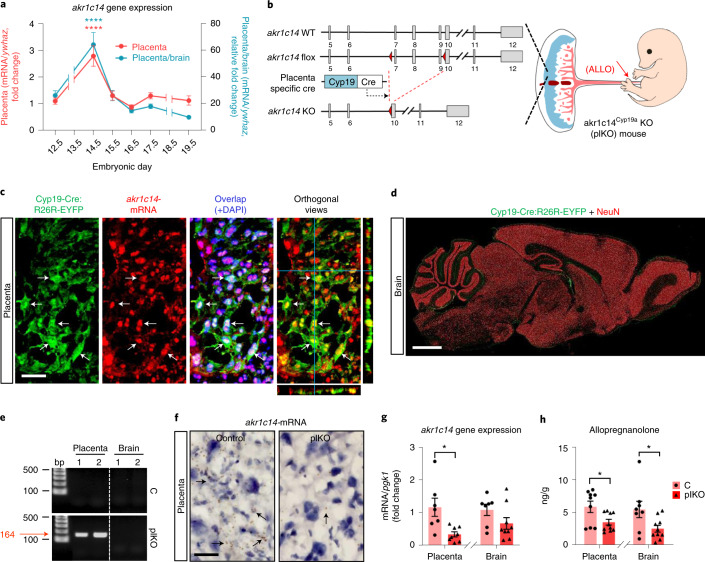
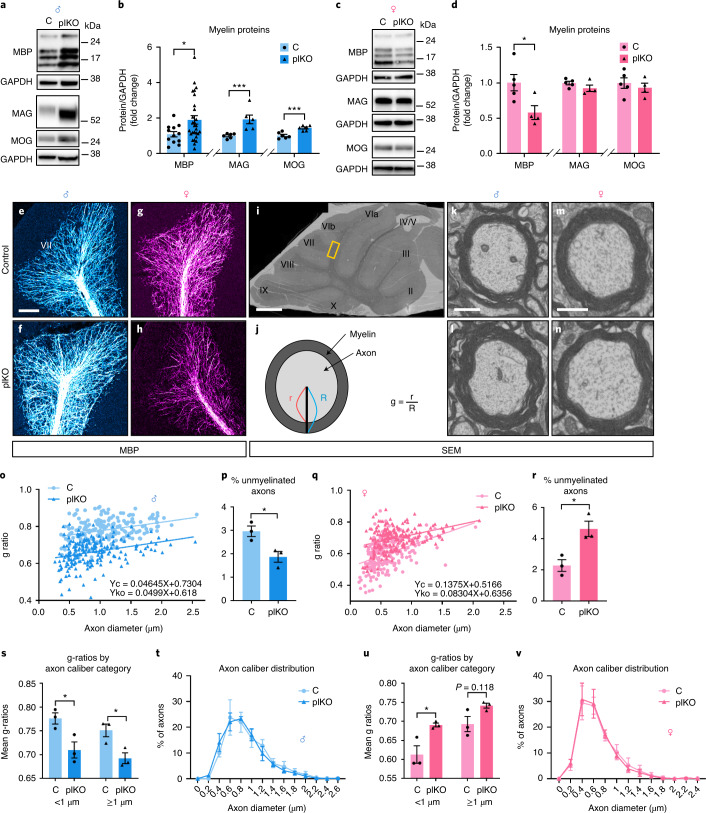
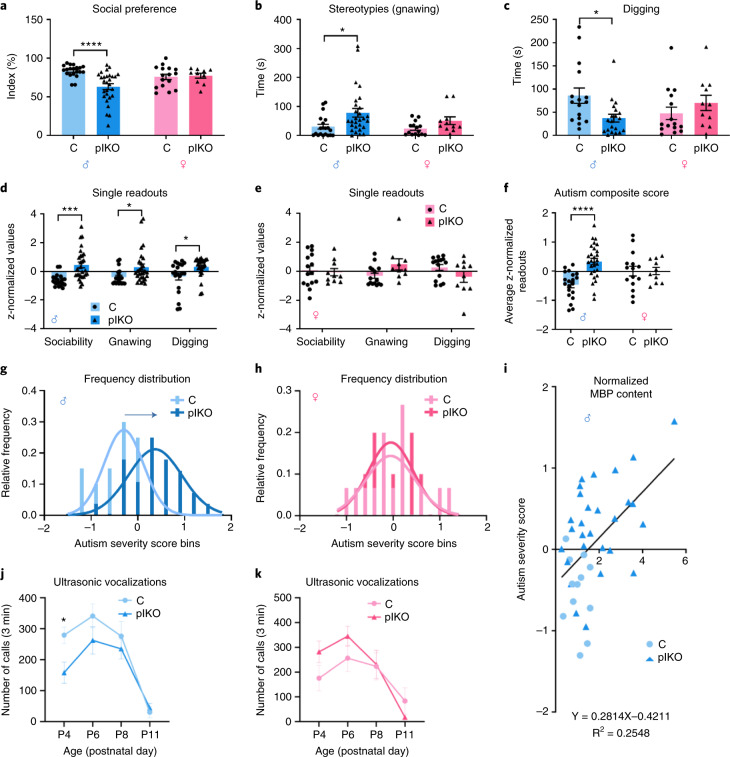
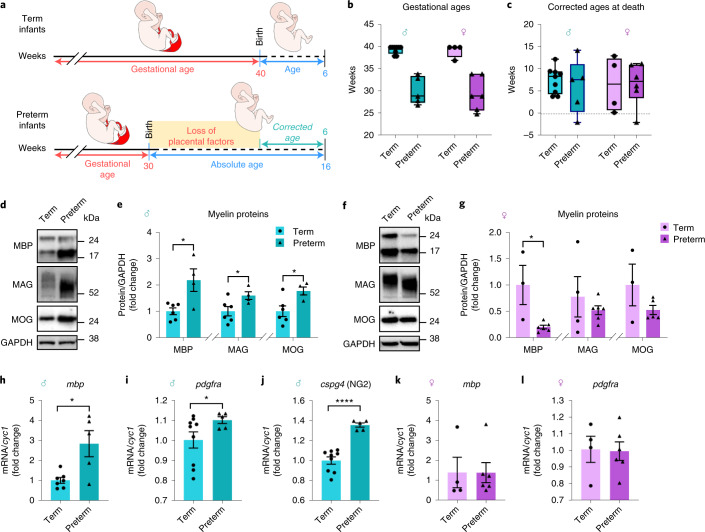
Compromised placental function or premature loss has been linked to diverse neurodevelopmental disorders. Here we show that placenta allopregnanolone (ALLO), a progesterone-derived GABA-A receptor (GABAAR) modulator, reduction alters neurodevelopment in a sex-linked manner. A new conditional mouse model, in which the gene encoding ALLO's synthetic enzyme (akr1c14) is specifically deleted in trophoblasts, directly demonstrated that placental ALLO insufficiency led to cerebellar white matter abnormalities that correlated with autistic-like behavior only in male offspring. A single injection of ALLO or muscimol, a GABAAR agonist, during late gestation abolished these alterations. Comparison of male and female human preterm infant cerebellum also showed sex-linked myelination marker alteration, suggesting similarities between mouse placental ALLO insufficiency and human preterm brain development. This study reveals a new role for a placental hormone in shaping brain regions and behaviors in a sex-linked manner. Placental hormone replacement might offer novel therapeutic opportunities to prevent later neurobehavioral disorders.


Conflict of interest statement

The authors declare no competing financial interests.

Figures

Fig. 1
Fig. 1. Conditional deletion of akr1c14 in Cyp19a-expressing trophoblasts results in reduced ALLO levels in the fetal brain.
a, qRT–PCR for akr1c14 in wild-type (WT) mice. Data presented as mean fold changes ± s.e.m. E12.5: n = 12 C and 12 plKO; E14.5: n = 12 C and 12 plKO; E15.5: n = 10 C and 8 plKO; E16.5: n = 7 C and 7 plKO; E17.5: n = 12 C and 12 plKO; E19.5: n = 12 C and 11 plKO. One-way ANOVA with Dunnett’s multiple comparisons (P < 0.0001 compared to E12.5 value). There was no significant difference between males and females. ywhaz, tyrosine 3-monooxygenase/tryptophan 5-monooxygenase activation protein zeta. b, akr1c14 genetic locus before and after recombination. Exons 7–9 are conditionally targeted. Cyp19a promoter drives expression of Cre in the placenta only. LoxP sites are indicated by red triangles and exons 5–12 by gray boxes. c, In situ hybridization for akr1c14 in placenta from Cyp19a-Cre:R26R-EYFP mice at E17.5. Arrows show co-localizations. Scale bar, 50 µm. d, Sagittal section of a Cyp19a-Cre:R26R-EYFP mouse brain immunostained against YFP (green) and NeuN (red). No Cyp19a promotor activity was evidenced in the brain at P30. Scale bar, 1 mm. e, A 164-bp-long PCR product ascertains the presence of the recombined LoxP site in the placenta of plKO mice. f, In situ hybridization for akr1c14 in the placenta at E17.5. akr1c14-mRNA levels are drastically decreased in the spongiotrophoblasts (arrows) of plKO compared to C mice. Scale bar, 30 µm. g, qRT–PCR for akr1c14 normalized to pgk1 at E17.5. Data are presented as mean ± s.e.m. Two-tailed unpaired t-test with Welch’s correction (*P < 0.05). Placenta: n = 7 C and 8 plKO (P = 0.0247); Brain: n = 8 C and 9 plKO (P = 0.122). Pgk1, phosphoglycerate kinase 1. h, Mass spectrometry ALLO assays at E17.5. Data are presented as mean ± s.e.m. Two-tailed unpaired t-test with Welch’s correction (*P < 0.05). Placenta: n = 9 C and 10 plKO (P = 0.0315); Brain: n = 8 C and 10 plKO (P = 0.0329).
Fig. 2
Fig. 2. Placental ALLO insufficiency results in sex-linked cerebellar WM abnormalities at P30.
a,b, Western blot analysis of myelin-related proteins in the male cerebellum. Data are presented as mean fold changes ± s.e.m. Multiple unpaired t-tests with Holm–Sidak multiple comparison test (*P < 0.05; ***P < 0.005). MBP: n = 12 C and 28 plKO (P = 0.038); MAG: n = 6 C and 6 plKO (P = 0.004); MOG: n = 6 C and 6plKO (P < 0.0001). c,d, Western blot analysis of myelin-related proteins in the female cerebellum. Data are presented as mean fold changes ± s.e.m. Multiple unpaired t-tests with Holm–Sidak multiple comparison test (*P < 0.05). MBP: n = 5 C and 4 plKO (P = 0.031); MAG: n = 5 C and 4 plKO (P = 0.18); MOG: n = 5 C and 4 plKO (P = 0.54). GAPDH, glyceraldehyde 3-phosphate dehydrogenase. eh, Immunofluorescent staining of MBP in cerebellar lobule VII in males (e and f) and females (g and h). Scale bar, 150 μm. i, Scanning electron microscopy acquisition of a whole cerebellum ultrathin section showing the different cerebellar lobules (I–X) in a control mouse (×650 low magnification). The region of interest (inter-lobule VI–VII) for high-magnification acquisitions and g-ratio quantifications is indicated by the yellow rectangle. Scale bar, 300 μm. j, Schematic representation of an axon and its myelin sheath illustrating g-ratio. r, axon inner diameter; R, axon outer diameter. kn, Representative scanning electron microscopy acquisitions (×20,000) of myelinated axons in inter-lobule VI–VII WM in males (k and l) and females (m and n). Scale bar, 300 nm. o, Scatter plot of g-ratios of >400 individual axons in males; data are from one representative control and one representative plKO mouse. Fitted lines are linear regressions. p, Percent of unmyelinated axons. Data are presented as mean ± s.e.m. Two-tailed unpaired Student’s t-test with Welch’s correction (*P < 0.05). n = 3 C and 3 plKO (P = 0.0275). q, Scatter plot of g-ratios of >400 individual axons in females; data are from one representative control and one representative plKO mouse. Fitted lines are linear regressions. r, Percent of unmyelinated axons. Data are presented as mean ± s.e.m. Two-tailed unpaired Student’s t-test with Welch’s correction (*P < 0.05). n = 3 C and 3 plKO (P = 0.0194). s, g-ratios by axon caliber category in males. Data are presented as mean ± s.e.m. Two-way ANOVA with Sidak’s multiple comparisons test (*P < 0.05). n = 3 C and 3 plKO (<1 µm: P = 0.0299; >1 µm: P = 0.0165). t, Axon caliber distribution in males (n = 3 C and 3 plKO). u, g-ratios by axon caliber category in females. Data are presented as mean ± s.e.m. Two-way ANOVA with Sidak’s multiple comparisons test (*P < 0.05). n = 3 C and 3 plKO <1 µm: P = 0.0162; >1 µm: P = 0.1185). v, Axon caliber distribution in females (n = 3 C and 3 plKO). Source data
Fig. 3
Fig. 3. Male plKO mice exhibit ASD-like behavior.
a, Three-chamber sociability test at P30. Data are presented as mean ± s.e.m. Two-way ANOVA with Sidak’s multiple comparison test (****P < 0.0001). Males: n = 20 C and 28 plKO (P = 0.0001); Females: n = 16 C and 10 plKO (P > 0.9999). b, Spontaneous gnawing time over 15 min at P30. Data are presented as mean ± s.e.m. Two-way ANOVA with Sidak’s multiple comparison test (*P < 0.01). Males: n = 20 C and 28 plKO (P = 0.0094); Females: n = 15 C and 11 plKO (P = 0.3982). c, Spontaneous digging time over 15 min at P30. Data are presented as mean ± s.e.m. Two-way ANOVA with Sidak’s multiple comparison test (*P < 0.05). Males: n = 20 C and 28 plKO (P = 0.0148); Females: n = 15 C and 11 plKO (P = 0.4781). d, z-standardized single significant behavior readouts that are integrated into the autism composite score in males at P30. Data are presented as mean ± s.e.m. Two-way ANOVA with Sidak’s multiple comparisons test (*P < 0.05; ***P < 0.0005). n = 20 C and 28 plKO. Sociability: P = 0.0002; Gnawing: P = 0.0239; Digging: P = 0.0301. e, z-standardized single significant behavior readouts that are integrated into the autism composite score in females at P30. Data are presented as mean ± s.e.m. Two-way ANOVA with Sidak’s multiple comparisons test. n = 15 C and 10 plKO. Sociability: P = 0.9802; Gnawing: P = 0.1419; Digging: P = 0.2979. f, ASD composite severity score at P30. Data are presented as mean ± s.e.m. Two-way ANOVA with Sidak’s multiple comparison test (****P < 0.0001). Males: n = 20 C and 28 plKO (P < 0.0001); Females: n = 16 C and 10 plKO (P > 0.9997). g,h, Relative frequency distribution of autism composite score bins at P30. Males: n = 20 C and 28 plKO; Females: n = 16 C and 10 plKO. i, Positive correlation between cerebellum MBP levels determined by western blot (normalized with GAPDH) and autism severity score in males at P30 (n = 12 C and 28 plKO). Linear regression. Deviation from zero: P = 0.0009. j,k, USVs at P4, P6, P8 and P11. Individual pups, males (j) and females (k), were separated from the dam and littermates, and their calls were recorded for 3 min. Data are presented as mean ± s.e.m. Two-way repeated measures ANOVA followed by Sidak’s multiple comparisons test (*P < 0.05). Males: n = 13 C and 15 plKO (P4: P = 0.0378; P6: P = 0.5714; P8: P = 0.9299; P11: P = 0.9609); Females: n = 7 C and 7 plKO (P4: P = 0.4587; P6: P = 0.6051; P8: P > 0.9999; P11: P = 0.7135). GAPDH, glyceraldehyde 3-phosphate dehydrogenase.
Fig. 4
Fig. 4. ALLO or muscimol administration during late gestation rescues MBP expression and abnormal behaviors in plKO males at P30.
a, Western blot determination of MBP contents in the cerebellum at P30. Normalized data to GAPDH contents are presented as mean fold changes ± s.e.m. Dams received an intraperitoneal injection of ALLO (10 mg kg−1) or muscimol (Musci; 1 mg kg−1) at E15.5. One-way ANOVA with Tukey’s multiple comparisons test (*P < 0.05; **P < 0.01; ***P < 0.005). n = 8 C, 11 plKO+Veh, 6 plKO+ALLO and 8 plKO+muscimol. Comparisons: C versus plKO+Veh: P = 0.009; C versus plKO+ALLO: P = 0.988; C versus plKO+muscimol: P = 0.607; plKO+Veh versus plKO+ALLO: P = 0.0058; plKO+Veh versus plKO+muscimol: P = 0.027; plKO+ALLO versus plKO+muscimol: P = 0.8436. b,c, ASD composite score and frequency distribution of autism severity score bins at P30. plKO and plKO+Veh mice were combined because there was no significant difference between both groups (named plKO(+Veh)). One-way ANOVA with Tukey’s multiple comparisons test (***P < 0.005; ****P < 0.0005). n = 20 C, 3 6plKO(+Veh), 17 plKO+ALLO and 9 plKO+muscimol. Comparisons: C versus plKO(+Veh): P < 0.0001; C versus plKO+ALLO: P = 0.6226; C versus plKO+muscimol: P = 0.4933; plKO(+Veh) versus plKO+ALLO: P = 0.0002; plKO(+Veh) versus plKO+muscimol: P = 0.0187; plKO+ALLO versus plKO+muscimol: P = 0.9765. GAPDH, glyceraldehyde 3-phosphate dehydrogenase.
Fig. 5
Fig. 5. Myelin proteins are dysregulated in a sex-linked manner in the cerebellar vermis of preterm infants.
a, Schematic of the age terminology during the perinatal period used for the human study. b, Distribution of donors’ gestational age at birth. c, Distribution of donors’ corrected age at death. Graphs in b and c show box and whisker plots (including minima, maxima and median values) with single values. d,e, Western blot analysis of myelin-related proteins in the cerebellar vermis of term and preterm male infants at an average corrected age of 6 weeks. Data are presented as mean fold changes ± s.e.m. (n = 6 T and 4 PT). Multiple unpaired t-tests with Holm–Sidak multiple comparison test (*P < 0.05). MBP: P = 0.014; MAG: P = 0.044; MOG: P = 0.024. f,g, Western blot analysis of myelin-related proteins in the cerebellar vermis of term and preterm female infants at an average corrected age of 6 weeks. Data are presented as mean fold changes ± s.e.m. Multiple unpaired t-tests with Holm–Sidak multiple comparison test (*P < 0.05). MBP: n = 3 T and 6 PT (P = 0.015); MAG: n = 3 T and 6 PT (P = 0.169); MOG: n = 3 T and 5 PT (P = 0.179). hj. qRT–PCR for myelin- and OL-related genes normalized to cyc1 in male infants. Data are presented as mean fold changes ± s.e.m. Two-tailed unpaired Student’s t-test with Welch’s correction (*P < 0.05, ****P < 0.0001). mbp: n = 7 T and 5 PT (P = 0.046); pdgfra: n = 9 T and 5 PT (P = 0.0482); cspg4: n = 9 T and 5 PT (P < 0.0001). k,l, qRT–PCR for myelin- and OL-related genes normalized to cyc1 in female infants. Data are presented as mean fold changes ± s.e.m. Two-tailed unpaired Student’s t-test with Welch’s correction. mbp: n = 4 T and 6 PT (P = 0.9923); pdgfra: n = 4 T and 6 PT (P = 0.9122). Cspg4, chondroitin sulfate proteoglycan 4 gene; Cyc1, cytochrome C1 gene; GAPDH, glyceraldehyde 3-phosphate dehydrogenase; Pdgfra, platelet-derived growth factor receptor alpha gene. PT, preterm; T, term. Source data
Extended Data Fig. 1
Extended Data Fig. 1. Chemical validation of the plKO model by mass spectrometry.
a, Linear regression of ALLO levels in placenta and brain, all sexes and genotypes included. ALLO levels in placenta and brain show a positive correlation (p = 0.0008; n = 18). b-f, Mass spectrometry data in placenta and brain at E17.5. Data is presented as means ± SEM (n = 9 C and 10 plKO). Two-way ANOVA with Sidak’s multiple comparison test. Sex mixed as no sex effect was evidenced. ALLO, allopregnanolone; EPIALLO, epiallopregnanolone; PREG, pregnenolone; PROG, progesterone; ALLOTHDOC, allotetrahydrodeoxycorticosterone.
Extended Data Fig. 2
Extended Data Fig. 2. Molecular validation of the RNA sequencing cutoffs.
Changes in mRNA (a-f) or protein (g-h) contents of selected cerebellar dysregulated genes after normalization. a, efnb3, ephrinB3 (RNAseq rank #26/1192 in males; up-regulated; q = 0.018; p = 3.41E-05). b, sbf1, SET Binding Factor 1 (RNAseq rank #82/1192 in males; down-regulated; q = 0.067; p = 0.00039). c, fabp7, Fatty Acid Binding Protein 7 (RNAseq rank #84/1192 in males; up-regulated; q = 0.0725; p = 0.00043). d, tcf7l2, transcription factor 7 like 2 (RNAseq rank #795/1192; up-regulated; q = 0.514; p = 0.029). e, nf1, Neurofibromin 1 (RNAseq rank #1189/1192 in males; down-regulated; q = 0.59; p = 0.0499). f, plp1, Proteolipid Protein 1 (RNAseq rank #64/389 in females; down-regulated; q = 1; p = 0.0054). Normalized qRT-PCR data (to pgk1) is presented as mean fold changes ± SEM, n = 10 samples/group.). Two-way ANOVA with Sidak’s multiple comparison test (a-f). *p < 0.05, **p < 0.01, ****p < 0.0001. g-h, Cerebellum protein contents determined by Western blot in males, and normalized to GAPDH levels. hnRNPΚ/Cfl1:n = 7 C and 7plKO; PSAP: n = 6 C and 6 plKO. Multiple unpaired t tests with Holm-Sidak multiple comparison test (**p < 0.01, ***p < 0.005, ****p < 0.0001). PSAP, prosaposin (RNAseq rank #950/1192 in males; up-regulated; q = 0.5329; p = 0.0359). Cfl1, cofilin-1 (RNAseq rank #27/1192 in males; up-regulated; q = 0.0192; p = 4.03E-05). hnRNPκ, heterogeneous nuclear ribonucleoprotein κ (rank #787; up-regulated; q = 0.509; p = 0.0284). i, mbp, myelin basic protein. Normalized qRT-PCR data (to ywhaz, Tyrosine 3-Monooxygenase/Tryptophan 5-Monooxygenase Activation Protein Zeta). Two-way ANOVA with Sidak’s multiple comparison test (n = 11 C and 11 plKO; *p < 0.05). See Extended Data Table 1 sheets 1 and 2 for list of ranked DEGs. Source data
Extended Data Fig. 3
Extended Data Fig. 3. Long-term impact of placental ALLO insufficiency on brain transcriptome: highlight on the myelin-associated genes in the cerebellum.
a-b, Number of differentially expressed genes (DEGs) that are up- or down-regulated in the cerebral cortex, hippocampus and cerebellum of plKO vs C mice at P30 in males (blue) and females (pink). The majority of DEGs were found in the male cerebellum. c-d, MA plots for the cerebellar RNAseq analysis of plKO vs C mice at P30. M, log ratio; A, mean average. DEGs are represented as colored dots (blue for males and pink for females). e-f, Top significant diseases and functions IPA annotations. g, Venn diagrams showing the overlaps between cerebellar DEGs in the plKO males (M_Cereb) and females (F_Cereb), and oligodendrocyte (OL) and myelin transcriptomes,. h-i, Heatmaps of OL-and myelin-related cerebellar DEGs in C and plKO samples. Genes and samples were hierarchically clustered based on Pearson distance of z-score data and average linkage. n = 3 independent samples/group,.
Extended Data Fig. 4
Extended Data Fig. 4. Diffusion Tensor Image (DTI) analysis at P30.
a, Heatmap representing mean fractional anisotropies (FA) in the cerebellum related tracts. Mean FA is increased in the cerebellar WM of plKO males compared to C littermates. Data is presented in a hierarchical tree [region effect: F(25, 1014)=57.36, p < 0.0001; sex effect: F(1,1014)=2.097, p = 0.1479; genotype effect: F(1,1014)=16.99, p < 0.0001; sex × genotype interaction: F(1,1014)=17.92, p < 0.0001; 3-way ANOVA]. b, Heatmap representing mean FA in extra-cerebellar tracts. No significant change was evidenced between groups when compared for genotype or sex [region effect: F(8,351)=80.28, p < 0.0001; sex effect: F(1,351)=1.011, p = 0.3152; genotype effect: F(1,351)=0.1618, p = 0.6877; sex × genotype interaction: F(1,351)=2.589, p = 0.1021; 3-way ANOVA]. Males: n = 11 C and 13plKO; Females: n = 8 C and 11 plKO.
Extended Data Fig. 5
Extended Data Fig. 5. Long-term impact of placental ALLO insufficiency on cerebral cortex transcriptome at P30: highlight on the OL- and myelin-related genes.
a, Venn diagrams showing the overlaps between cortical DEGs in the plKO males (M_Cortex) and females (F_Cortex), oligodendrocyte (OL) and myelin transcriptomes,. b-c, Heatmaps of OL-and myelin-related DEGs in the cerebral cortex of C and plKO samples. Genes and samples were hierarchically clustered based on Pearson distance of z-score data and average linkage. n = 3 independent samples/group.
Extended Data Fig. 6
Extended Data Fig. 6. Oligodendrocyte lineage progression during the postnatal period.
a, Immunofluorescent staining of Olig2 and CC1 in inter-lobule VI-VII WM at P30. Scale bar, 60 μm. b, Quantification of Olig2+ and CC1 + cell density in the male cerebellar WM at P30. Data presented as means ± SEM. Two-way ANOVA with Sidak’s multiple comparisons test (***p < 0.005, ****p < 0.0001). Olig2: n = 7 C and 8 plKO (p < 0.0001); CC1: n = 6 C and 7plKO (p = 0.0005). c, Quantification of BrdU + /Olig2+ cell density in the male cerebellar WM at P30. BrdU (50 mg/kg) was injected to dams at E15.5. Data presented as means ± SEM. Two-tailed unpaired Student’s t test with Welch’s correction (*p < 0.05). n = 5 C and 5plKO (p = 0.0107). d, Quantification of Olig2+ cell density in the male cerebellar WM at P7 and P15. Data is presented as means ± SEM. Two-way ANOVA with Sidak’s multiple comparisons test (***p < 0.005, ****p < 0.00010). P7: n = 3 mice/group (p = 0.0026); P15: n = 6 mice/group (p < 0.0001). The density of Olig2+ cells in the cerebellar WM is significantly increased in plKO males as compared with C littermates. e, OPC (PDGFRα + cell) density at P7, P15 and P30. Data is presented as means ± SEM. Two-way ANOVA with Sidak’s multiple comparisons test (*p < 0.05). P7: n = 3 mice/group (p = 0.0435); P15: n = 6 mice/group (p = 0.3644); P30: n = 6 C and 8 plKO (p = 0.8558). The density of OPCs in the cerebellar WM is transiently higher in plKO males as compared with C littermates at P7. f, Quantification of mature OL (CC1 + cell) density within the male cerebellar WM at P7 and P15. Data is presented as means ± SEM. Two-way ANOVA with Sidak’s multiple comparisons test (***p < 0.005). P7: n = 3 mice/group (p = 0.4951); P15: n = 6 mice/group (p < 0.0004). The density of mature OLs in the cerebellar WM is significantly increased in plKO males as compared with C littermates at P15. g-i, Ratios of OPCs (PDGFRα + cells) or mature OLs (CC1 + cells) within the total oligodendrocyte lineage (Olig2 + cells) in the male cerebellar WM across postnatal period. Data is presented as means ± SEM. Two-way ANOVA with Sidak’s multiple comparisons test (**p < 0.005). P7: n = 3 mice/group [p = 0.9741 (PDGFRα), p = 0.9393 (CC1)]; P15: n = 6 mice/group [p = 0.002 (PDGFRα), p = 0.001 (CC1)]; P30: n = 7 C and 8 plKO [p = 0.052 (PDGFRα), p = 0.17 (CC1)]. At P15, a transient acceleration of the OL maturation is observed in the male plKO. j, Quantification of total OL lineage (Olig2 + ) and mature OL (CC1 + ) cell densities in the female cerebellar WM at P15. Data is presented as means ± SEM. Two-way ANOVA with Sidak’s multiple comparisons test (*p < 0.01). Olig2 + : n = 7 C and 5 plKO (p = 0.0058); CC1 + : n = 6 C and 5 plKO (p = 0.9984). The density of total OL is increased in the cerebellar WM of plKO females compared to C littermates. k, Ratio of mature OLs (CC1 + cells) within the total OL lineage (Olig2 + cells) in the female cerebellar WM at P15. Data is presented as means ± SEM. Two-tailed unpaired Student’s t test with Welch’s correction (*p < 0.05). n = 6 C and 5plKO (p = 0.0225). A significantly reduction of OL maturation is observed in the female plKO as compared with littermate C.
Extended Data Fig. 7
Extended Data Fig. 7. Anatomical analysis of cerebellar grey and white matters in C and plKO at P30.
a–h, Cerebellar sagittal 40-μm-thick sections through the vermis in males. a-b, FluoroMyelin (FM) green staining. c-d, NeuN-immunofluorescence (marker for neuronal nuclei). e-f, NeuroD1-immunofluorescence (marker for granule cells). g-h, Calbindin-immunofluorescence (Purkinje cell marker; in magenta) and DAPI (in blue). i, Cerebellar layer volumes were unchanged in plKO when compared with C mice. Data is presented as means ± SEM from 6 sections/animal. Two-way ANOVA with Sidak’s multiple comparisons test. n = 5 C and 7plKO (WM: p = 0.48; GCL: p = 0.98; ML: p = 0.22). j, Purkinje cell linear density in the lobule VI-VII of C and plKO males at P30. Data is presented as means ± SEM from 6 sections/animal. Two-tailed unpaired Student’s t test with Welch’s correction. n = 6 C and 7plKO (p = 0.556). Calb, calbindin; GCL, granule cell layer; ML, molecular layer; WM, white matter. Scale bar, 200 μm.
Extended Data Fig. 8
Extended Data Fig. 8. Locomotor assessment in the Erasmus ladder at P30.
a–h, Performance on the Erasmus ladder. a-b, The analysis of baseline gait and coordination on days 1-4 showed significantly longer steps in adult male plKO mice than in their control littermates. Data is presented as means ± SEM. Two-way repeated-measures ANOVA with Sidak’s multiple comparisons test (*p < 0.05). n = 8 C and 6 plKO. Long steps=Day 1: p = 0.64; Day 2: p = 0.031; Day 3: p = 0.039; Day 4: p = 0.011. Short steps=Day 1: p = 0.61; Day 2: p = 0.029; Day 3: p = 0.039; Day 4: p = 0.015. c, Speed on the ladder was unchanged between C and plKO mice. Data is presented as means ± SEM. Two-way repeated-measures ANOVA with Sidak’s multiple comparisons test (n = 8 C and 6 plKO). d, Locomotor speed was unchanged in the open-field. Data is presented as means ± SEM. Two-tailed unpaired Student’s t test with Welch’s correction (n = 6 C and 8 plKO). e-h, The associative cerebellar learning was tested with the introduction of a conditioned tone and obstacle on days 5-8. The plKO mice exhibited no motor learning deficit. Data is presented as means ± SEM. Two-way repeated-measures ANOVA with Sidak’s multiple comparisons test (n = 8 C and 6plKO). i-j, The analysis of baseline gait and coordination on days 1-4 showed no difference in female plKO mice vs their control littermates. Data is presented as means ± SEM. Two-way repeated-measures ANOVA with Sidak’s multiple comparisons test (n = 7 C and 8plKO). k-n, The associative cerebellar learning was tested with the introduction of a conditioned tone and obstacle on days 5-8. The plKO mice exhibited no motor learning deficit. Data is presented as means ± SEM. Two-way repeated-measures ANOVA with Sidak’s multiple comparisons test (n = 7 C and 8 plKO).
Extended Data Fig. 9
Extended Data Fig. 9. Locomotor and balance behavioral testing at P30.
a–d, Accelerating rotarod performance at 4 to 40 rpm (trials 1-6) and 8 to 80 rpm (trials 7-12). a-b, Time to fall off is presented at 4 to 40 rpm and 8 to 80 rpm in males (a) and females (b). Data is presented as means ± SEM. Two-way repeated-measures ANOVA with Sidak’s multiple comparisons test (*p < 0.05, **p < 0.01, ***p < 0.005). Males: n = 9 C and 7plKO (Trial1: p = 0.4346; Trial2: p = 0.9961; Trial3: p = 0.9918; Trial4: p > 0.9999; Trial5: p = 0.0386; Trial6: p = 0.0016; Trial7: p = 0.9420; Trial8: p = 0.9995; Trial9: p = 0.4957; Trial10: p = 0.9118; Trial11: p = 0.9377; Trial12: p = 0.0495); Females: n = 6 C and 4 plKO (Any trial: p > 0.98). c-d, Terminal speed of rotation on the accelerating rotarod, presented at 4 to 40 rpm (trials 1-6) and 8 to 80 rpm (trials 7-12), was used to calculate learning rate (linear regression). The slopes from C and plKO are significantly different in males (c) (F = 11.32, DFd=20, p = 0.0031) but not in females (d). Data is presented as means ± SEM. Two-way repeated-measures ANOVA with Sidak’s multiple comparisons test (*p < 0.05, **p < 0.01, ***p < 0.005). Males: n = 9 C and 7 plKO (Trial1: p > 0.99; Trial2: p = 0.4176; Trial3: p = 0.0328; Trial4: p = 0.6343; Trial5: p = 0.9589; Trial6: p = 0.0328; Trial7: p = 0.6343; Trial8: p = 0.9589; Trial9: p = 0.0372; Trial10: p = 0.0328; Trial11: p = 0.4022; Trial12: p = 0.0045); Females: n = 6 C and 4 plKO (Any trial: p > 0.9). e, Marble burying test. Graph represents the number of marbles at least 2/3rd buried over 30-min. Data is presented as means ± SEM. Two-tailed unpaired Student’s t test with Welch’s correction (*p < 0.05). n = 7 mice/group (p = 0.023).
Extended Data Fig. 10
Extended Data Fig. 10. Cerebellar WM and behavioral impairments in male plKO mice can be prevented by pharmacological treatments at E15.5.
a, Quantification of Olig2+ and CC1 + cell densities in the male cerebellar WM (n = 7 C, 8 plKO+Veh and 4 plKO+ALLO). Data presented as means ± SEM. Two-way ANOVA with Sidak’s multiple comparisons test (*p < 0.05; **p < 0.01). Olig2 + = C vs plKO+Veh: p = 0.0024; C vs plKO+ALLO: p = 0.9982; plKO+Veh vs plKO+ALLO: p = 0.041. CC1 + : C vs plKO+Veh: p = 0.0014; C vs plKO+ALLO: p = 0.9995; plKO+Veh vs plKO+ALLO: p = 0.0354. b, 3-chamber sociability test. Data is presented as means ± SEM. Two-tailed unpaired Student’s t test with Welch’s correction (****p < 0.001). n = 29 C(+Veh) and 14 C + ALLO (p < 0.0001). c, ASD composite severity score. Data presented as means ± SEM. Two-tailed unpaired Student’s t test with Welch’s correction (*p < 0.05). n = 28 C(+Veh) and 13 C + ALLO (p = 0.0261).

Comment in

References

    1. Kratimenos P, Penn AA. Placental programming of neuropsychiatric disease. Pediatr. Res. 2019;86:157–164. doi: 10.1038/s41390-019-0405-9. - DOI - PMC - PubMed
    1. Hosie AM, Wilkins ME, da Silva HM, Smart TG. Endogenous neurosteroids regulate GABAA receptors through two discrete transmembrane sites. Nature. 2006;444:486–489. doi: 10.1038/nature05324. - DOI - PubMed
    1. Belelli D, Hogenkamp D, Gee KW, Lambert JJ. Realising the therapeutic potential of neuroactive steroid modulators of the GABAA receptor. Neurobiol. Stress. 2020;12:100207. doi: 10.1016/j.ynstr.2019.100207. - DOI - PMC - PubMed
    1. Schumacher M, et al. Revisiting the roles of progesterone and allopregnanolone in the nervous system: resurgence of the progesterone receptors. Prog. Neurobiol. 2014;113:6–39. doi: 10.1016/j.pneurobio.2013.09.004. - DOI - PubMed
    1. Brunton PJ, Russell JA, Hirst JJ. Allopregnanolone in the brain: protecting pregnancy and birth outcomes. Prog. Neurobiol. 2014;113:106–136. doi: 10.1016/j.pneurobio.2013.08.005. - DOI - PubMed

Publication types

MeSH terms