

Rational engineering the DNA tetrahedrons of dual wavelength ratiometric electrochemiluminescence biosensor for high efficient detection of SARS-CoV-2 RdRp gene by using entropy-driven and bipedal DNA walker amplification strategy
- PMID: 34400874
- PMCID: PMC8349740
- DOI: 10.1016/j.cej.2021.131686
Rational engineering the DNA tetrahedrons of dual wavelength ratiometric electrochemiluminescence biosensor for high efficient detection of SARS-CoV-2 RdRp gene by using entropy-driven and bipedal DNA walker amplification strategy
Abstract
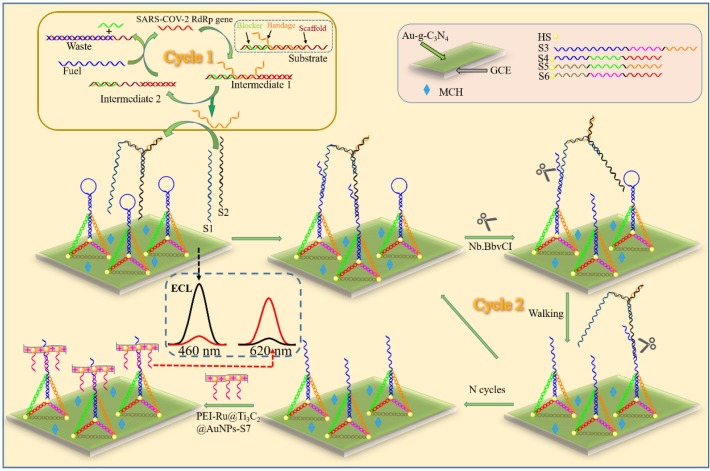
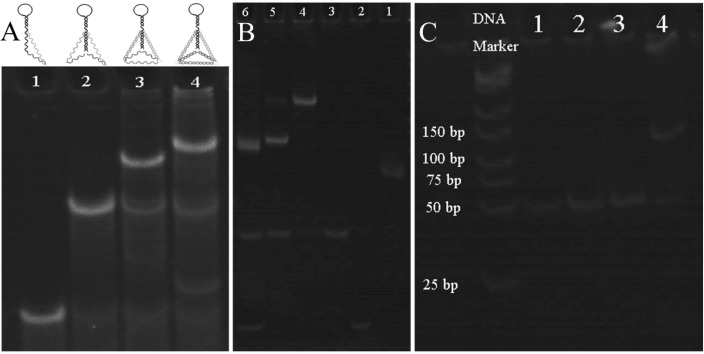
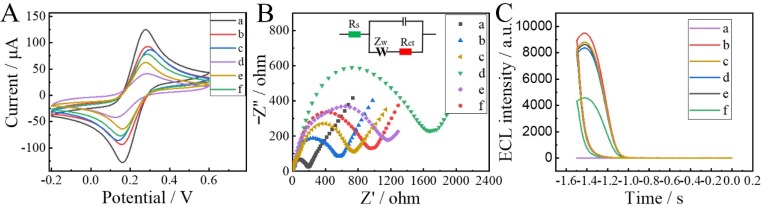
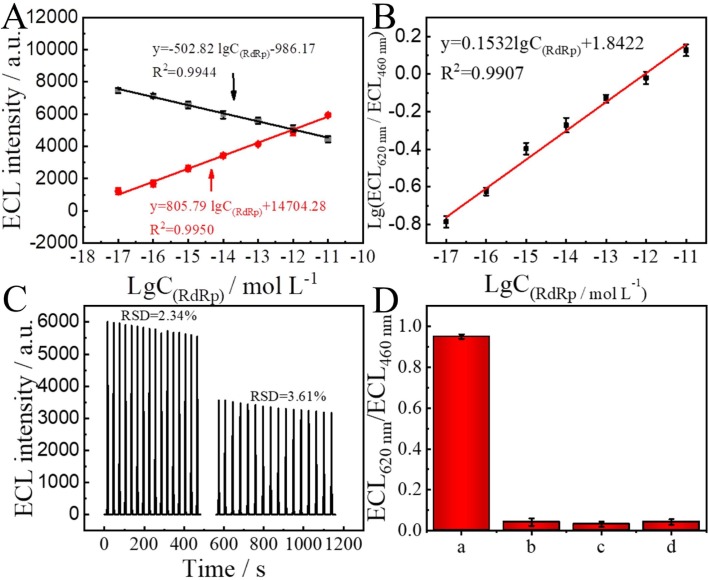
Fast and effective detection of epidemics is the key to preventing the spread of diseases. In this work, we constructed a dual-wavelength ratiometric electrochemiluminescence (ECL) biosensor based on entropy-driven and bipedal DNA walker cycle amplification strategies for detection of the RNA-dependent RNA polymerase (RdRp) gene of severe acute respiratory syndrome coronavirus 2 (SARS-CoV-2). The entropy-driven cyclic amplification reaction was started by the SARS-CoV-2 RdRp gene to generate a bandage. The bandage could combine with two other single-stranded S1 and S2 to form a bipedal DNA walker to create the following cycle reaction. After the bipedal DNA walker completed the walking process, the hairpin structures at the top of the DNA tetrahedrons (TDNAs) were removed. Subsequently, the PEI-Ru@Ti3C2@AuNPs-S7 probes were used to combine with the excised hairpin part of TDNAs on the surface of Au-g-C3N4, and the signal change was realized employing electrochemiluminescence resonance energy transfer (ECL-RET). By combining entropy-driven and DNA walker cycle amplification strategy, the ratiometric ECL biosensor exhibited a limit of detection (LOD) as low as 7.8 aM for the SARS-CoV-2 RdRp gene. As a result, detecting the SARS-CoV-2 RdRp gene in human serum still possessed high recovery so that the dual-wavelength ratiometer biosensor could be used in early clinical diagnosis.
Keywords: DNA tetrahedrons; Electrochemiluminescence biosensor; Entropy-driven; Ratiometric; SARS-CoV-2; bipedal DNA walker.
© 2021 Elsevier B.V. All rights reserved.
Conflict of interest statement
The authors declare that they have no known competing financial interests or personal relationships that could have appeared to influence the work reported in this paper.
Figures
Similar articles
-
Rational Engineering of the DNA Walker Amplification Strategy by Using a Au@Ti3C2@PEI-Ru(dcbpy)32+ Nanocomposite Biosensor for Detection of the SARS-CoV-2 RdRp Gene.ACS Appl Mater Interfaces. 2021 May 5;13(17):19816-19824. doi: 10.1021/acsami.1c04453. Epub 2021 Apr 23. ACS Appl Mater Interfaces. 2021. PMID: 33890471
-
Electrochemiluminescence resonance energy transfer biosensing platform between g-C3N4 nanosheet and Ru-SiO2@FA for dual-wavelength ratiometric detection of SARS-CoV-2 RdRp gene.Biosens Bioelectron. 2022 Nov 1;215:114580. doi: 10.1016/j.bios.2022.114580. Epub 2022 Jul 21. Biosens Bioelectron. 2022. PMID: 35917609 Free PMC article.
-
A strategy combining 3D-DNA Walker and CRISPR-Cas12a trans-cleavage activity applied to MXene based electrochemiluminescent sensor for SARS-CoV-2 RdRp gene detection.Talanta. 2022 Jan 1;236:122868. doi: 10.1016/j.talanta.2021.122868. Epub 2021 Sep 10. Talanta. 2022. PMID: 34635250 Free PMC article.
-
Entropy-driven amplified electrochemiluminescence biosensor for RdRp gene of SARS-CoV-2 detection with self-assembled DNA tetrahedron scaffolds.Biosens Bioelectron. 2021 Apr 15;178:113015. doi: 10.1016/j.bios.2021.113015. Epub 2021 Jan 20. Biosens Bioelectron. 2021. PMID: 33493896 Free PMC article.
-
Innovation of Ratiometric Sensing Strategies Based on Graphitic Carbon Nitride.Crit Rev Anal Chem. 2025 Apr 11:1-25. doi: 10.1080/10408347.2025.2486213. Online ahead of print. Crit Rev Anal Chem. 2025. PMID: 40215094 Review.
Cited by
-
2D Zn-Porphyrin-Based Co(II)-MOF with 2-Methylimidazole Sitting Axially on the Paddle-Wheel Units: An Efficient Electrochemiluminescence Bioassay for SARS-CoV-2.Adv Funct Mater. 2022 Sep 26:2209743. doi: 10.1002/adfm.202209743. Online ahead of print. Adv Funct Mater. 2022. PMID: 36247688 Free PMC article.
-
A Framework for Biosensors Assisted by Multiphoton Effects and Machine Learning.Biosensors (Basel). 2022 Sep 1;12(9):710. doi: 10.3390/bios12090710. Biosensors (Basel). 2022. PMID: 36140093 Free PMC article. Review.
-
VOC-alarm: mutation-based prediction of SARS-CoV-2 variants of concern.Bioinformatics. 2022 Jul 11;38(14):3549-3556. doi: 10.1093/bioinformatics/btac370. Bioinformatics. 2022. PMID: 35640977 Free PMC article.
-
Development of sandwich electrochemiluminescence immunosensor for COVID-19 diagnosis by SARS-CoV-2 spike protein detection based on Au@BSA-luminol nanocomposites.Bioelectrochemistry. 2022 Oct;147:108161. doi: 10.1016/j.bioelechem.2022.108161. Epub 2022 May 25. Bioelectrochemistry. 2022. PMID: 35659688 Free PMC article.
-
Electrochemiluminescent nanostructured DNA biosensor for SARS-CoV-2 detection.Talanta. 2022 Apr 1;240:123203. doi: 10.1016/j.talanta.2021.123203. Epub 2022 Jan 1. Talanta. 2022. PMID: 34998140 Free PMC article.
References
LinkOut - more resources
Full Text Sources
Research Materials
Miscellaneous