. 2021 Aug 3:15:100376.
doi: 10.1016/j.ynstr.2021.100376. eCollection 2021 Nov.

Bacteria - derived short chain fatty acids restore sympathoadrenal responsiveness to hypoglycemia after antibiotic-induced gut microbiota depletion

Affiliations

Bacteria - derived short chain fatty acids restore sympathoadrenal responsiveness to hypoglycemia after antibiotic-induced gut microbiota depletion

Edmund F LaGamma et al. Neurobiol Stress. .

Abstract

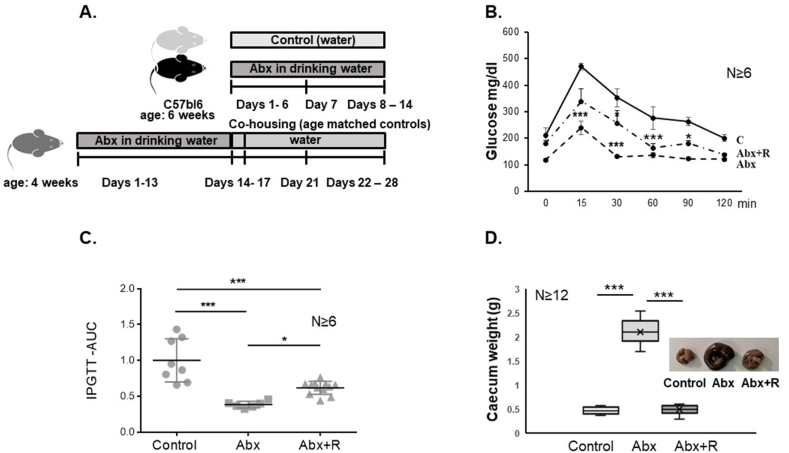
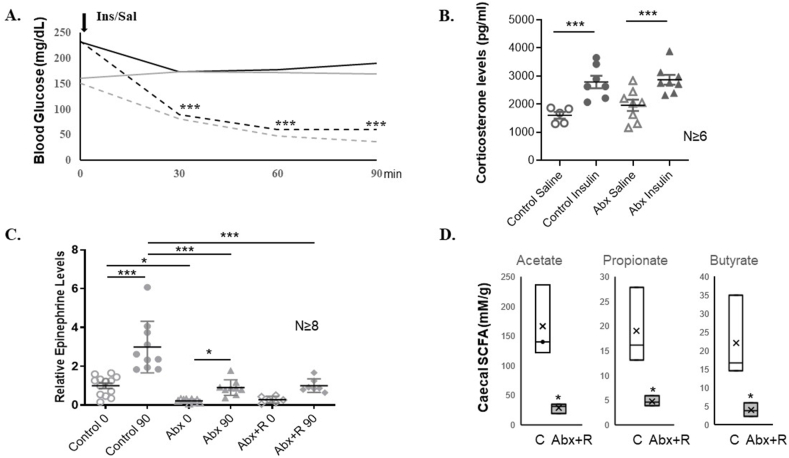
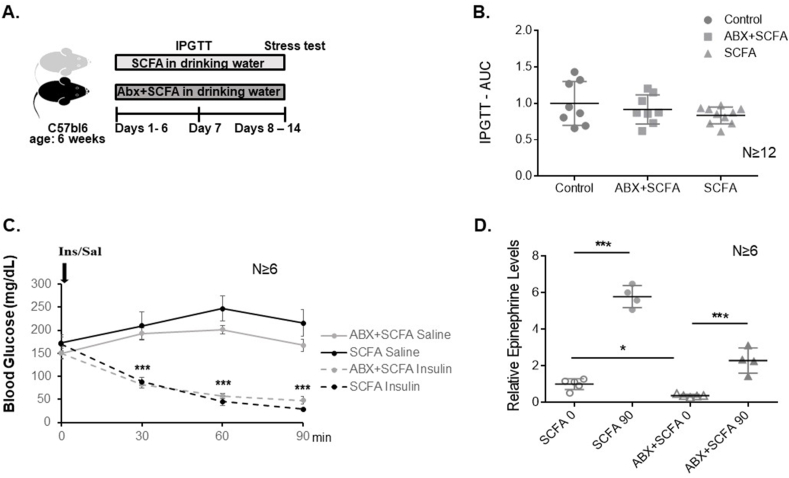
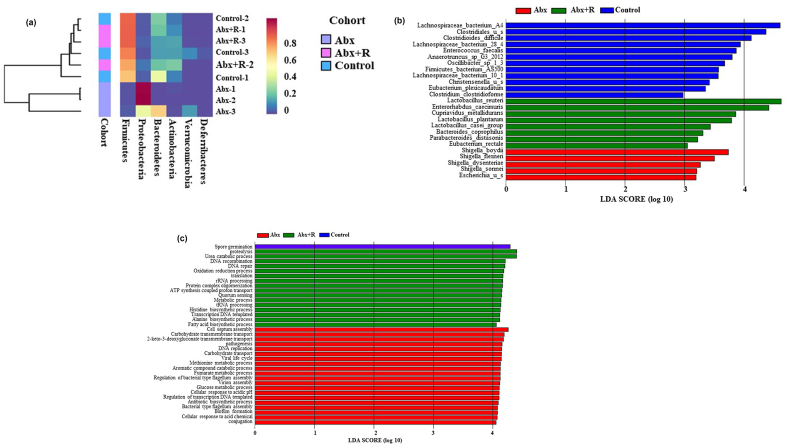
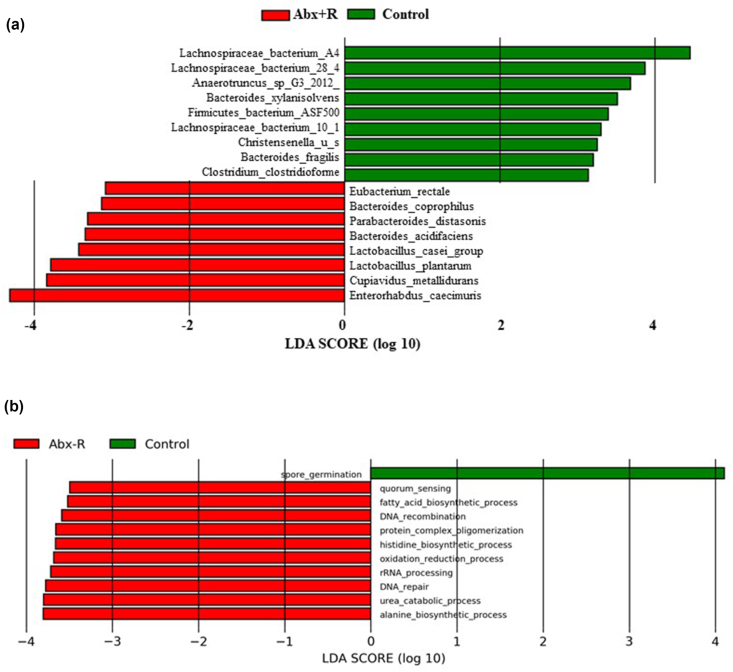
The microbiome co-evolved with their mammalian host over thousands of years. This commensal relationship serves a pivotal role in various metabolic, physiological, and immunological processes. Recently we discovered impaired adrenal catecholamine stress responses in germ-free mice suggesting developmental modification of the reflex arc or absence of an ongoing microbiome signal. To determine whether maturational arrest or an absent bacteria-derived metabolite was the cause, we tested whether depleting gut microbiome in young adult animals could also alter the peripheral stress responses to insulin-induced hypoglycemia. Groups of C57Bl6 male mice were given regular water (control) or a cocktail of non-absorbable broad-spectrum antibiotics (Abx) in the drinking water for two weeks before injection with insulin or saline. Abx mice displayed a profound decrease in microbial diversity and abundance of Bacteroidetes and Firmicutes, plus a markedly enlarged caecum and no detectable by-products of bacterial fermentation (sp. short chain fatty acids, SCFA). Tonic and stress-induced epinephrine levels were attenuated. Recolonization (Abx + R) restored bacterial diversity, but not the sympathoadrenal system responsiveness or caecal acetate, propionate and butyrate levels. In contrast, corticosterone (HPA) and glucagon (parasympathetic) resting values and responses to hypoglycemia remained similar across all conditions. Oral supplementation with SCFA improved epinephrine responses to hypoglycaemia. Whole genome shotgun sequence profiling of fecal samples from control, Abx and Abx + R cohorts identified nine microbes (SCFA producers) absent from both Abx and Abx + R groups. These results implicate gut microbiome depletion plus its attendant reduction in SCFA signalling in adversely affecting the release of epinephrine in response to hypoglycemia. We speculate that regardless of postnatal age, a mutable microbiome messaging system exists throughout life. Unravelling these mechanisms could lead to new therapeutic possibilities through controlled manipulation of the gut microbiota and its ability to alter systemic neurotransmitter responsiveness.

Keywords: Acute hypoglycemia; Epinephrine; Fecal whole genome sequencing; Microbiome; Oral antibiotics; Short chain fatty acids supplement.


Conflict of interest statement

The authors have declared that no conflict of interest exists.

Figures

Fig. 1
Fig. 1
Oral antibiotic treatment successfully depletes gut microbiome A: Study design: Animals were divided into 3 major groups: control (normal colonization, drinking regular sterile water); Abx (mice given mixture of non-absorbable broad spectrum antibiotics in the drinking water for 2 weeks) and Abx + R (mice on Abx treatment at 4–6 weeks followed by recolonization by co-housing with age-matched controls for 2 weeks). B: Intraperitoneal glucose tolerance test (IPGTT) performed at 7 weeks of age for all groups after 6 h fasting period. Control (solid line); Abx (broken line); Abx + R (dashdotted line). Blood glucose levels were recorded before (0 time point) and at indicated time points after injecting glucose load (2 g/kg body weight). The results are presented as mean ± SEM (n ≥ 6). The Abx group displayed significantly lower blood glucose levels, compared to the water controls: at 15, 30 and 60 min time point (***P ≤ 0.001) and *P ≤ 0.05 at 90 min; and Abx + R group had increased glucose levels at 30 min as compared to Abx group (at *P ≤ 0.05). Analyses were done using Two Way Repeated Measures ANOVA and all pairwise multiple comparisons - Bonferroni t-test. C: The IPGTT results were also expressed as areas under the curves (AUC) to estimate the extent of the glucose tolerance impairment. Data are normalized to the value in control group (taken as 1). One Way Analysis of Variance followed by all pairwise multiple comparison procedures (Holm-Sidak method): *P ≤ 0.05, (Abx vs. Abx + R, t = 2.614); ***P ≤ 0.001 (both, Control vs. Abx, t = 6.383; and Control vs. Abx + R, t = 4.690) and F = 21.793; DF = 2, (n ≥ 6). 1. Symbols indicate individual samples in each experimental group. D: At the time of sacrifice, each caecum was dissected and weight was determined using a precision scale for all groups. Data are presented as median with IQR and min/max values as error bars, n = 12. One Way Analysis of Variance (Kruskal-Wallis) followed by Holm-Sidak multiple comparisons test was performed. Marked increase in caecal weights was observed in Abx group (***P ≤ 0.001, DF 2; F = 382.29, t = 24.099, compared to control).
Fig. 2
Fig. 2
Mice with gut microbiome depletion have impaired epinephrine responses to metabolic stress A: The magnitude of insulin-induced hypoglycemia was similar between control (black lines) and Abx-treated (grey lines) mice. Blood glucose concentrations following insulin/saline treatment were measured in mice after 3 h fast as described in Methods. The values for saline (solid lines) and insulin-treated (broken lines) groups are shown as mean ± SEM, n ≥ 6. Data are summarized from 4 independent experiments and analyzed by Two Way Repeated Measures ANOVA, followed by Bonferroni t-test: Control Saline/Insulin was significantly different from Abx Saline/Insulin only at 0 time point (**P < 0.002, t = 3.964, and ***P < 0.001, t = 4.599 resp.). Control Sal vs Control Ins differed at 30, 60 and 90 min (***P < 0.001, t = 4.848; ***P < 0.001, t = 6.853, and ***P < 0.001, t = 7.600 resp.); and Abx Sal differed from Abx Ins for the same time points (P < 0.001, t = 5.210; P < 0.001, t = 6.955 and P < 0.001, t = 7.476, resp.). B: Corticosterone levels in the control and Abx-treated mice after saline or insulin injection are similar. The corticosterone levels were measured in plasma samples from saline and insulin treated mice (shown for control and Abx groups). Data are summarized from two independent experiments, n ≥ 6 animals per group. Results for 90 min time point are presented as mean ± SEM, and normalized to the levels in saline injected control group, taken for 1. Samples were analyzed by Two Way Analysis of Variance and Holm-Sidak test: Control Saline vs. Control Insulin ***P ≤ 0.001, t = 4.317, Abx Saline vs. Abx Ins. ***P ≤ 0.001, t = 3.622. Symbols indicate individual samples in each experimental group. C: Urinary epinephrine output: Epinephrine levels were analyzed in urinary samples collected before (0′ time point) and after the hypoglycemic episode (90 min) for each experimental group. Catecholamine levels were normalized to creatinine content in each sample, with 0′ time point control values taken as 1. Results are presented as mean ± SEM, n ≥ 8. Statistics: Two Way Analysis of Variance and Holm-Sidak all pairwise multiple comparison method. Control 0′ vs. 90’ ***P 0.001, t = 7.136; Abx 0′ vs. 90’ *P ≤ 0.034, t = 2.177; Abx + R 0′ vs. 90′ P = 0.056, t = 1.957; Control 0′ vs. Abx 0′ P < 0.027, t = 2.715; Control 90′ vs. Abx 90′ P < 0.001, t = 6.861; Control 90′ vs. Abx + R 90′ P < 0.001, t = 6.094. D: SCFA content (mM/g caecal tissue) was determined by gas chromatography analysis as described in Methods. SCFA were not detected in the Abx group. Data for Control and Abx + R are summarized from randomly selected individual samples (n = 3) for each experimental group and compared between groups by unpaired two-tailed t-test: Abx + R group displayed significantly lower Acetate (DF = 4; t stat = 3.861, *P < 0.018); Propionate (DF = 4, t stat = 3.127, *P < 0.035) and Butyrate (DF = 4, t stat = 2.776, *P < 0.05) levels.
Fig. 3
Fig. 3
SCFA supplement improves basal – and hypoglycemia induced urinary epinephrine levels in Abx mice A: Experimental design: animals were divided randomly into two groups, receiving Abx + SCFA or SCFA alone in the drinking water for 2 weeks. B: Area under the curves following glucose tolerance test at 7 weeks was determined as described (data are normalized to water control values, taken as 1). The results are presented as mean ± SEM; n ≥ 12; no significant difference between groups - One Way Analysis of Variance (DF = 2, F = 1.344; P = 0.280). C: Blood glucose levels during insulin-induced hypoglycemia. Stress test was performed at 8 weeks after 3 h fast. SCFA controls (black lines); Abx + SCFA – grey lines; saline injected – solid lines; insulin treated – broken lines. The blood glucose values (mg/dL) are shown as mean ± SEM, n ≥ 6 for each group and treatment. Data were analyzed by Two Way Repeated Measures ANOVA, followed by Bonferroni t-test. Glucose levels in SCFA Sal controls were not different from Abx + SCFA Sal at any time point, as well as in SCFA Insulin vs. Abx + SCFA Insulin. Injection of Insulin in both, SCFA and Abx + SCFA groups caused significant drop in blood glucose levels at 30, 60 and 90′ compared to 0′ time point (***P < 0.001, t = 4.988, 7.610 and 8.652; and ***P < 0.001, t = 4.228. 5.919 and 6.336 resp.). D: Relative urinary epinephrine levels were determined before (0 min) and after the stress test (90 min) in each experimental group. Results are normalized to the 0′ time point in control (SCFA alone) values (taken as 1) and presented as mean ± SEM, n ≥ 6. Data were analyzed by Two Way ANOVA followed by all pairwise multiple comparison procedures (Holm-Sidak): SCFA 0′ vs.90 ***P < 0.001, t = 17.346; Abx + SCFA 0′ vs 90’ ***P < 0.001, t = 7.273; SCFA vs Abx + SCFA at 0’ *P < 0.038, t = 2.267; SCFA vs. Abx + SCFA at 90’ ***P < 0.001, t = 12.340. Symbols indicate individual samples in each experimental group.
Fig. 4
Fig. 4
Fecal microbiome metagenomics – comparison analyses A: Hierarchically clustered heatmap displaying the relative abundance of bacterial taxa, with 3 pooled samples in each cohort. Bacterial taxa (phylum) are indicated on the bottom, the color gradient key and cohorts are shown on the right of the figure. The heatmap was created using the NMF R package, based on the taxonomic matrices from the CosmosID (Gaujoux and Seoighe, 2010). B: Differentially abundant taxa (species level) that showed significant differences in relative abundance of bacterial communities in control (blue), Abx (red) and Abx + R (green) cohorts as identified by linear discriminant analysis (LDA) assessed by effect size analysis (LefSe) algorithm. The figure was generated using LefSe tool from Huttenhower lab, based on species matrices from CosmosID analysis. The differentially abundant and biologically relevant features were ranked by effect size after undergoing linear discriminant analysis (LDA, log10 score treshold of 2.0). C: Predictive functional annotation of bacterial taxa - differential features abundance using GO biological processes as a reference was calculated for control (blue), Abx (red) and Abx + R (green) cohorts. For each bar, the name is the enriched feature and all features shown meet p ≤ 0.05 for Kruskal-Wallis and Wilcoxin tests, and have an LDA score ≥2.0. (For interpretation of the references to color in this figure legend, the reader is referred to the Web version of this article).
Fig. 5
Fig. 5
Co-housing does not restore gut bacterial community on species level A: Differentially abundant taxa associated with stress response (species level) that showed significance in relative abundance between control (green) and Abx + R (red) cohorts, as identified by LefSe. B: Differential features abundance (GO biological processes) calculated for control (green) and Abx + R (red) cohorts. For each bar, the name is the enriched feature and all features shown meet p ≤ 0.05 for Kruskal-Wallis and Wilcoxin tests, and have an LDA score ≥2.0 or ≤ −2.0. (For interpretation of the references to color in this figure legend, the reader is referred to the Web version of this article).

Similar articles

Cited by

References

    1. Andrikopoulos S., Blair A.R., Deluca N., Fam B.C., Proietto J. Evaluating the glucose tolerance test in mice. Am. J. Physiol. Endocrinol. Metab. 2008;295:E1323–E1332. - PubMed
    1. Aranyi T., Sarkis C., Berrard S., Sardin K., Siron V., Khalfallah O., Mallet J. Sodium butyrate modifies the stabilizing complexes of tyrosine hydroxylase mRNA. Biochem. Biophys. Res. Commun. 2007;359:15–19. - PubMed
    1. Atarashi K., Tanoue T., Ando M., Kamada N., Nagano Y., Narushima S., Suda W., Imaoka A., Setoyama H., Nagamori T. Th17 cell induction by adhesion of microbes to intestinal epithelial cells. Cell. 2015;163:367–380. - PMC - PubMed
    1. Bercik P., Denou E., Collins J., Jackson W., Lu J., Jury J., Deng Y., Blennerhassett P., Macri J., McCoy K.D. The intestinal microbiota affect central levels of brain-derived neurotropic factor and behavior in mice. Gastroenterology. 2011;141:599–609. 609 e591-593. - PubMed
    1. Blacher E., Levy M., Tatirovsky E., Elinav E. Microbiome-modulated metabolites at the interface of host immunity. J. Immunol. 2017;198:572–580. - PubMed

LinkOut - more resources