

Obesity and the Risk of Low Bicarbonate: A Cohort Study
- PMID: 34401717
- PMCID: PMC8350812
- DOI: 10.1016/j.xkme.2021.02.006
Obesity and the Risk of Low Bicarbonate: A Cohort Study
Abstract
Rationale & objective: Acid retention may occur in the absence of overt metabolic acidosis; thus it is important to identify populations at risk. Because obesity may alter renal acid-base handling, we sought to determine whether overweight and obesity are associated with increased risk for low serum bicarbonate levels, suggesting metabolic acidosis.
Study design: Retrospective cohort study.
Setting & participants: Adult patients (n = 96,147) visiting outpatient clinics in the Bronx, NY, between January 1, 2010, and December 31, 2015.
Predictor: Body mass index (BMI).
Outcome: Low serum bicarbonate level (≤23 mEq/L).
Analytical approach: Longitudinal analyses were conducted using mixed-effects models to examine associations of BMI with serum bicarbonate levels over time and Cox proportional hazards models to examine associations of BMI with incident low bicarbonate levels.
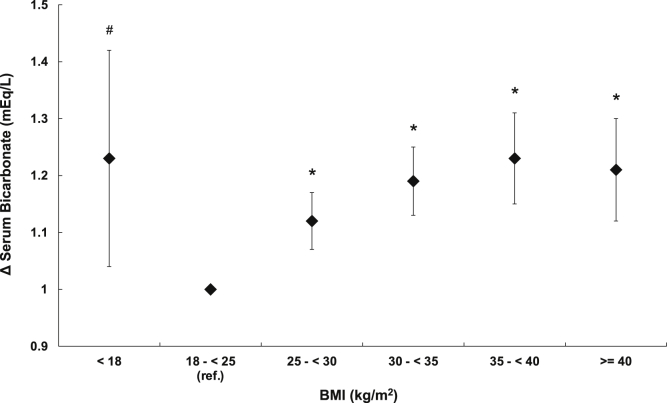
Results: During a median follow-up of 4.4 (interquartile range, 2.3-6.3) years, patients had a median of 8 serum bicarbonate measurements and 34,539 patients developed low bicarbonate levels. Higher BMI was associated with progressively lower serum bicarbonate levels, with attenuation of the association in the highest BMI groups, suggesting a J-shaped relationship. Compared with the reference group (BMI, 18.5 to <25 kg.m2), patients with BMIs of 25 to <30, 30 to <35, 35 to <40, and ≥40 kg/m2 had HRs for incident low bicarbonate levels of 1.10 (95% CI, 1.05-1.14), 1.16 (95% CI, 1.11-1.21), 1.20 (95% CI, 1.14-1.26), and 1.15 (95% CI, 1.09-1.22). Results were similar after adjustment for serum urea nitrogen level and exclusion of patients with diabetes, hypertension, or estimated glomerular filtration rates < 60 mL/min/1.73 m2.
Limitations: Arterial pH measurements were unavailable.
Conclusions: Higher BMI is independently associated with progressively greater risk for developing low serum bicarbonate levels, indicating likely metabolic acidosis. Further research should explore the causes of low bicarbonate levels in patients with overweight and obesity.
Keywords: Obesity; acid-base; bicarbonate; body mass index; insulin resistance; metabolic acidosis; overweight.
© 2021 The Authors.
Figures


References
-
- Garibotto G., Russo R., Sofia A. Muscle protein turnover in chronic renal failure patients with metabolic acidosis or normal acid-base balance. Miner Electrolyte Metab. 1996;22(1-3):58–61. - PubMed
-
- Kraut J.A., Mishler D.R., Singer F.R., Goodman W.G. The effects of metabolic acidosis on bone formation and bone resorption in the rat. Kidney Int. 1986;30(5):694–700. - PubMed
Grants and funding
LinkOut - more resources
Full Text Sources
