. 2021 Jul 31:11:100076.
doi: 10.1016/j.toxcx.2021.100076. eCollection 2021 Sep.

Addressing the global snakebite crisis with geo-spatial analyses - Recent advances and future direction

Affiliations

Addressing the global snakebite crisis with geo-spatial analyses - Recent advances and future direction

Anna F V Pintor et al. Toxicon X. .

Abstract

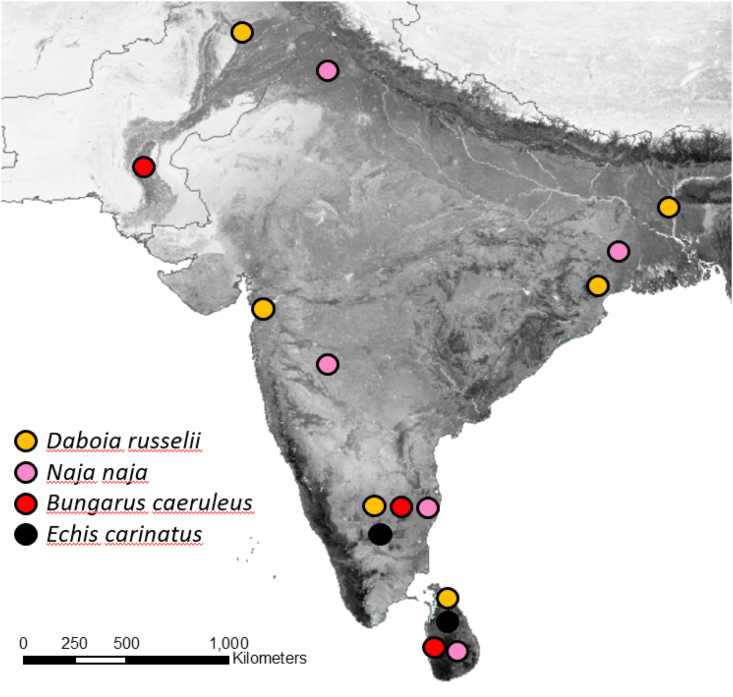
Venomous snakebite is a neglected tropical disease that annually leads to hundreds of thousands of deaths or long-term physical and mental ailments across the developing world. Insufficient data on spatial variation in snakebite risk, incidence, human vulnerability, and accessibility of medical treatment contribute substantially to ineffective on-ground management. There is an urgent need to collect data, fill knowledge gaps and address on-ground management problems. The use of novel, and transdisciplinary approaches that take advantage of recent advances in spatio-temporal models, 'big data', high performance computing, and fine-scale spatial information can add value to snakebite management by strategically improving our understanding and mitigation capacity of snakebite. We review the background and recent advances on the topic of snakebite related geospatial analyses and suggest avenues for priority research that will have practical on-ground applications for snakebite management and mitigation. These include streamlined, targeted data collection on snake distributions, snakebites, envenomings, venom composition, health infrastructure, and antivenom accessibility along with fine-scale models of spatio-temporal variation in snakebite risk and incidence, intraspecific venom variation, and environmental change modifying human exposure. These measures could improve and 'future-proof' antivenom production methods, antivenom distribution and stockpiling systems, and human-wildlife conflict management practices, while simultaneously feeding into research on venom evolution, snake taxonomy, ecology, biogeography, and conservation.

Keywords: Envenomings; Medically relevant snakes; Neglected tropical diseases; Snakebite incidence; Spatio-temporal epidemiology; Species distribution models.


Figures

Fig. 1
Fig. 1
WHO (pink shaded area) and GARD (red dotted outlines) distribution estimates, and known occurrences (red dots) for medically relevant snake species of conservation concern (IUCN 2020) from category 1 Echis jogeri [A; data deficient] and Bungarus slowinskii [C & E; vulnerable] and category 2 Pseudechis papuanus [B; data deficient] and Mixcoatlus barbouri [D & F; endangered], showcasing how snakes often have limited distribution data and varying distribution estimates. ENMs for B. slowinski (E) and M. barbouri F) improve distribution estimates (blue = more suitable; data for models was combined with closely related, ecologically similar sister species B. bungaroides and M. browni, respectively, to achieve minimum data requirements for models). Note that suitable habitat may be unreachable by a species or may be occupied by closely related or competing taxa. Background in A-D shows mean vegetation greenness (fraction photosynthetic active radiation; https://land.copernicus.eu/global/products/fapar) with greener shown as darker shades of grey.
Fig. 2
Fig. 2
Proposed components of iterative strategy to improve knowledge on snake species and their distributions.
Fig. 3
Fig. 3
Diagram describing the dependence of snakebite mortality and morbidity on snakebite and envenomation incidence, and risk (the product of likelihood of exposure and consequence of exposure). Snakebite risk is intrinsic to the nature of the dangerous herpetofauna in an area, incidence is how often the risk is realized, and snakebite morbidity/mortality further depend on snakebite management practice.
Fig. 4
Fig. 4
Health seeking behaviour pattern versus envenoming incidence in Sri Lanka adapted from Ediriweera et al., 2016; . Individual cases are mapped on an envenoming bite incidence map of Sri Lanka. Black triangles show modern medical treatment seeking behaviour, blue triangles show traditional medical treatment seeking behaviour.
Fig. 5
Fig. 5
Sample locations for studies on the geographic variation in venom composition in the ‘Big Four’ snakes across the Indian sub-continent: the Indian spectacled cobra (Naja naja; Mukherjee et al., 2020), the Indian krait (Bungarus caeruleus; Oh et al., 2017), the saw-scaled viper (Echis carinatus; Patra et al., 2020), and the Russell's viper (Daboia russelii; Pla et al., 2019). Background shows mean vegetation greenness (fraction photosynthetic active radiation; https://land.copernicus.eu/global/products/fapar) with greener areas shown as darker shades of grey.
Fig. 6
Fig. 6
Example of how different hypothetical intraspecific venom lineages or venom expression types could be distributed within a species' overall range. A: Location of the sampled lineages P1, P2, and P3; B: Each venom lineage may occur throughout the species' distribution (wide-spread diversity in expression of venom types); C: geographically distinct lineages could occupy similar proportions of the species' range; D: venom composition could change gradually between lineages; E: some lineages could be locally restricted because of boundaries to gene flow (thick black lines) or different sized areas of distinct habitat types relevant to venom expression; F: additional unsampled lineages may be present, such as isolated island [P4] or distinct habitat fragment [P5] lineages.
Fig. 7
Fig. 7
Example of how the species Bungarus fasciatus might be split up (thick black lines) into potential venom lineages based on perceived gaps in its distribution and known dispersal barriers (e.g. oceans) using (A) known occurrence records (red dots) and expert derived range estimates (pink shaded area) or, alternatively, using (B) habitat suitability estimates to detect potential distribution gaps.

References

    1. Acharya K.P., Paudel P.K., Jnawali S.R., Neupane P.R., Koehl M. Can forest fragmentation and configuration work as indicators of human–wildlife conflict? Evidences from human death and injury by wildlife attacks in Nepal. Ecol. Indicat. 2017;80:74–83.
    1. Ahmed S., Adams A.M., Islam R., Hasan S.M., Panciera R. Impact of traffic variability on geographic accessibility to 24/7 emergency healthcare for the urban poor: a GIS study in Dhaka, Bangladesh. PloS One. 2019;14 - PMC - PubMed
    1. ALA . 2021. ALA Open Access to Australia's Biodiversity Data.https://www.ala.org.au/ 15/3/2021.
    1. Alape-Girón A., Sanz L., Escolano J., Flores-Diaz M., Madrigal M., Sasa M., Calvete J.J. Snake venomics of the lancehead pitviper Bothrops asper: geographic, individual, and ontogenetic variations. J. Proteome Res. 2008;7:3556–3571. - PubMed
    1. Alcoba G., Ochoa C., Babo Martins S., Ruiz de Castañeda R., Bolon I., Wanda F., Comte E., Subedi M., Shah B., Ghimire A. Novel transdisciplinary methodology for cross-sectional analysis of snakebite epidemiology at national scale. PLoS Neglected Trop. Dis. 2021;15 - PMC - PubMed