. 2021 Aug 5;2(3):100718.
doi: 10.1016/j.xpro.2021.100718. eCollection 2021 Sep 17.

Collection of cells for single-cell RNA sequencing using high-resolution fluorescence microscopy

Affiliations

Collection of cells for single-cell RNA sequencing using high-resolution fluorescence microscopy

Hendrika A Segeren et al. STAR Protoc. .

Abstract

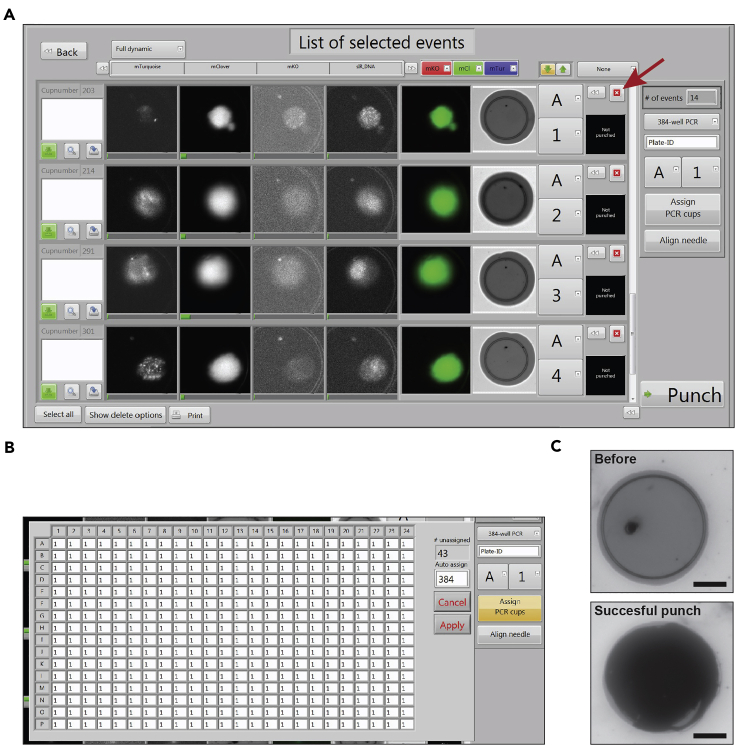
FACS sorting followed by single-cell RNA-sequencing (SORT-Seq) is a popular procedure to select cells of interest for single-cell transcriptomics. However, FACS is not suitable for measurement of subcellular distribution of fluorescence or for small samples (<1,000 cells). The VYCAP puncher system overcomes these limitations. Here, we describe a workflow to capture, image, and collect fluorescent human retina pigment epithelium cells for SORT-Seq using this system. The workflow can be used for any cell type with a diameter of ∼5-50 μm. For complete details on the use and execution of this protocol, please refer to Segeren et al. (2020).

Keywords: Cell Biology; Genomics; Microscopy; Single Cell.


Conflict of interest statement

H.A.S. and B.W. declare no competing interests. L.O. and K.C.A. are employed by VYCAP B.V.

Figures

None
Graphical abstract
Figure 1
Figure 1
Collecting single cells for RNA-sequencing with the VYCAP needle puncher (A) Customized microscope system with dedicated software to isolate, select and punch single cells. The chip is placed on xy-stage #1, and the microwell plate is placed on xy-stage #2. (B) Pump system to apply a negative pressure on the chip to pull the single cell suspension from the collection reservoir towards the waste reservoir. (C) The cell capture chip. Inset: microscopic overview of the grid, which contains 6400 cups that each contain a pore. The chip acts as a sieve; single cells cannot pass through the pores. (D) Image showing cell with 53BP1 foci and nuclear expression of Geminin(1–120) captured on a VYCAP microwell chip. Images were taken with a 40× long working distance objective.
Figure 2
Figure 2
Preparing the cell capture chip (A) Immerse chip in 100% ethanol in a petri dish to prepare the air bubble removal step. (B) Chip viewed from above, before (upper image) and after (lower image) removal of air bubbles and re-mounting. The areas containing cups are marked by the yellow boxes. Note that the surface of the chip looks smooth and regular after bubble removal. After this step, make sure that the chip does not run dry again. (C) Re-mount the chip in the holder and gently pipet 1 mL of PBS on top. Avoid air bubble formation at all times. (D) Correct alignment of the microwell plate. The first well (A1) should be right underneath the tip of the needle. (E) The plateholder must be calibrated in the z-stage such that the distance between microwell plate and chip holder is not more than 1–2 mm (lower panel, yellow arrow). (F) Dry the backside of the chip by touching a corner with a piece of absorbing lens cleaning paper before mounting the chip on the microscope. Avoid touching the chip. (G) Pipet roughly 150–200 μL of PBS or serum-free medium on the chip as soon as it is mounted on the microscope.
Figure 3
Figure 3
Cell selection and inspection of punch success (A) Screenshot from the VYCAP punch software showing a list of automatically detected cells. The list can be manually inspected and unwanted cells can be manually deleted (click button indicated by dark red arrow). (B) Screenshot from the VYCAP software showing the well assignment window. In this case the first 384 cells of interest were each assigned automatically to individual well positions. (C) Reflection images before and after a successful punch. Scalebar indicates 20 μm.
Figure 4
Figure 4
Troubleshooting (A) Filmstrip with reflection images from a failed experiment with a sticky needle. The bottoms do not fall, and stick to the chip when the needle returns to the start position. Scalebar: 20 μm. (B) Brightfield images of an intact clean punch needle (upper panel) and an example of a needle tip heavily contaminated with protein and hyaluronan (lower panel). Arrowhead: glass microsphere that is glued to the tip of the metal. Scalebar: 10 μm. (C) Filmstrip with reflection images from a failed experiment with a sharp punch needle; the wells get shattered, because the smooth glass microsphere has fallen off. Scalebar: 20 μm. (D) Brightfield image of a needle lacking the microsphere after accidentally hitting the metal of the chip between the wells. Scalebar: 10 μm. (E) Incorrect detection of the breaking edge of one of the corner cups during chip alignment. This is usually seen if the back-side of the chip is not properly cleaned (left panel), or if the contrast in the image is not high enough. The right panel shows correct detection.

References

    1. Boekhout M., Yuan R., Wondergem A.P., Segeren H.A., van Liere E.A., Awol N., Jansen I., Wolthuis R.M., de Bruin A., Westendorp B. Feedback regulation between atypical E2Fs and APC/CCdh1 coordinates cell cycle progression. EMBO Rep. 2016;3:414–427. - PMC - PubMed
    1. Muraro M.J., Dharmadhikari G., Grun D., Groen N., Dielen T., Jansen E., van Gurp L., Engelse M.A., Carlotti F., de Koning E.J., van Oudenaarden A. A Single-Cell Transcriptome Atlas of the Human Pancreas. Cell. Syst. 2016;4:385–394.e3. - PMC - PubMed
    1. Sakaue-Sawano A., Kurokawa H., Morimura T., Hanyu A., Hama H., Osawa H., Kashiwagi S., Fukami K., Miyata T., Miyoshi H. Visualizing spatiotemporal dynamics of multicellular cell-cycle progression. Cell. 2008;3:487–498. - PubMed
    1. Satija R., Farrell J.A., Gennert D., Schier A.F., Regev A. Spatial reconstruction of single-cell gene expression data. Nat. Biotechnol. 2015;5:495–502. - PMC - PubMed
    1. Segeren H.A., van Rijnberk L.M., Moreno E., Riemers F.M., van Liere E.A., Yuan R., Wubbolts R., de Bruin A., Westendorp B. Excessive E2F Transcription in Single Cancer Cells Precludes Transient Cell-Cycle Exit after DNA Damage. Cell. Rep. 2020;9:108449. - PubMed

Publication types