[Preprint]. 2021 Aug 11:rs.3.rs-153628.
doi: 10.21203/rs.3.rs-153628/v1.

SARS-CoV-2 infects blood monocytes to activate NLRP3 and AIM2 inflammasomes, pyroptosis and cytokine release

Affiliations

SARS-CoV-2 infects blood monocytes to activate NLRP3 and AIM2 inflammasomes, pyroptosis and cytokine release

Caroline Junqueira et al. Res Sq. .

Update in

  • FcγR-mediated SARS-CoV-2 infection of monocytes activates inflammation.
    Junqueira C, Crespo Â, Ranjbar S, de Lacerda LB, Lewandrowski M, Ingber J, Parry B, Ravid S, Clark S, Schrimpf MR, Ho F, Beakes C, Margolin J, Russell N, Kays K, Boucau J, Das Adhikari U, Vora SM, Leger V, Gehrke L, Henderson LA, Janssen E, Kwon D, Sander C, Abraham J, Goldberg MB, Wu H, Mehta G, Bell S, Goldfeld AE, Filbin MR, Lieberman J. Junqueira C, et al. Nature. 2022 Jun;606(7914):576-584. doi: 10.1038/s41586-022-04702-4. Epub 2022 Apr 6. Nature. 2022. PMID: 35385861 Free PMC article.

Abstract

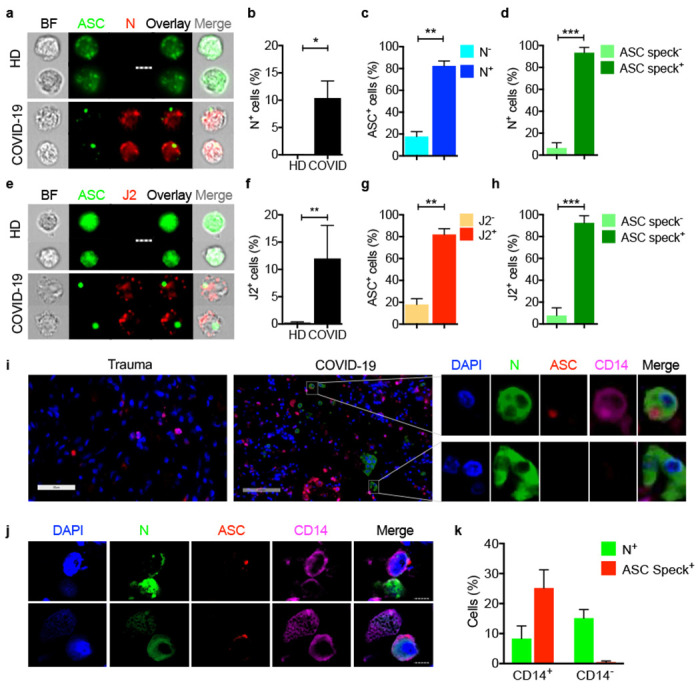
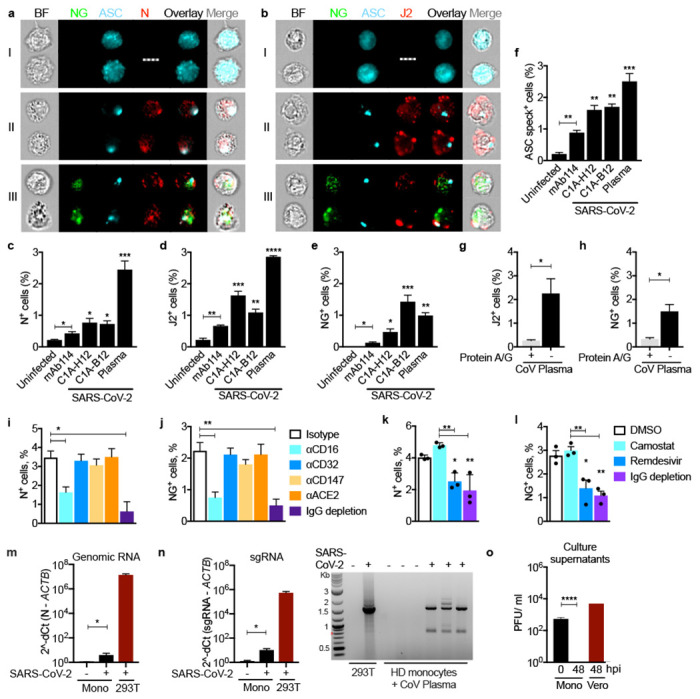
SARS-CoV-2 causes acute respiratory distress that can progress to multiorgan failure and death in a minority of patients. Although severe COVID-19 disease is linked to exuberant inflammation, how SARS-CoV-2 triggers inflammation is not understood. Monocytes and macrophages are sentinel immune cells in the blood and tissue, respectively, that sense invasive infection to form inflammasomes that activate caspase-1 and gasdermin D (GSDMD) pores, leading to inflammatory death (pyroptosis) and processing and release of IL-1 family cytokines, potent inflammatory mediators. Here we show that expression quantitative trait loci (eQTLs) linked to higher GSDMD expression increase the risk of severe COVID-19 disease (odds ratio, 1.3, p<0.005). We find that about 10% of blood monocytes in COVID-19 patients are infected with SARS-CoV-2. Monocyte infection depends on viral antibody opsonization and uptake of opsonized virus by the Fc receptor CD16. After uptake, SARS-CoV-2 begins to replicate in monocytes, as evidenced by detection of double-stranded RNA and subgenomic RNA and expression of a fluorescent reporter gene. However, infection is aborted, and infectious virus is not detected in infected monocyte supernatants or patient plasma. Instead, infected cells undergo inflammatory cell death (pyroptosis) mediated by activation of the NLRP3 and AIM2 inflammasomes, caspase-1 and GSDMD. Moreover, tissue-resident macrophages, but not infected epithelial cells, from COVID-19 lung autopsy specimens showed evidence of inflammasome activation. These findings taken together suggest that antibody-mediated SARS-CoV-2 infection of monocytes/macrophages triggers inflammatory cell death that aborts production of infectious virus but causes systemic inflammation that contributes to severe COVID-19 disease pathogenesis.


Conflict of interest statement

Competing Interests: The authors declare no competing interests.

Figures

ED Figure 1.
ED Figure 1.. Identification of lymphocyte and monocyte subsets in healthy donors and COVID-19 patients.
Gating strategy for identifying lymphocytes and monocytes in Figure 1.
ED Figure 2.
ED Figure 2.. Analysis of genetic link of immune gene eQTLs to severe COVID-19 disease
a, Screenshot of UCSC genome browser in the vicinity of GSDMD (highlighted in turquoise) on chromosome 8. The eQTLs are the thin turquoise vertical lines. None are within the GSDMD gene - one is within the gene RHPN1, one is within ZC3H3, and one is adjacent to ZNF707. All are eQTLs (validated by the eQTLGen consortium) that are associated with increased GSDMD expression. b, Analysis of eQTL links to COVID-19 hospitalization (6406 hospitalized cases versus 902,088 population controls), c, Analysis of eQTL links in patients with severe COVID-19 disease (269 cases) vs control infected patients, who did not require hospitalization for COVID-19 (688 controls).
ED Figure 3.
ED Figure 3.
a, Gating strategy for imaging flow cytometry analysis of isolated monocytes. b, Representative imaging flow cytometry images of GSDMD and ASC staining in COVID-19 patient monocytes that lacked ASC specks. Scale bar, 7 μm. c, Representative confocal image z-stacks and plane projections of monocytes of HD and COVID-19 patient monocytes, stained for the same markers as in Figure 2. Scale bars, 5 μm.
ED Figure 4.
ED Figure 4.. ACE2 and CD147 expression on circulating monocytes.
Purified blood monocytes from HD (n=3) and COVID-19 patients (n=4) were analyzed by flow cytometry (a,c) or qRT-PCR (b,d) for expression of ACE2 (a,b) or CD147 (BSG) (c,d). HD monocytes were treated or not with LPS before analysis. A549-ACE2 cells were used as positive control. Mean ± S.E.M. is shown. *p<0.05, **p<0.01, ***p<0.001, ****p<0.0001 relative to isotype control-stained LPS activated HD monocytes (a,c) by one-way ANOVA with Tukey’s multiple comparisons test.
ED Figure 5.
ED Figure 5.. Effect of anti-Spike monoclonal antibodies or pooled COVID plasma and LPS activation on in vitro infection of healthy donor purified monocytes with icSARS-CoV-2-mNG
a, Spike RBD-specific IgG were quantified by ELISA from the plasma of healthy donor (HD=10), non-COVID-19 patients (n=5) and COVID-19 patient plasma (n=18). b-l, HD monocytes were primed (black bars) or not (white bars) with LPS, infected with icSARS-CoV-2-mNG (MOI, 1), then stained 48 h later for nucleocapsid (N) or dsRNA (J2) and ASC and analyzed by imaging flow cytometry. Before infection, virus was preincubated with indicated monoclonal antibodies (IgG1 isotype control mAb114 (Iso)), non-neutralizing anti-spike (C1A-H12 (H12)) or neutralizing anti-RBD (C1A-B12 (B12)) or with pooled HD or COVID-19 patient plasma that had been heat-inactivated (HI) or not. U, uninfected. Quantification of HD monocyte staining for N (b,e), J2 (c,f), NG (d,g) or ASC specks (e). f,g, Percentage of N+ (i) and J2+ (j) cells that had ASC specks. k,l, Percentage of N+ (h) and J2+ (i) cells that had detectable NG. Mean ± S.E.M. is shown. *p<0.05, **p<0.01, ***p<0.001, ****p<0.0001 by one-way ANOVA with Tukey’s multiple comparisons test (a), relative to Iso or as indicated, by two-way ANOVA with Sidak’s multiple comparisons test (b-d) and by one-way ANOVA with Tukey’s multiple comparisons test (e-l).
Figure 1.
Figure 1.. Circulating monocytes from COVID-19 patients are undergoing pyroptosis
a-c, Representative flow cytometry contour plots (a) and percentage of lymphocyte and monocyte subsets staining for Annexin V only or Zombie (b) in 19 healthy donors (HD) and 22 SARS-CoV-2 infected patients. c, Concentration of gasdermin D (GSDMD), pyroptosis-related cytokines (IL-1β, IL-1RA, IL-18) and lactate dehydrogenase (LDH) activity in the plasma of HD (n=6) or SARS-CoV-2 positive patients (COVID, n=10). d, Plasma pyroptosis biomarkers GSDMD, LDH activity, IL-1RA and IL-18 at presentation and during hospitalization in COVID-19 patients with mild, moderate and severe COVID-19 acuity scores (n=60). e, Odds ratio for severe COVID-19 disease relative to eQTLs that are associated with increased gene expression of pyroptosis, necroptosis and death receptor-related genes. Data show mean ± S.E.M or odds ratio (95% confidence interval). *p<0.05, **p<0.01, ***p<0.001, ****p<0.0001 by two-way ANOVA (b) Mann-Whitney or Kolmogorov-Smirnov test (c) and multiple t-tests (d).
Figure 2.
Figure 2.. Monocytes from COVID-19 patients have activated inflammasomes, caspase-1 and gasdermin D
Circulating monocytes from healthy donors (HD) or COVID-19 patients were treated or not with nigericin, and then analyzed by imaging flow cytometry for caspase-1 activation (by FLICA assay before fixation) and fixed and stained for the indicated markers, a-c, Percentage of monocytes with activated ASC, n=5 (a) or caspase-1, n=5 (b) or colocalized ASC/caspase-1 specks, n=5 (c). Representative images are shown at top and quantification is graphed at bottom. d, Percentage of ASC-speck-containing monocytes with colocalized activated caspase-1 (n=6), NLRP3 (n=6), AIM2 (n=4), or pyrin (n=4) specks. e,f, Representative images of ASC (e) and Zombie dye (f) and GSDMD co-stained monocytes (4 independent experiments). g, Immunoblot of lysates of freshly isolated purified HD and COVID-19 monocytes and of HD monocytes treated with LPS and nigericin (+) probed with GSDMD mAb that recognizes full length (GSDMD-FL) and the cleaved C-terminal fragment (GSDMD-CT) (top). Anti-β-actin (middle) and COX-IV (bottom) are loading controls. h,i Representative images of ASC co-staining with NLRP3 (left), AIM2 (middle) and pyrin (right) (h) and quantification of monocytes showing colocalization of ASC specks with each inflammasome (i). j, Representative images of co-staining of ASC, NLRP3, and AIM2 (from 3 independent experiments). Scale bar, 7 μm. BF, brightfield. Mean ± S.E.M. is shown. *p<0.05, **p<0.01, ***p<0.001, ****p<0.0001 by two-way ANOVA with Tukey’s multiple comparisons test (a-c,i) and by one-way ANOVA with Tukey’s multiple comparisons test (d).
Figure 3.
Figure 3.. SARS-CoV-2 infects circulating monocytes and lung macrophages and infection activates inflammasome formation
a-h, Circulating monocytes from HD and COVID-19 patients were purified and stained for SARS-CoV-2 nucleocapsid (N) (n=5) (a-d) or dsRNA (J2 antibody) (n=4) (e-h) and ASC. Shown are representative imaging flow cytometry images (a,e), quantification of percentage of cells that were infected by N (b) or J2 (f) staining, percentage of uninfected or infected cells (by J2 or N staining) that showed ASC specks (c, g) or percentage of cells with or without ASC specks that showed N (d) or J2 (h) staining, i-k, Lung autopsy samples from 4 COVID-19 patients and a control trauma victim without lung disease were stained for N (green), ASC (red), CD 14 (magenta) and DAPI (blue), i, Digital scanner images of trauma patient (left) and a representative COVID-19 (middle) lung sample showing magnified image of representative infected CD14+ (top) and CD14 (bottom) cells from the COVID-19 sample (right). j, Representative confocal microscopy images of infected CD14+ cells from COVID-19 patients. k, Quantification of N and ASC specks in CD14+ and CD14 cells from COVID-19 lungs (n=4). Scale bar, 7 μm (a,e,j). BF, brightfield. Mean ± S.E.M. is shown. *p<0.05, **p<0.01, ***p<0.001 by nonparametric unpaired t-test (Mann-Whitney or Kolmogorov-Smirnov).
Figure 4.
Figure 4.. Healthy donor monocytes take up antibody-opsonized SARS-CoV2 via the Fc receptor CD16, begin viral replication but do not produce infectious virus
Healthy donor (HD, n=3) monocytes were primed with LPS, infected with icSARS-CoV-2-mNG and stained 48 h later for nucleocapsid (N) or dsRNA (J2) and ASC. Before infection, virus was preincubated with IgG1 isotype control mAb114, non-neutralizing anti-spike (C1A-H12) or neutralizing anti-RBD (C1A-B12) or with pooled COVID-19 patient plasma. Antibodies or plasma were present throughout the culture. a,b, Representative imaging flow cytometry images of (I) uninfected monocytes, (II) N or J2 staining cells without detectable Neon green (NG), or (III) with NG and N or J2 staining. c-f, Quantification of HD monocyte staining for N (c), J2 (d) NG (e) or ASC specks (f). g,h, Percentage of J2+ (g) and NG+ (h) cells in LPS-activated HD monocytes after infection with icSARS-CoV-2-mNG virus that was preincubated with COVID-19 pooled plasma that was depleted or not of immunoglobulins using Protein A/G beads. i-l, SARS-CoV-2, preincubated with pooled COVID-19 plasma that was depleted or not of immunoglobulins, was used to infect LPS-treated HD monocytes in the presence of indicated blocking antibodies (i,j) or antiviral drugs (k,l) and infection was assessed 48 h later by flow cytometry detection of N (i,k) or NG (j,l). m,n, qRT-PCR analysis of genomic SARS-CoV-2 N RNA (m) and subgenomic (sg)RNA (n, left) in uninfected or infected HD monocytes, normalized to ACTB mRNA. Infected HEK293T were used as positive control. Agarose gel electrophoresis of ethidium bromide-stained qRT-PCR subgenomic products is shown (n, right). The ~1600 nt band present only in the COVID-19 samples was excised and sequenced and confirmed to represent the subgenomic RNA for the N gene. o, SARS-CoV-2 plaque forming units (PFU) in the culture supernatants of infected monocytes at time 0 and 48 h post infection (hpi) and of infected Vero E6 cells. BF, Brightfield. Scale bar, 7 μm. Mean ± S.E.M. is shown. *p<0.05, **p<0.01, ***p<0.001, ****p<0.0001 by two-way ANOVA with Sidak’s multiple comparisons test (c-f), nonparametric unpaired t-test (g,h) and one-way ANOVA (i-o).

References

    1. Hu B., Guo H., Zhou P. & Shi Z. L. Characteristics of SARS-CoV-2 and COVID-19. Nat Rev Microbiol, doi: 10.1038/s41579-020-00459-7 (2020). - DOI - PMC - PubMed
    1. Moore J. B. & June C. H. Cytokine release syndrome in severe COVID-19. Science 368, 473–474, doi: 10.1126/science.abb8925 (2020). - DOI - PubMed
    1. Lee S., Channappanavar R. & Kanneganti T. D. Coronaviruses: Innate Immunity, Inflammasome Activation, Inflammatory Cell Death, and Cytokines. Trends Immunol 41, 1083–1099, doi: 10.1016/j.it.2020.10.005 (2020). - DOI - PMC - PubMed
    1. Del Valle D. M. et al. An inflammatory cytokine signature predicts COVID-19 severity and survival. Nat Med 26, 1636–1643, doi: 10.1038/s41591-020-1051-9 (2020). - DOI - PMC - PubMed
    1. Zhou F. et al. Clinical course and risk factors for mortality of adult inpatients with COVID-19 in Wuhan, China: a retrospective cohort study. Lancet 395, 1054–1062, doi: 10.1016/S0140-6736(20)30566-3 (2020). - DOI - PMC - PubMed

Methods-only References

    1. Burgess S. et al. Guidelines for performing Mendelian randomization investigations. Wellcome Open Res 4, 186, doi: 10.12688/wellcomeopenres.15555.2 (2019). - DOI - PMC - PubMed
    1. R: A language and environment for statistical computing (R Foundation for Statistical Computing, 2020).
    1. Hemani G. et al. The MR-Base platform supports systematic causal inference across the human phenome. Elife 7, doi: 10.7554/eLife.34408 (2018). - DOI - PMC - PubMed
    1. Kamat M. A. et al. PhenoScanner V2: an expanded tool for searching human genotype-phenotype associations. Bioinformatics 35, 4851–4853, doi : 10.1093/bioinformatics/btz469 (2019). - DOI - PMC - PubMed
    1. Staley J. R. et al. PhenoScanner: a database of human genotype-phenotype associations. Bioinformatics 32, 3207–3209, doi: 10.1093/bioinformatics/btw373 (2016). - DOI - PMC - PubMed

Publication types

LinkOut - more resources