

US Health Care Spending by Race and Ethnicity, 2002-2016
- PMID: 34402829
- PMCID: PMC8371574
- DOI: 10.1001/jama.2021.9937
US Health Care Spending by Race and Ethnicity, 2002-2016
Abstract
Importance: Measuring health care spending by race and ethnicity is important for understanding patterns in utilization and treatment.
Objective: To estimate, identify, and account for differences in health care spending by race and ethnicity from 2002 through 2016 in the US.
Design, setting, and participants: This exploratory study included data from 7.3 million health system visits, admissions, or prescriptions captured in the Medical Expenditure Panel Survey (2002-2016) and the Medicare Current Beneficiary Survey (2002-2012), which were combined with the insured population and notified case estimates from the National Health Interview Survey (2002; 2016) and health care spending estimates from the Disease Expenditure project (1996-2016).
Exposure: Six mutually exclusive self-reported race and ethnicity groups.
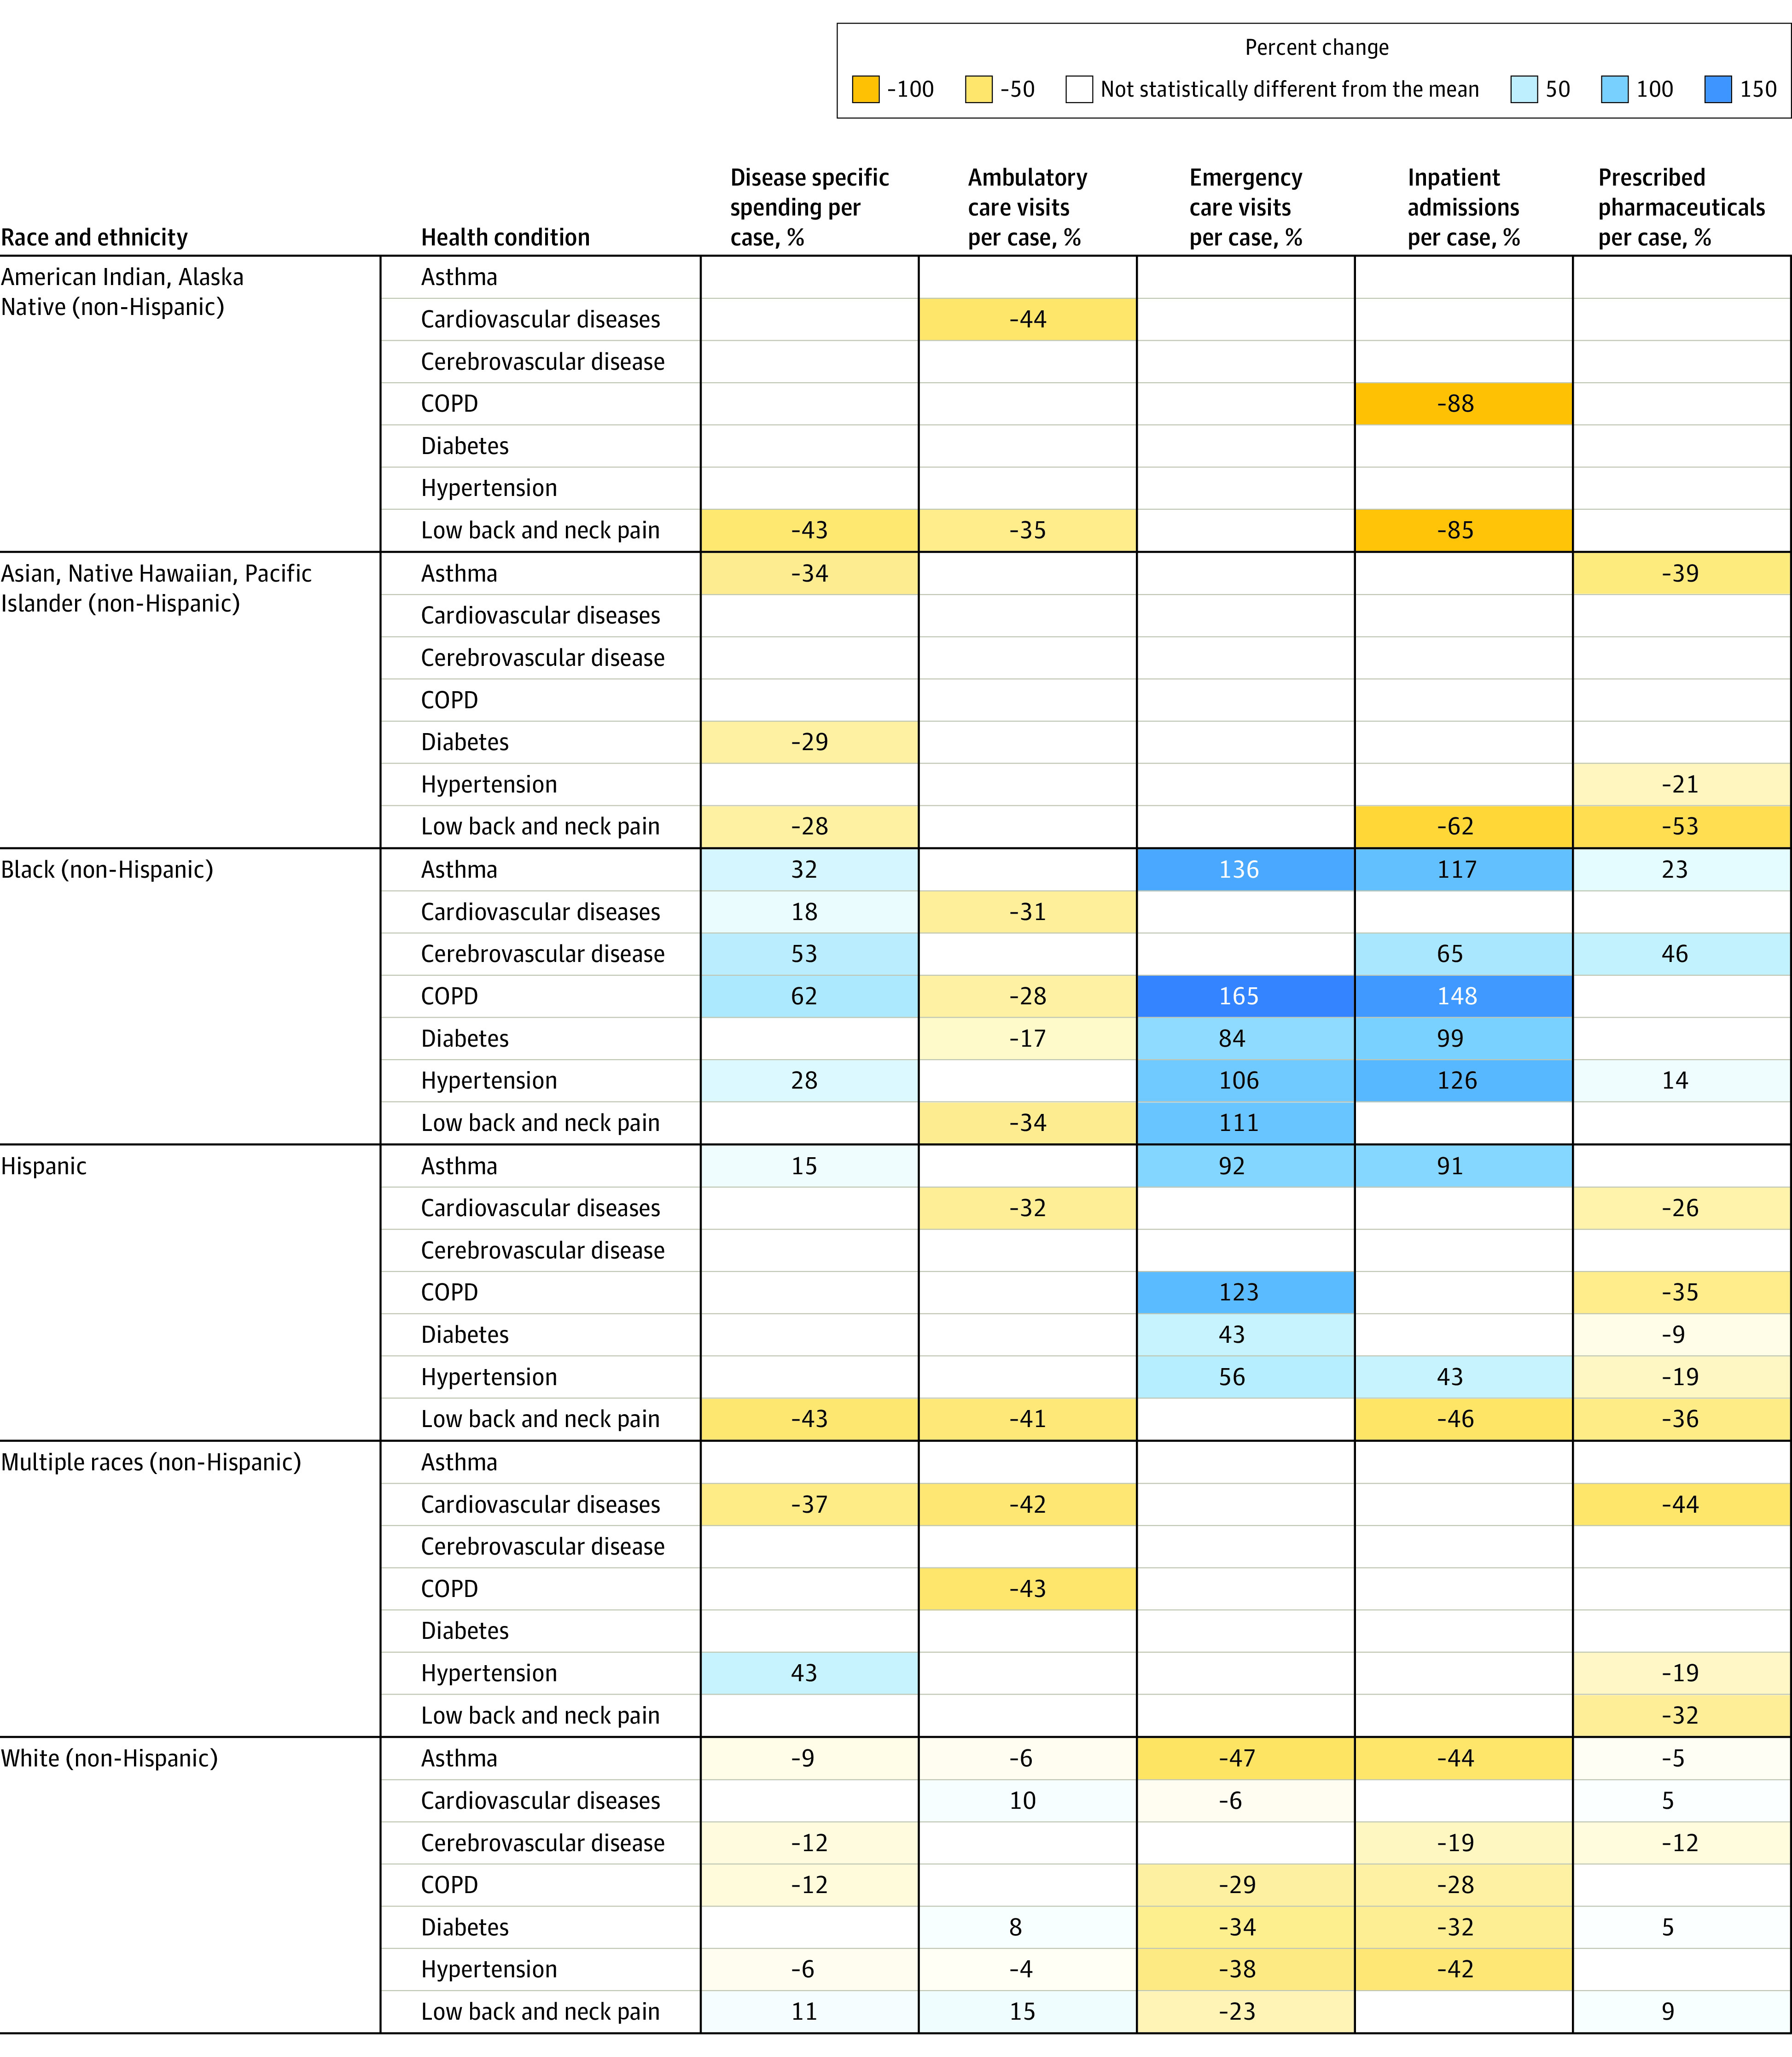
Main outcomes and measures: Total and age-standardized health care spending per person by race and ethnicity for each year from 2002 through 2016 by type of care. Health care spending per notified case by race and ethnicity for key diseases in 2016. Differences in health care spending across race and ethnicity groups were decomposed into differences in utilization rate vs differences in price and intensity of care.
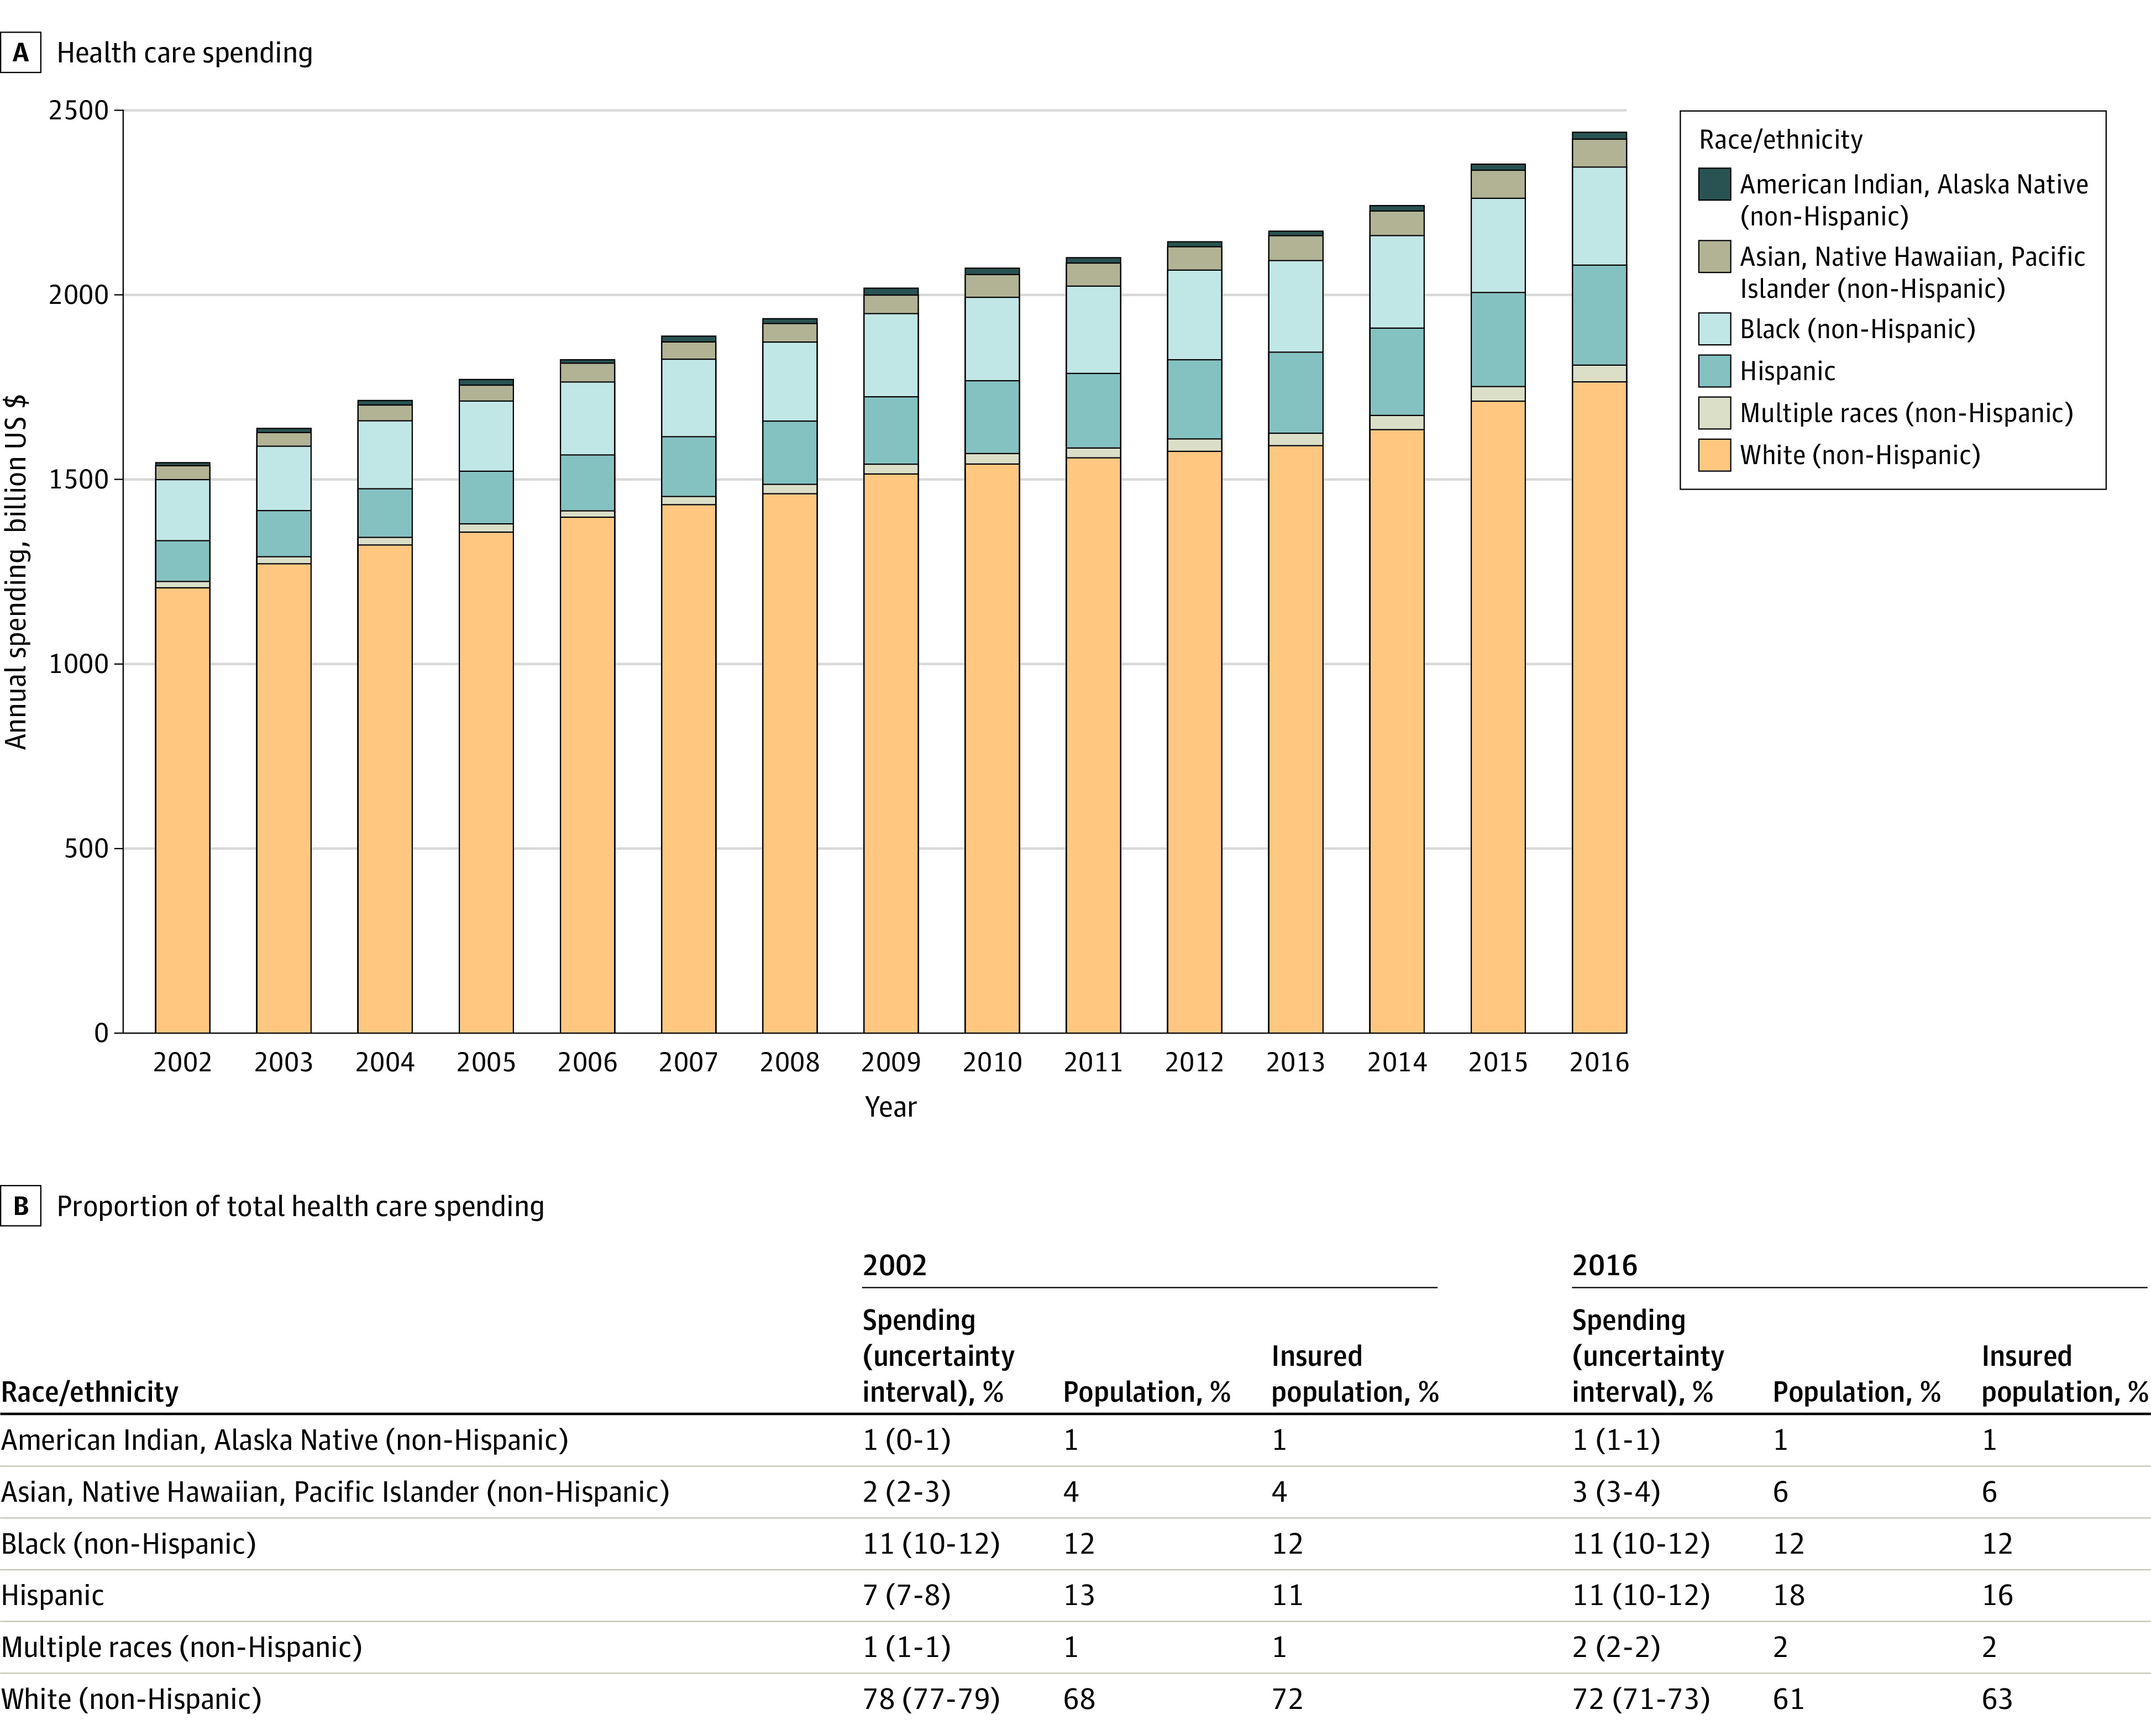
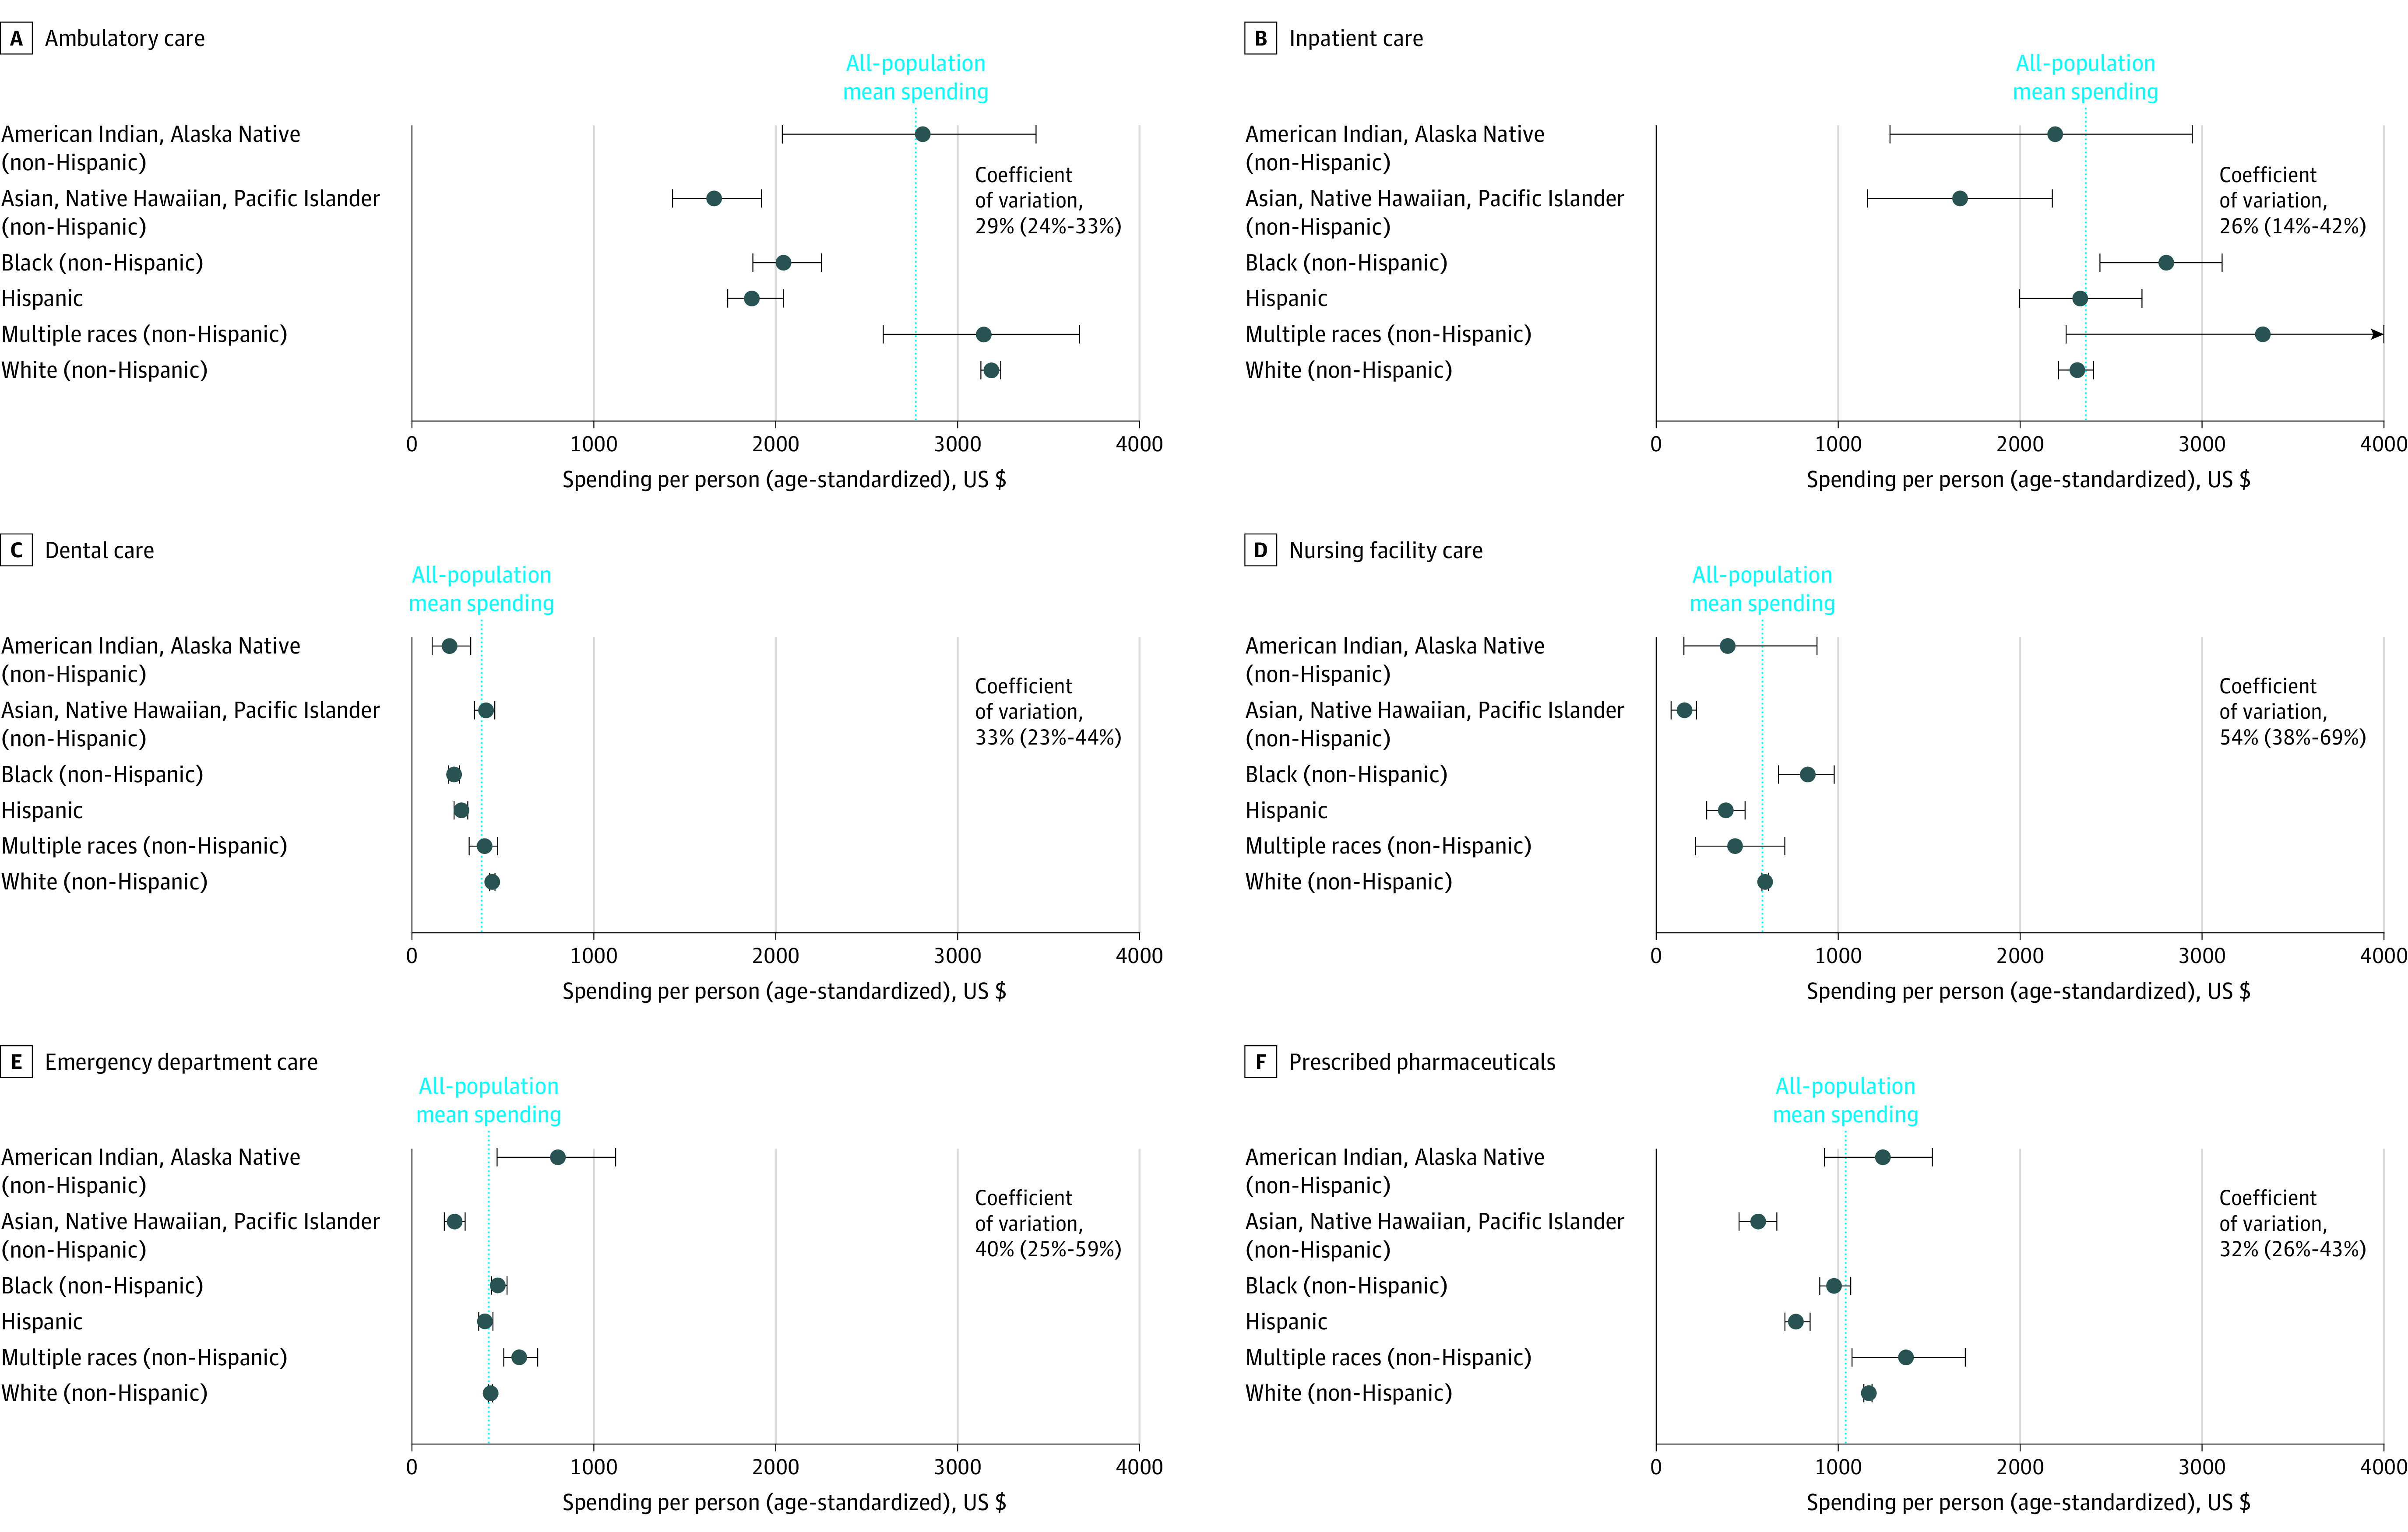
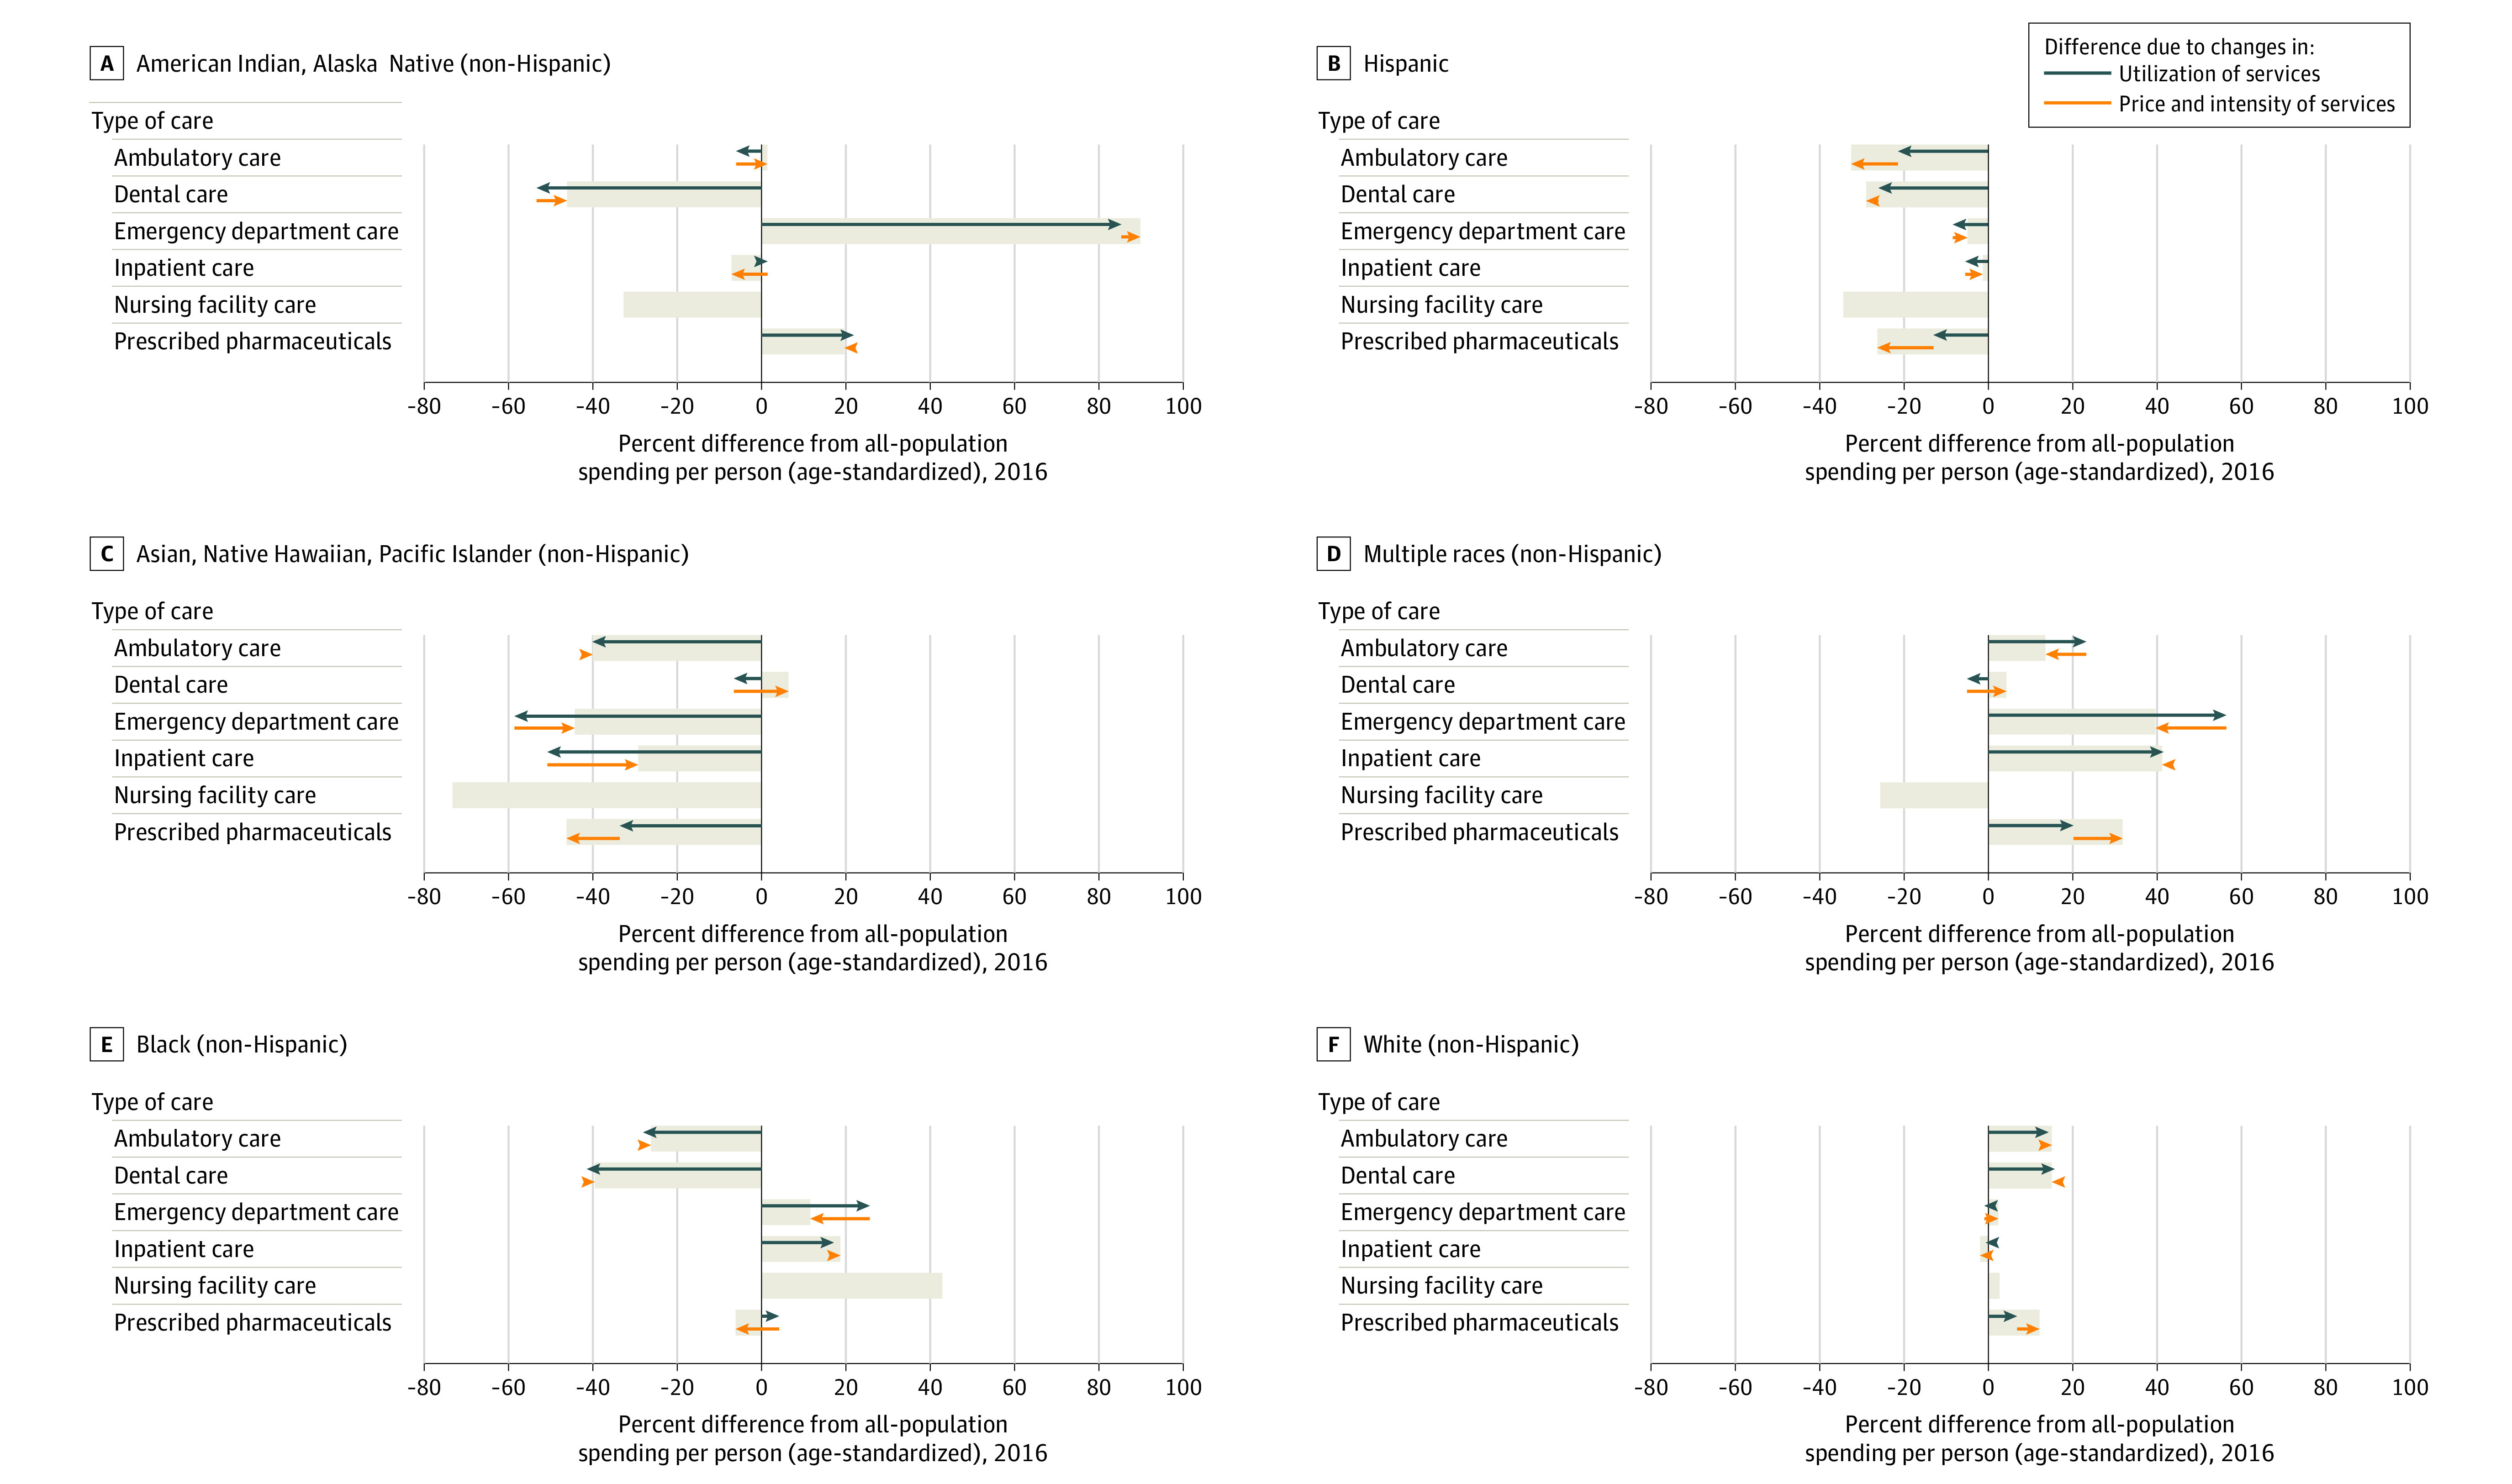
Results: In 2016, an estimated $2.4 trillion (95% uncertainty interval [UI], $2.4 trillion-$2.4 trillion) was spent on health care across the 6 types of care included in this study. The estimated age-standardized total health care spending per person in 2016 was $7649 (95% UI, $6129-$8814) for American Indian and Alaska Native (non-Hispanic) individuals; $4692 (95% UI, $4068-$5202) for Asian, Native Hawaiian, and Pacific Islander (non-Hispanic) individuals; $7361 (95% UI, $6917-$7797) for Black (non-Hispanic) individuals; $6025 (95% UI, $5703-$6373) for Hispanic individuals; $9276 (95% UI, $8066-$10 601) for individuals categorized as multiple races (non-Hispanic); and $8141 (95% UI, $8038-$8258) for White (non-Hispanic) individuals, who accounted for an estimated 72% (95% UI, 71%-73%) of health care spending. After adjusting for population size and age, White individuals received an estimated 15% (95% UI, 13%-17%; P < .001) more spending on ambulatory care than the all-population mean. Black (non-Hispanic) individuals received an estimated 26% (95% UI, 19%-32%; P < .001) less spending than the all-population mean on ambulatory care but received 19% (95% UI, 3%-32%; P = .02) more on inpatient and 12% (95% UI, 4%-24%; P = .04) more on emergency department care. Hispanic individuals received an estimated 33% (95% UI, 26%-37%; P < .001) less spending per person on ambulatory care than the all-population mean. Asian, Native Hawaiian, and Pacific Islander (non-Hispanic) individuals received less spending than the all-population mean on all types of care except dental (all P < .001), while American Indian and Alaska Native (non-Hispanic) individuals had more spending on emergency department care than the all-population mean (estimated 90% more; 95% UI, 11%-165%; P = .04), and multiple-race (non-Hispanic) individuals had more spending on emergency department care than the all-population mean (estimated 40% more; 95% UI, 19%-63%; P = .006). All 18 of the statistically significant race and ethnicity spending differences by type of care corresponded with differences in utilization. These differences persisted when controlling for underlying disease burden.
Conclusions and relevance: In the US from 2002 through 2016, health care spending varied by race and ethnicity across different types of care even after adjusting for age and health conditions. Further research is needed to determine current health care spending by race and ethnicity, including spending related to the COVID-19 pandemic.
Conflict of interest statement
Figures
Comment in
-
Ending Structural Racism in the US Health Care System to Eliminate Health Care Inequities.JAMA. 2021 Aug 17;326(7):613-615. doi: 10.1001/jama.2021.11160. JAMA. 2021. PMID: 34402851 No abstract available.
References
-
- Institute of Medicine . Unequal Treatment: Confronting Racial and Ethnic Disparities in Health Care. The National Academies Press; 2002. - PubMed
Publication types
MeSH terms
Grants and funding
LinkOut - more resources
Full Text Sources
Medical
