

Trends in Differences in Health Status and Health Care Access and Affordability by Race and Ethnicity in the United States, 1999-2018
- PMID: 34402830
- PMCID: PMC8371573
- DOI: 10.1001/jama.2021.9907
Trends in Differences in Health Status and Health Care Access and Affordability by Race and Ethnicity in the United States, 1999-2018
Abstract
Importance: The elimination of racial and ethnic differences in health status and health care access is a US goal, but it is unclear whether the country has made progress over the last 2 decades.
Objective: To determine 20-year trends in the racial and ethnic differences in self-reported measures of health status and health care access and affordability among adults in the US.
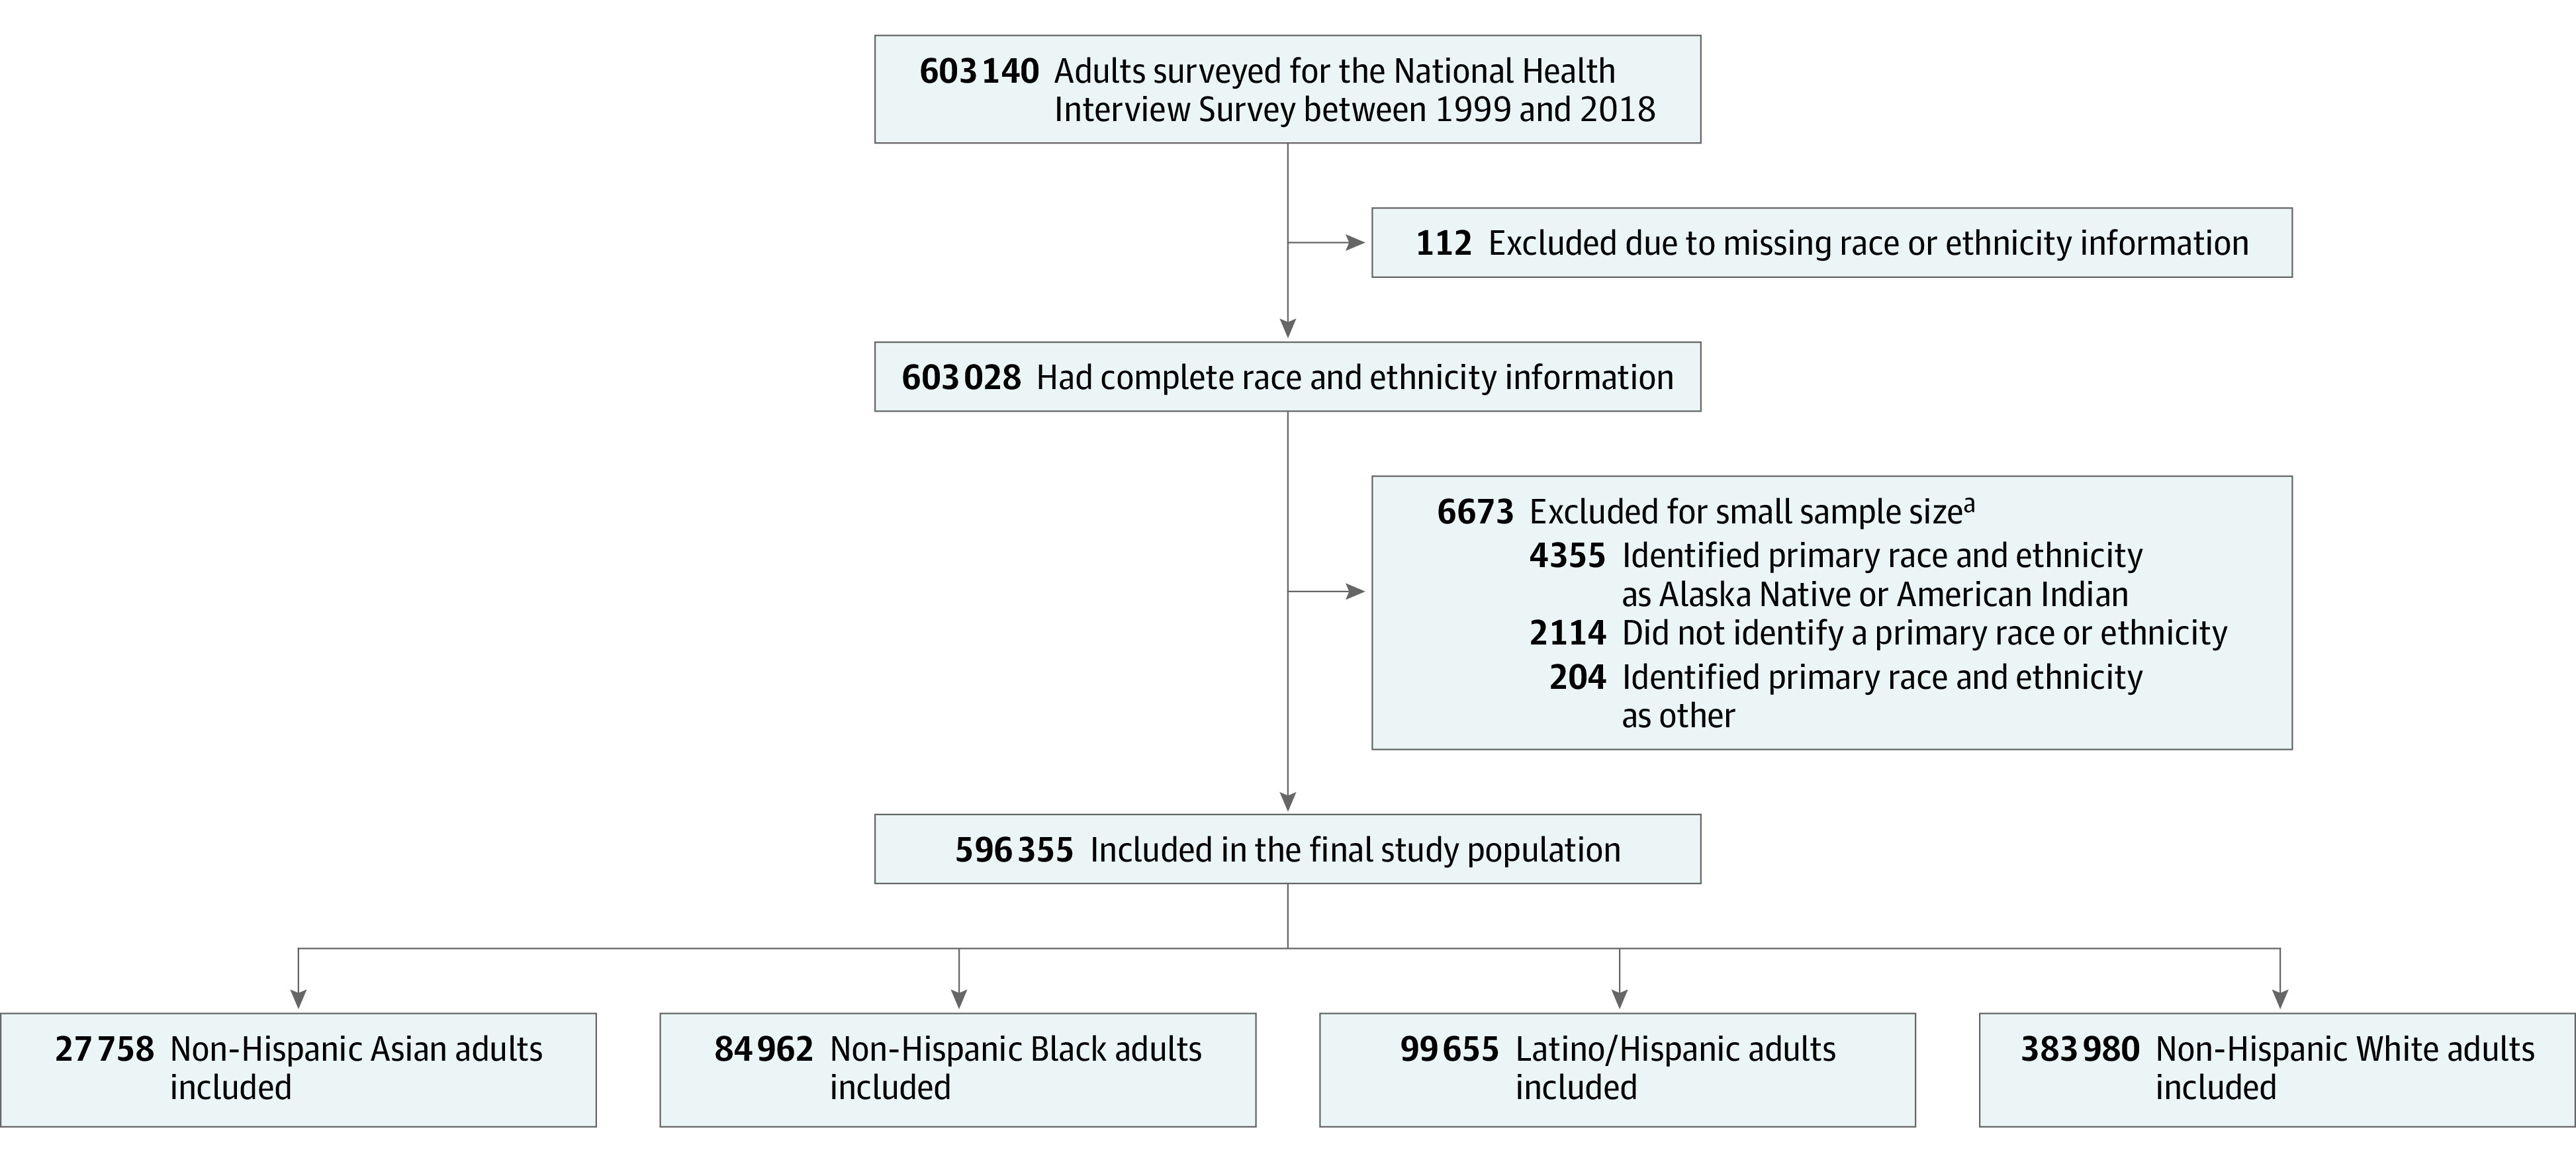
Design, setting, and participants: Serial cross-sectional study of National Health Interview Survey data, 1999-2018, that included 596 355 adults.
Exposures: Self-reported race, ethnicity, and income level.
Main outcomes and measures: Rates and racial and ethnic differences in self-reported health status and health care access and affordability.
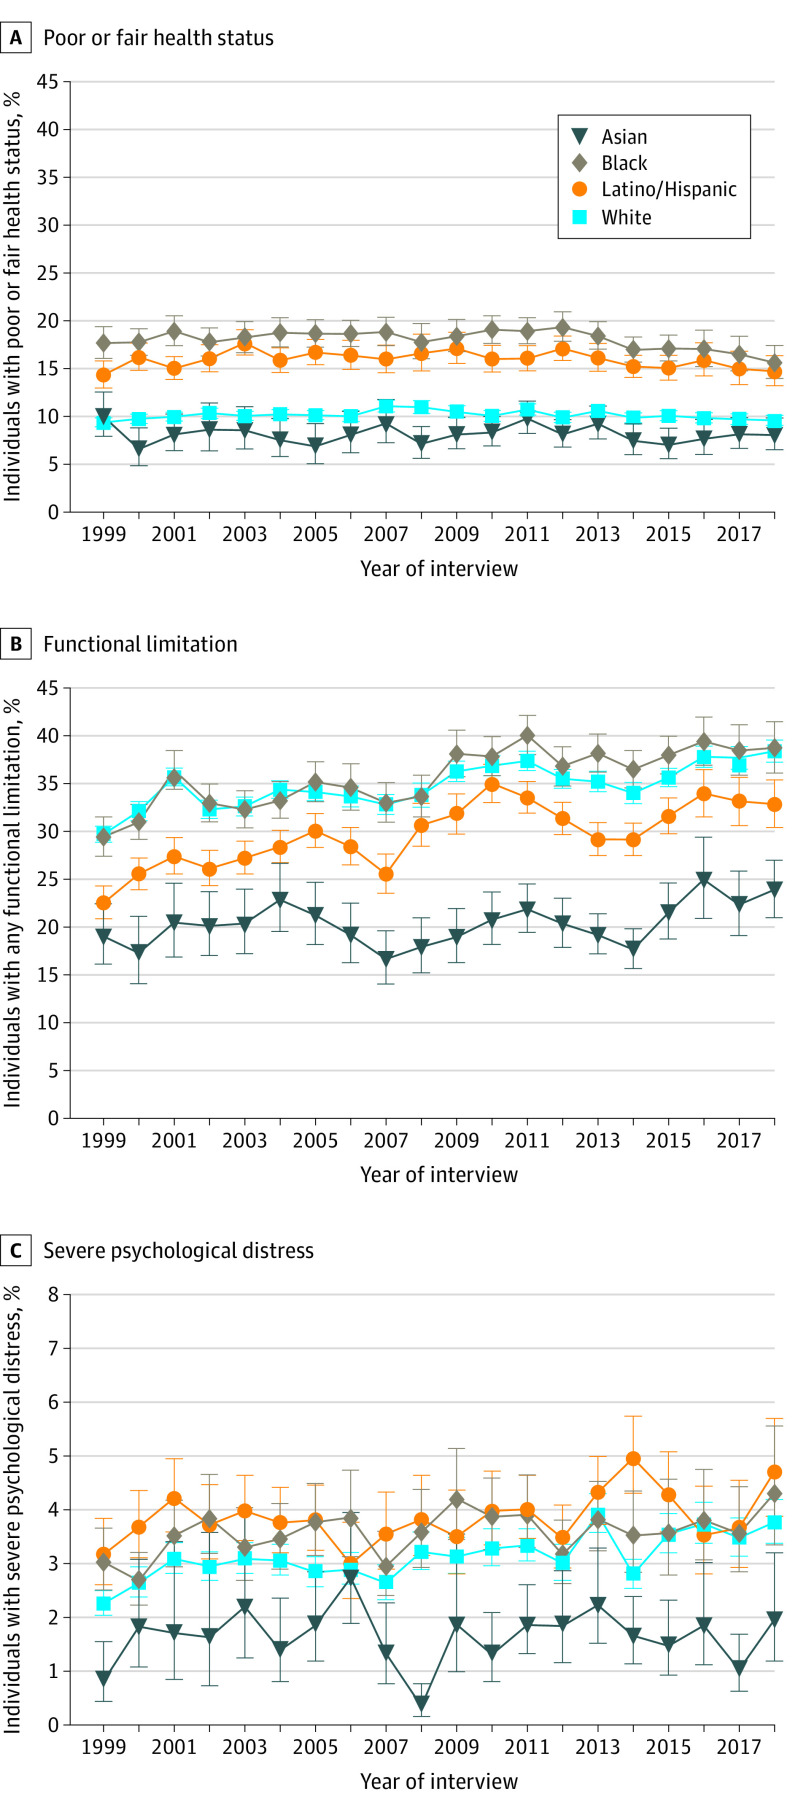
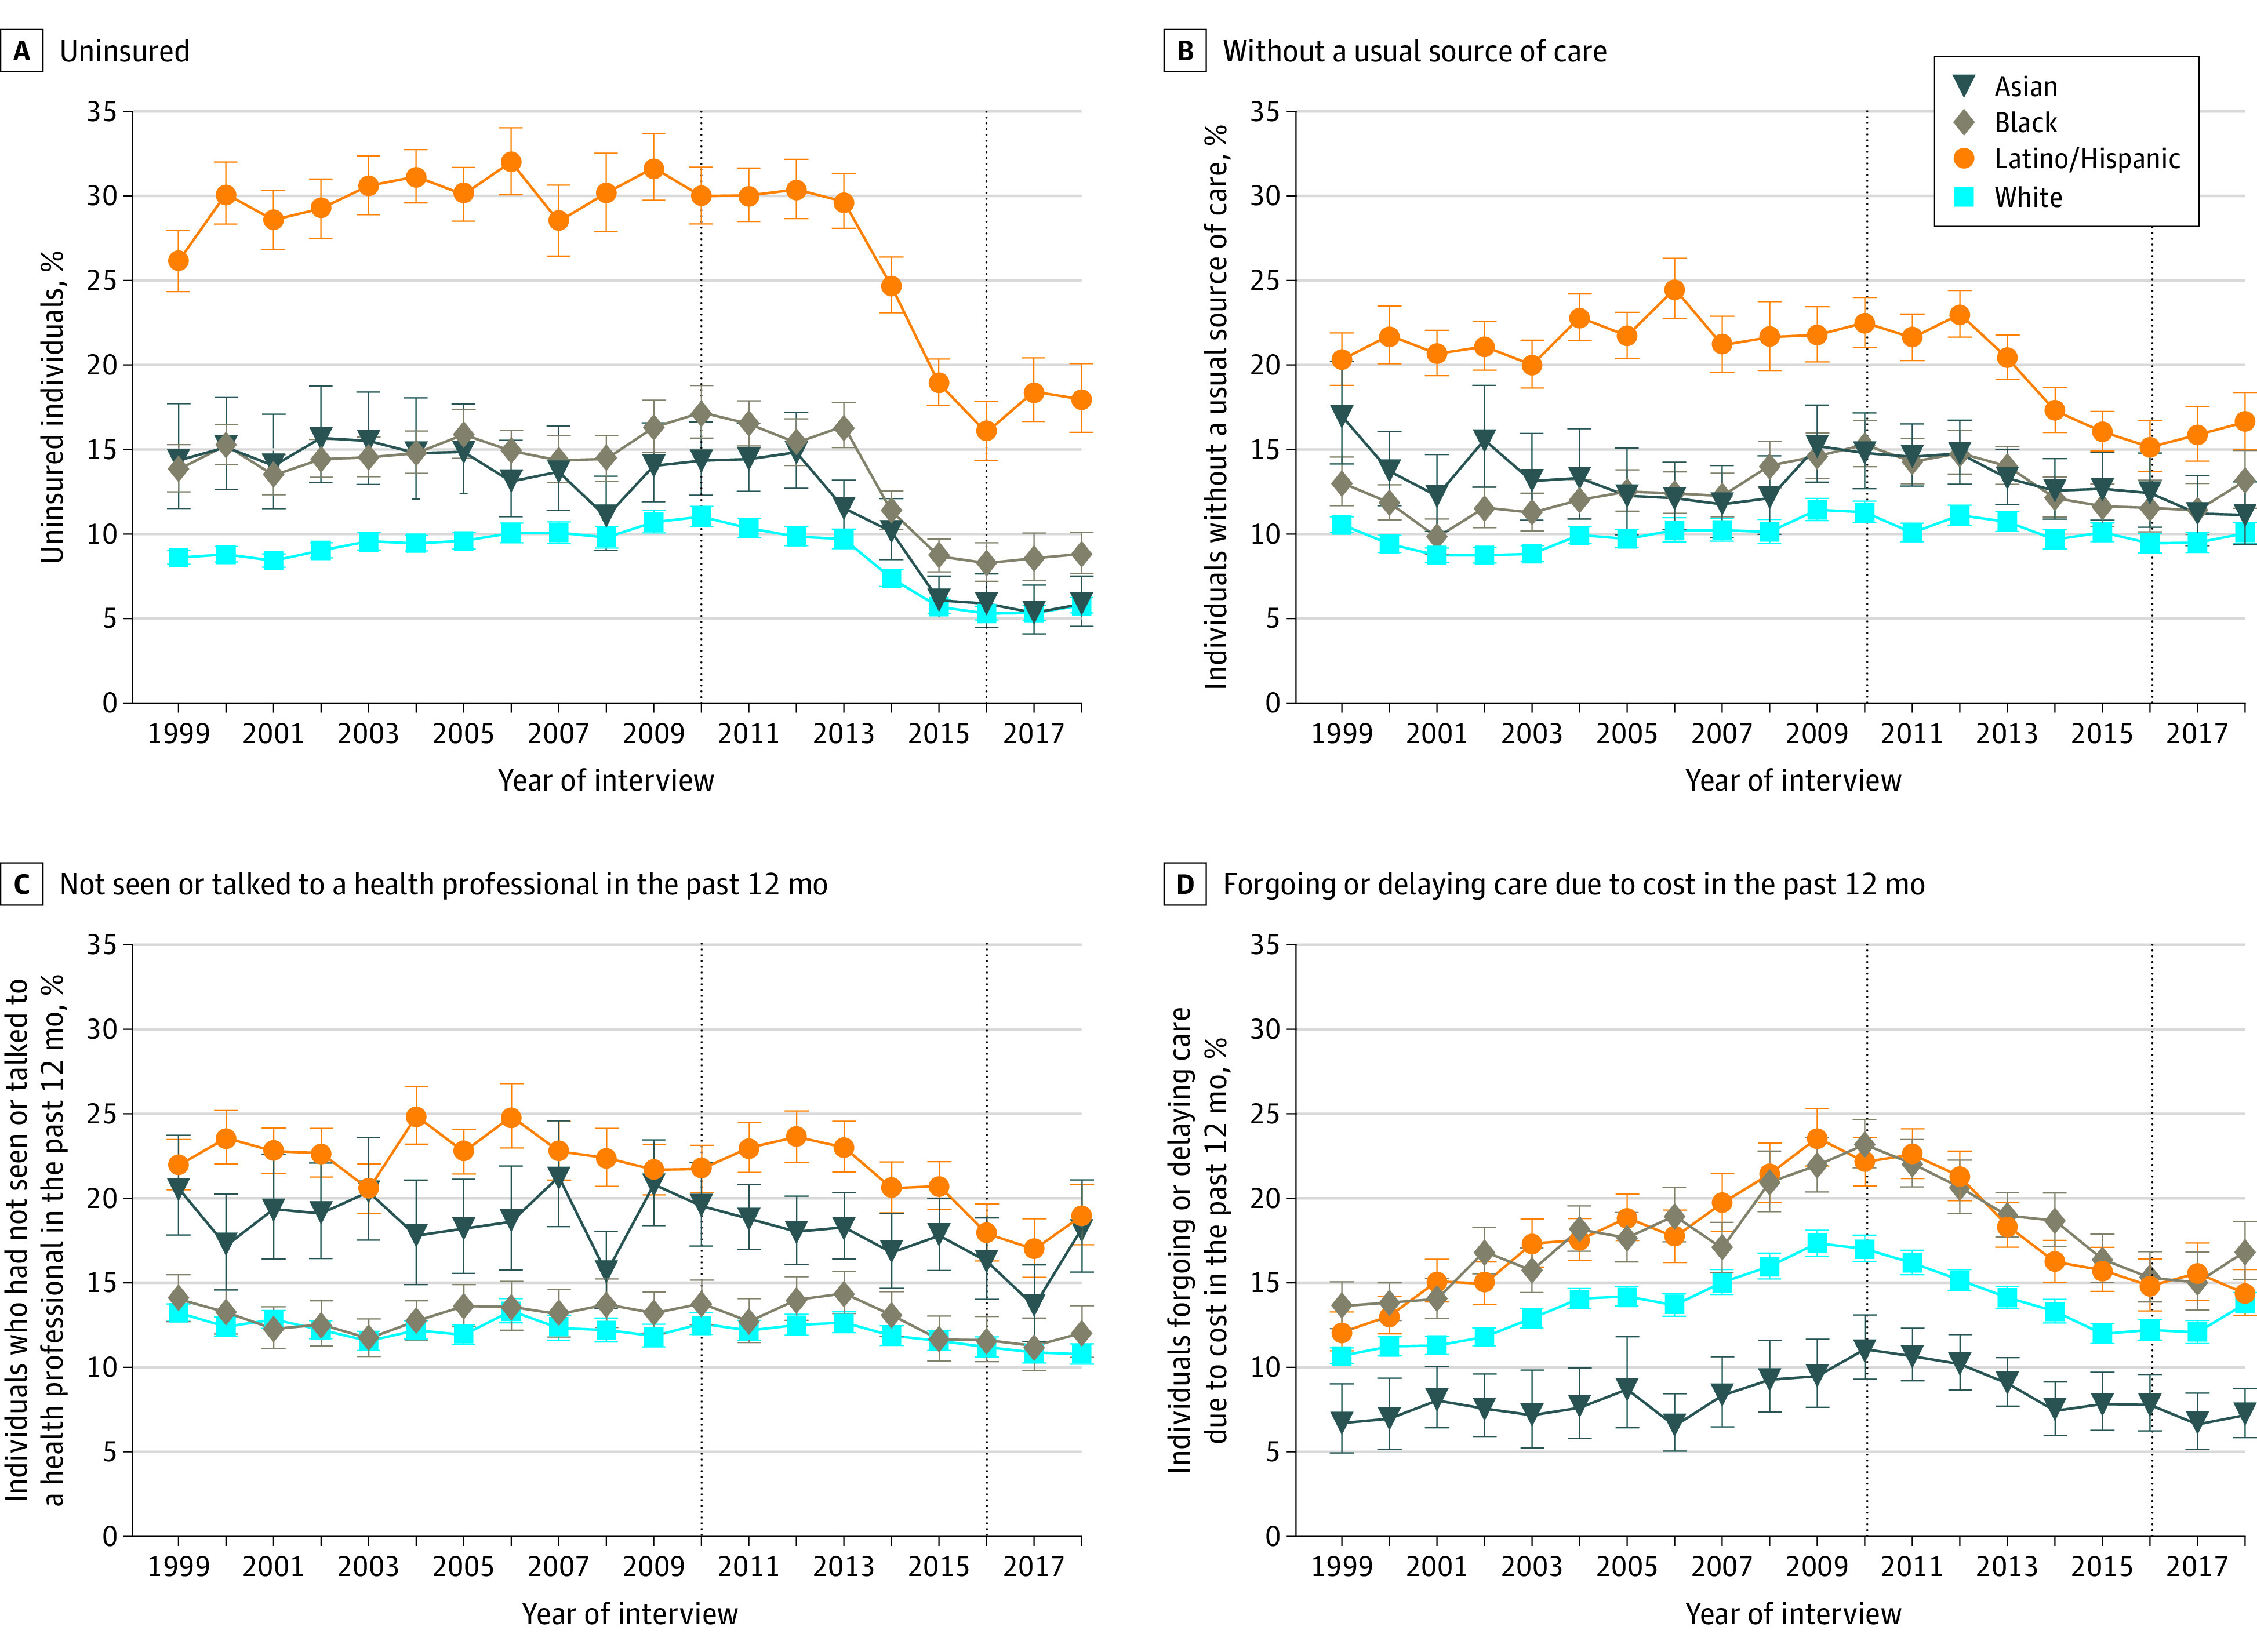
Results: The study included 596 355 adults (mean [SE] age, 46.2 [0.07] years, 51.8% [SE, 0.10] women), of whom 4.7% were Asian, 11.8% were Black, 13.8% were Latino/Hispanic, and 69.7% were White. The estimated percentages of people with low income were 28.2%, 46.1%, 51.5%, and 23.9% among Asian, Black, Latino/Hispanic, and White individuals, respectively. Black individuals with low income had the highest estimated prevalence of poor or fair health status (29.1% [95% CI, 26.5%-31.7%] in 1999 and 24.9% [95% CI, 21.8%-28.3%] in 2018), while White individuals with middle and high income had the lowest (6.4% [95% CI, 5.9%-6.8%] in 1999 and 6.3% [95% CI, 5.8%-6.7%] in 2018). Black individuals had a significantly higher estimated prevalence of poor or fair health status than White individuals in 1999, regardless of income strata (P < .001 for the overall and low-income groups; P = .03 for middle and high-income group). From 1999 to 2018, racial and ethnic gaps in poor or fair health status did not change significantly, with or without income stratification, except for a significant decrease in the difference between White and Black individuals with low income (-6.7 percentage points [95% CI, -11.3 to -2.0]; P = .005); the difference in 2018 was no longer statistically significant (P = .13). Black and White individuals had the highest levels of self-reported functional limitations, which increased significantly among all groups over time. There were significant reductions in the racial and ethnic differences in some self-reported measures of health care access, but not affordability, with and without income stratification.
Conclusions and relevance: In a serial cross-sectional survey study of US adults from 1999 to 2018, racial and ethnic differences in self-reported health status, access, and affordability improved in some subgroups, but largely persisted.
Conflict of interest statement
Figures
Update of
-
Racial and Ethnic Disparities in Health of Adults in the United States: A 20-Year National Health Interview Survey Analysis, 1999-2018.medRxiv [Preprint]. 2020 Nov 4:2020.10.30.20223487. doi: 10.1101/2020.10.30.20223487. medRxiv. 2020. Update in: JAMA. 2021 Aug 17;326(7):637-648. doi: 10.1001/jama.2021.9907. PMID: 33173885 Free PMC article. Updated. Preprint.
-
Racial and Ethnic Disparities in Access to Health Care Among Adults in the United States: A 20-Year National Health Interview Survey Analysis, 1999-2018.medRxiv [Preprint]. 2020 Nov 4:2020.10.30.20223420. doi: 10.1101/2020.10.30.20223420. medRxiv. 2020. Update in: JAMA. 2021 Aug 17;326(7):637-648. doi: 10.1001/jama.2021.9907. PMID: 33173905 Free PMC article. Updated. Preprint.
Comment in
-
Ending Structural Racism in the US Health Care System to Eliminate Health Care Inequities.JAMA. 2021 Aug 17;326(7):613-615. doi: 10.1001/jama.2021.11160. JAMA. 2021. PMID: 34402851 No abstract available.
References
-
- US Department of Health and Human Services . Report of the Secretary’s Task Force on Black and Minority Health. 1985. Accessed March 30, 2021. https://resource.nlm.nih.gov/8602912
-
- US Department of Health and Human Services . About the Office of Minority Health. Accessed March 30, 2021. https://www.minorityhealth.hhs.gov/omh/browse.aspx?lvl=1&lvlid=1
-
- HealthyPeople.org . Disparities. Accessed March 30, 2021. https://www.healthypeople.gov/2020/about/foundation-health-measures/Disp...
-
- Arias E, Xu J. United States life tables, 2018. Natl Vital Stat Rep. 2020;69(12):1-45. - PubMed
