. 2021 Nov 5;22(6):bbab315.
doi: 10.1093/bib/bbab315.

XOmiVAE: an interpretable deep learning model for cancer classification using high-dimensional omics data

Affiliations

XOmiVAE: an interpretable deep learning model for cancer classification using high-dimensional omics data

Eloise Withnell et al. Brief Bioinform. .

Abstract

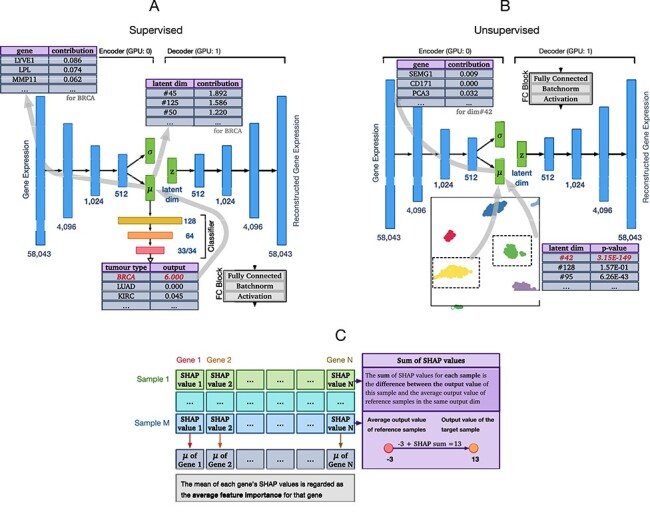
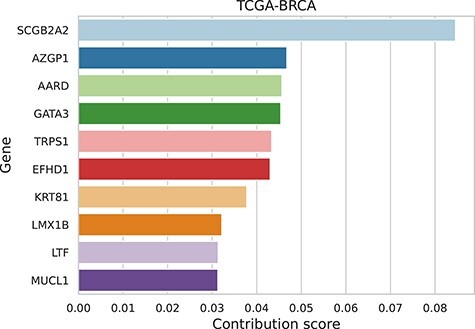
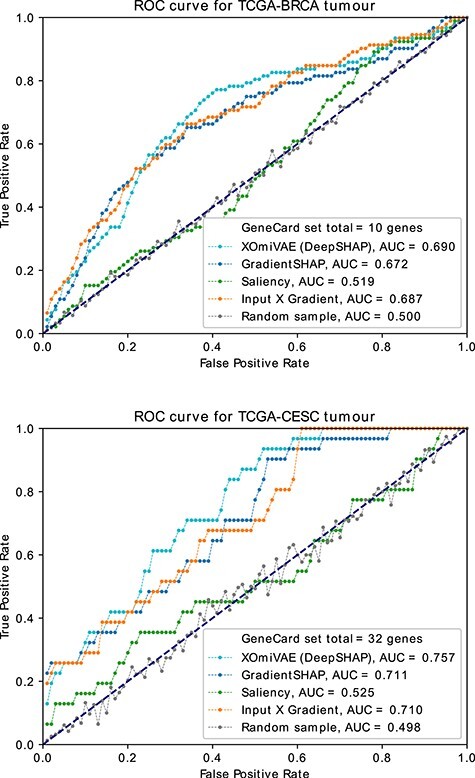
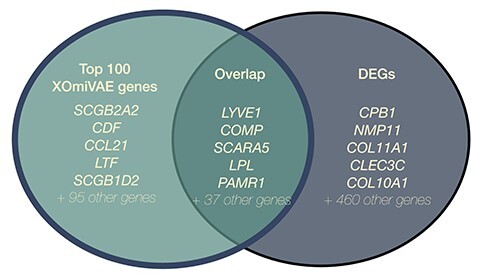
The lack of explainability is one of the most prominent disadvantages of deep learning applications in omics. This 'black box' problem can undermine the credibility and limit the practical implementation of biomedical deep learning models. Here we present XOmiVAE, a variational autoencoder (VAE)-based interpretable deep learning model for cancer classification using high-dimensional omics data. XOmiVAE is capable of revealing the contribution of each gene and latent dimension for each classification prediction and the correlation between each gene and each latent dimension. It is also demonstrated that XOmiVAE can explain not only the supervised classification but also the unsupervised clustering results from the deep learning network. To the best of our knowledge, XOmiVAE is one of the first activation level-based interpretable deep learning models explaining novel clusters generated by VAE. The explainable results generated by XOmiVAE were validated by both the performance of downstream tasks and the biomedical knowledge. In our experiments, XOmiVAE explanations of deep learning-based cancer classification and clustering aligned with current domain knowledge including biological annotation and academic literature, which shows great potential for novel biomedical knowledge discovery from deep learning models.

Keywords: cancer classification; deep learning; explainable artificial intelligence; gene expression; omics data.


Figures

Figure 1
Figure 1
(A) Overall architecture of the XOmiVAE model in the supervised scenario. We can reveal the contribution score of each gene towards each cancer classification, the contribution score of each omics latent dimension learnt by VAE towards each cancer classification and the contribution score of each gene towards each omics latent dimension. The output values and contribution scores listed in the tables are just for demonstration. (B) Overall architecture of the XOmiVAE model in the unsupervised scenario. The importance of each omics latent dimension for separating two selected clusters can be obtained using the Welch’s t-test. The contribution score of each gene can be revealed by the Deep SHAP explanation approach. The P-values and contribution scores listed in the tables are just for demonstration. (C) Illustration of how to appraise the contribution score of each gene. SHAP values were calculated for multiple samples of interest and then averaged to provide the average feature importance for each gene. To the right, we demonstrate that the SHAP values for each sample among different genes sum up to the difference between the average output value of the reference samples and the output value of the sample of interest on the same output dimension, which is another representation of the ‘summation-to-delta’ property.
Figure 2
Figure 2
The top 10 genes for the prediction of breast invasive carcinoma (BRCA). Random samples were used as the reference.
Figure 3
Figure 3
AUC-ROC curves of genes as ranked by the XOmiVAE importance scores, for breast invasive carcinoma (BRCA) and cervical squamous cell carcinoma and endocervical adenocarcinoma (CESC) tumour prediction, against the GeneSet gene list for the respective tumour type. State-of-the-art methods (i.e. Saliency, Input X Gradient and GradientSHAP) and a random selection of genes are used for comparison.
Figure 4
Figure 4
A Venn diagram representing the overlap between the DEGs and top contribution genes, highlighting a total of 42 DEGs found in the top 100 contribution genes.
Figure 5
Figure 5
Violin plot of the latent dimension 78 for female and male samples.
Figure 6
Figure 6
The top 15 genes obtained by XOmiVAE for the classification of BRCA using normal breast tissue samples as the reference.
Figure 7
Figure 7
Top two dimensions for splitting Basal and LumB subtypes in the latent space.

References

    1. Angerer P, Fischer DS, Theis A, et al. . Automatic identification of relevant genes from low-dimensional embeddings of single-cell RNA-seq data. Bioinformatics 2020; 36(15): 4291–5. - PMC - PubMed
    1. Azarkhalili B, Saberi A, Chitsaz H, et al. . DeePathology: deep multi-task learning for inferring molecular pathology from cancer transcriptome. Sci Rep 2019; 9(1): 16526. - PMC - PubMed
    1. Azodi CB, Tang J, Shiu SH. Opening the black box: interpretable machine learning for geneticists. Trends Genet 2020; 36(6): 442–55. - PubMed
    1. Bica I, Andrés-Terré H, Cvejic A, et al. . Unsupervised generative and graph representation learning for modelling cell differentiation. Sci Rep 2020; 10(1): 9790. - PMC - PubMed
    1. Carney EF. Evolving risks of umod variants. Nat Rev Nephrol 2016; 12(5): 257–7. - PubMed

Publication types

MeSH terms

Substances