

Clinical Implications of Inter- and Intratumor Heterogeneity of Immune Cell Markers in Lung Cancer
- PMID: 34402912
- PMCID: PMC8826638
- DOI: 10.1093/jnci/djab157
Clinical Implications of Inter- and Intratumor Heterogeneity of Immune Cell Markers in Lung Cancer
Abstract
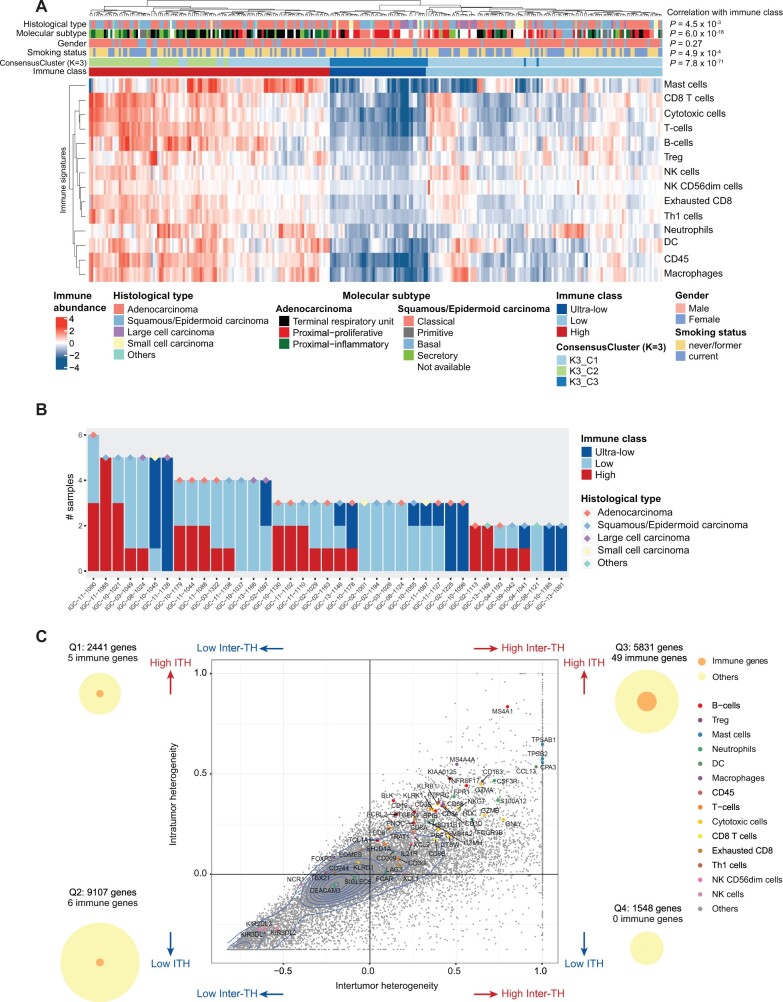
Background: Immune cell transcriptome signatures have been widely used to study the lung tumor microenvironment (TME). However, it is unclear to what extent the immune cell composition in the lung TME varies across histological and molecular subtypes (intertumor heterogeneity [inter-TH]) and within tumors (intratumor heterogeneity [ITH]) and whether ITH has any prognostic relevance.
Methods: Using RNA sequencing in 269 tumor samples from 160 lung cancer patients, we quantified the inter-TH of immune gene expression and immune cell abundance and evaluated the association of median immune cell abundance with clinical and pathological features and overall survival. In 39 tumors with 132 multiregion samples, we also analyzed the ITH of immune cell abundance in relation to overall survival using a variance-weighted multivariate Cox model not biased by the number of samples per tumor.
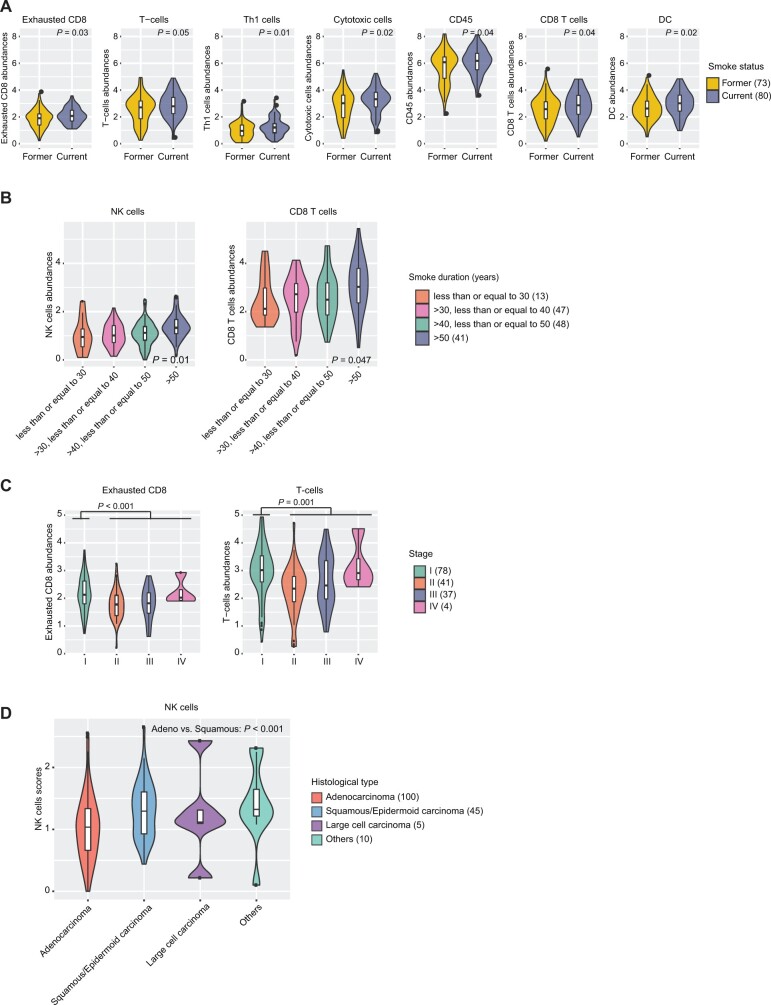
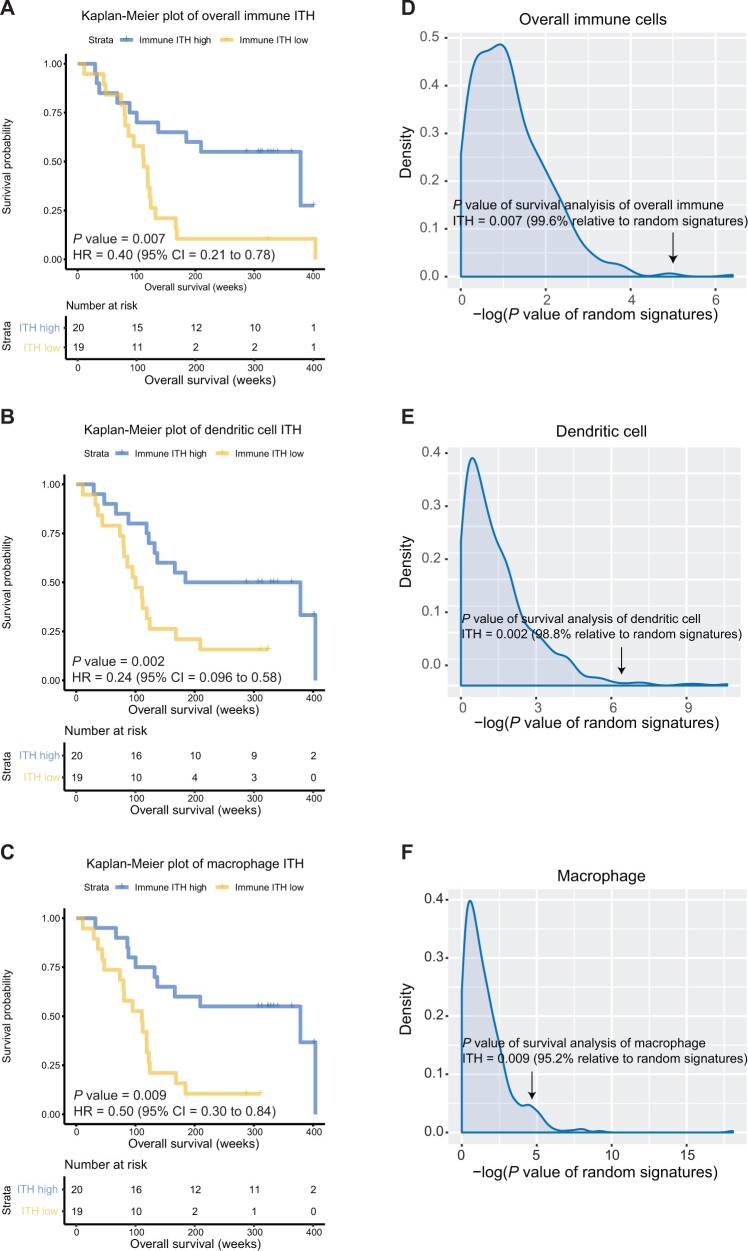
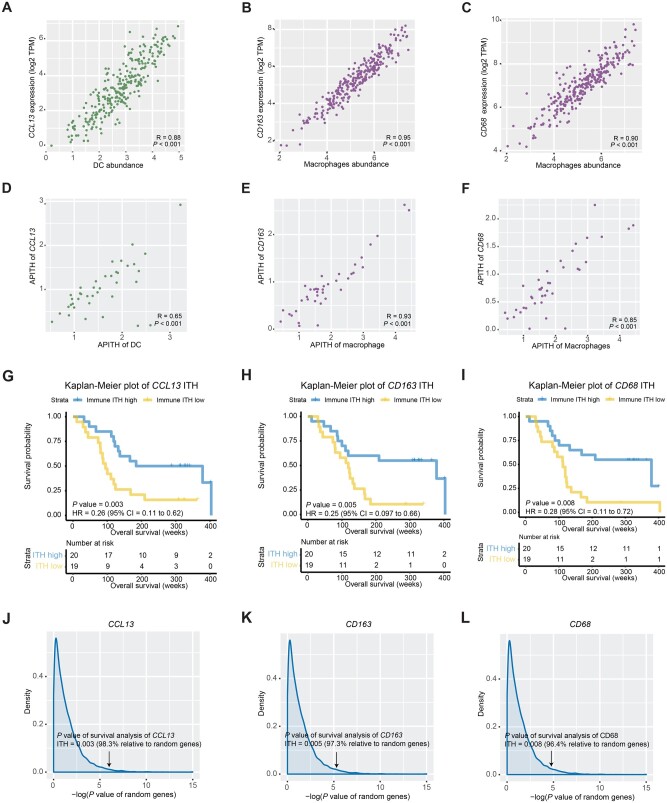
Results: Substantial inter-TH of 14 immune cell types was observed even within the same histological and molecular subtypes, but early stage tumors had higher lymphocyte infiltration across all tumor types. In multiregion samples, an unbiased estimate of low ITH of overall immune cell composition (hazard ratio [HR] = 0.40, 95% confidence interval [CI] = 0.21 to 0.78; P = .007), dendritic cells (HR = 0.24, 95% CI = 0.096 to 0.58; P = .002), and macrophages (HR = 0.50, 95% CI = 0.30 to 0.84; P = .009) was strongly associated with poor survival. The ITH of 3 markers, including CD163 and CD68 (macrophages) and CCL13 (dendritic cells), was enough to characterize the ITH of the corresponding immune cell abundances and its association with overall survival.
Conclusion: This study suggests that lack of immune cell diversity may facilitate tumor evasion and progression. ITH inferred from CCL13, CD163, and CD68 could be used as a prognostic tool in clinical practice.
Published by Oxford University Press 2021. This work is written by US Government employees and is in the public domain in the US.
Figures
Similar articles
-
Analysis of Immune Intratumor Heterogeneity Highlights Immunoregulatory and Coinhibitory Lymphocytes as Hallmarks of Recurrence in Stage I Non-Small Cell Lung Cancer.Mod Pathol. 2023 Jan;36(1):100028. doi: 10.1016/j.modpat.2022.100028. Mod Pathol. 2023. PMID: 36788067 Free PMC article.
-
Differential impact of intratumor heterogeneity (ITH) on survival outcomes in early-stage lung squamous and adenocarcinoma based on tumor mutational burden (TMB).Transl Lung Cancer Res. 2024 Jul 30;13(7):1481-1494. doi: 10.21037/tlcr-24-226. Epub 2024 Jul 17. Transl Lung Cancer Res. 2024. PMID: 39118891 Free PMC article.
-
Intratumor CMS Heterogeneity Impacts Patient Prognosis in Localized Colon Cancer.Clin Cancer Res. 2021 Sep 1;27(17):4768-4780. doi: 10.1158/1078-0432.CCR-21-0529. Epub 2021 Jun 24. Clin Cancer Res. 2021. PMID: 34168047 Free PMC article.
-
Intratumor Heterogeneity as a Prognostic Factor in Solid Tumors: A Systematic Review and Meta-Analysis.Front Oncol. 2021 Oct 15;11:744064. doi: 10.3389/fonc.2021.744064. eCollection 2021. Front Oncol. 2021. PMID: 34722299 Free PMC article.
-
Intratumor heterogeneity: A new perspective on colorectal cancer research.Cancer Med. 2020 Oct;9(20):7637-7645. doi: 10.1002/cam4.3323. Epub 2020 Aug 27. Cancer Med. 2020. PMID: 32853464 Free PMC article. Review.
Cited by
-
APOBEC affects tumor evolution and age at onset of lung cancer in smokers.Nat Commun. 2025 May 21;16(1):4711. doi: 10.1038/s41467-025-59923-8. Nat Commun. 2025. PMID: 40394004 Free PMC article.
-
The Single-Cell Sequencing: A Dazzling Light Shining on the Dark Corner of Cancer.Front Oncol. 2021 Oct 21;11:759894. doi: 10.3389/fonc.2021.759894. eCollection 2021. Front Oncol. 2021. PMID: 34745998 Free PMC article. Review.
-
Cuproptosis and Immune-Related Gene Signature Predicts Immunotherapy Response and Prognosis in Lung Adenocarcinoma.Life (Basel). 2023 Jul 19;13(7):1583. doi: 10.3390/life13071583. Life (Basel). 2023. PMID: 37511958 Free PMC article.
-
Signaling Pathway Inhibitors, miRNA, and Nanocarrier-Based Pharmacotherapeutics for the Treatment of Lung Cancer: A Review.Pharmaceutics. 2021 Dec 8;13(12):2120. doi: 10.3390/pharmaceutics13122120. Pharmaceutics. 2021. PMID: 34959401 Free PMC article. Review.
-
Integration of Single-Cell and Bulk Transcriptomes to Identify a Poor Prognostic Tumor Subgroup to Predict the Prognosis of Patients with Early-stage Lung Adenocarcinoma.J Cancer. 2025 Jan 21;16(4):1397-1412. doi: 10.7150/jca.105926. eCollection 2025. J Cancer. 2025. PMID: 39895784 Free PMC article.
References
Publication types
MeSH terms
LinkOut - more resources
Full Text Sources
Medical
Research Materials
