. 2021 Sep 22;6(18):e149185.
doi: 10.1172/jci.insight.149185.

Th1 polarization defines the synovial fluid T cell compartment in oligoarticular juvenile idiopathic arthritis

Affiliations

Th1 polarization defines the synovial fluid T cell compartment in oligoarticular juvenile idiopathic arthritis

Amélie M Julé et al. JCI Insight. .

Abstract

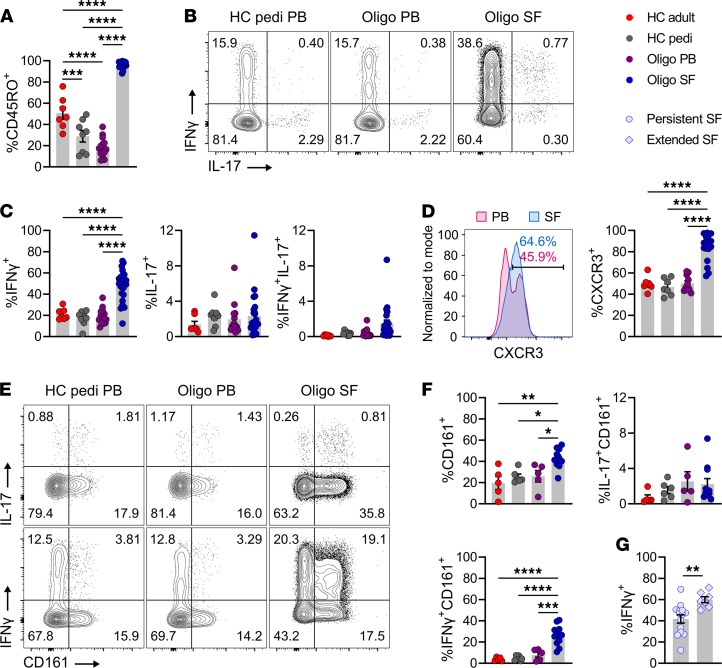
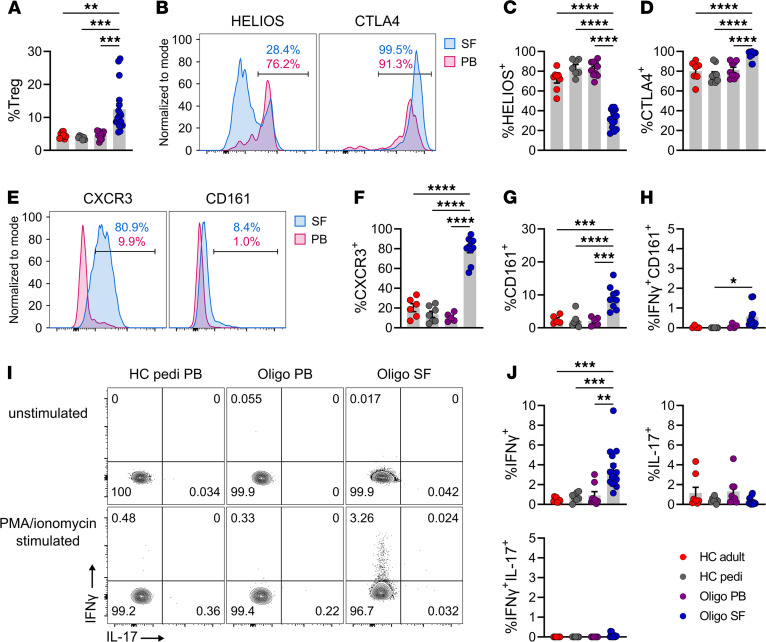
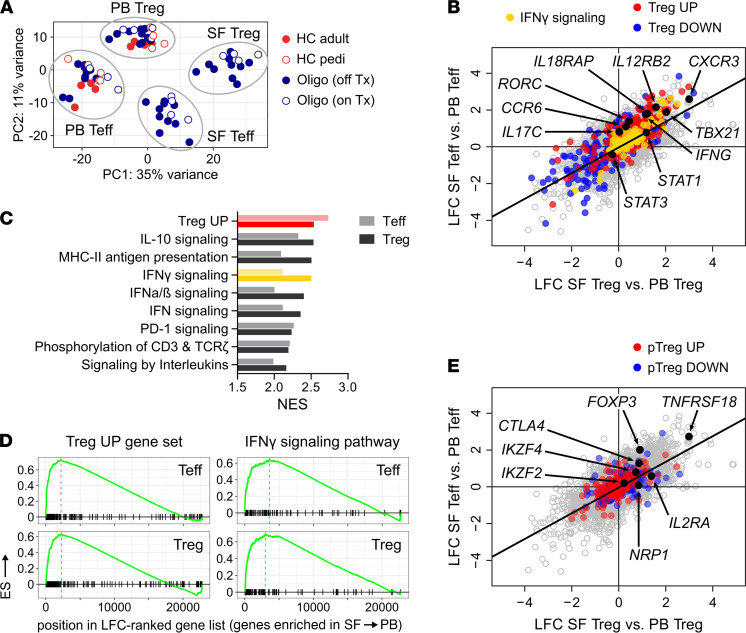
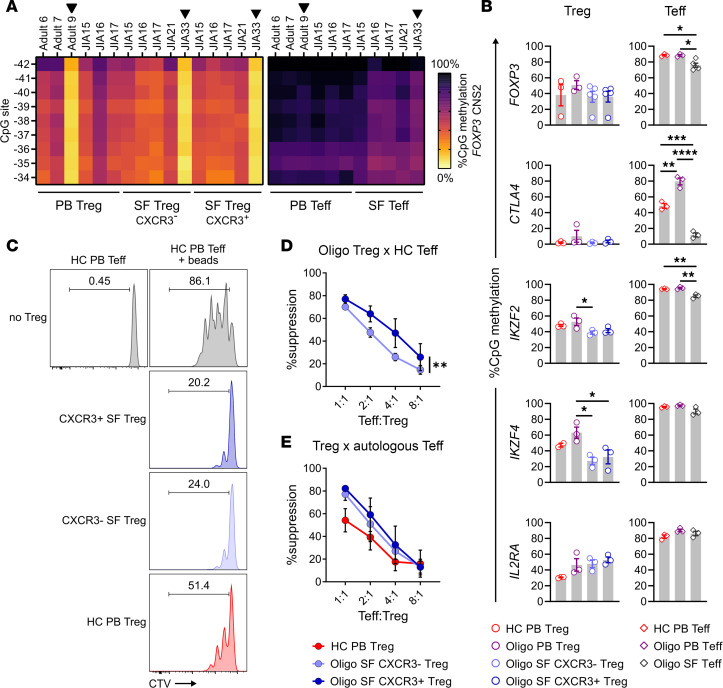
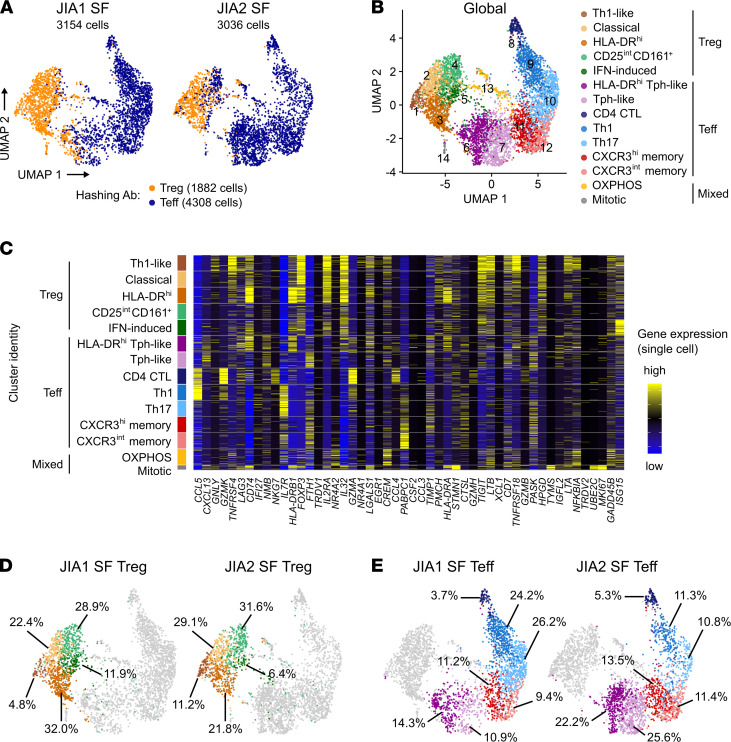
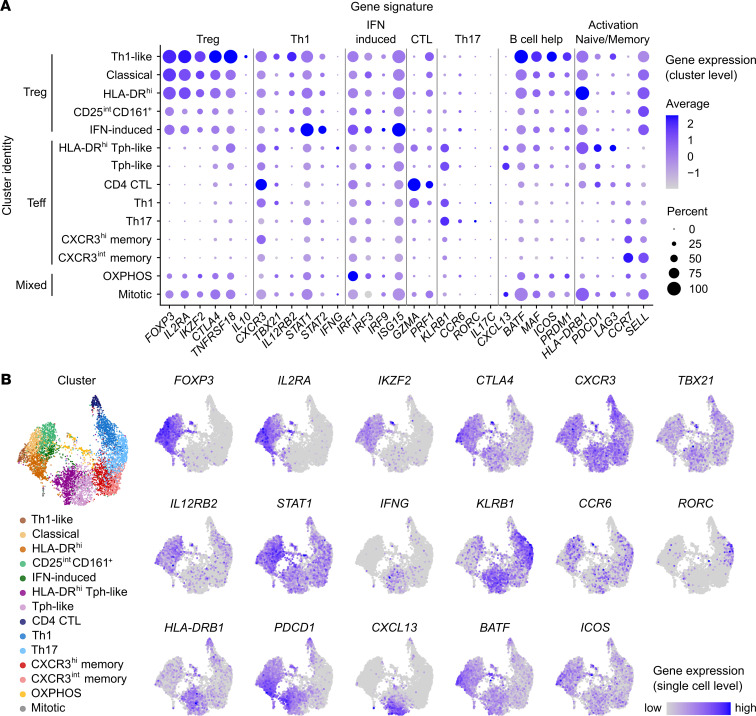
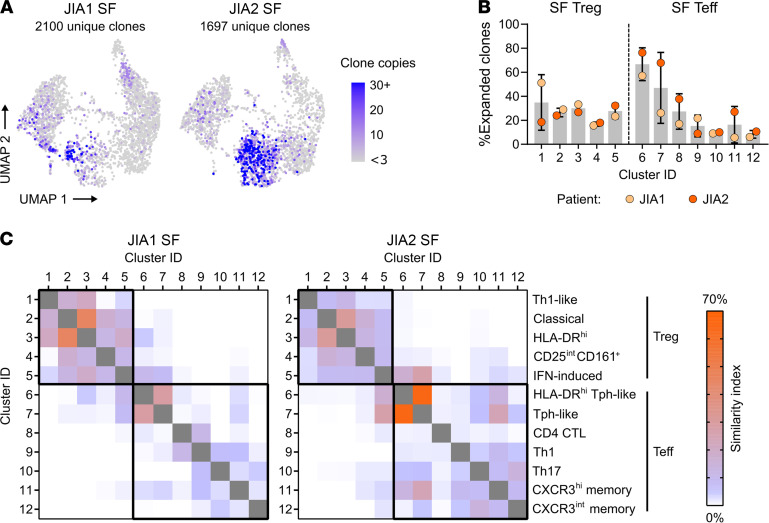
Oligoarticular juvenile idiopathic arthritis (oligo JIA) is the most common form of chronic inflammatory arthritis in children, yet the cause of this disease remains unknown. To understand immune responses in oligo JIA, we immunophenotyped synovial fluid T cells with flow cytometry, bulk RNA-Seq, single-cell RNA-Seq (scRNA-Seq), DNA methylation studies, and Treg suppression assays. In synovial fluid, CD4+, CD8+, and γδ T cells expressed Th1-related markers, whereas Th17 cells were not enriched. Th1 skewing was prominent in CD4+ T cells, including Tregs, and was associated with severe disease. Transcriptomic studies confirmed a Th1 signature in CD4+ T cells from synovial fluid. The regulatory gene expression signature was preserved in Tregs, even those exhibiting Th1 polarization. These Th1-like Tregs maintained Treg-specific methylation patterns and suppressive function, supporting the stability of this Treg population in the joint. Although synovial fluid CD4+ T cells displayed an overall Th1 phenotype, scRNA-Seq uncovered heterogeneous effector and regulatory subpopulations, including IFN-induced Tregs, peripheral helper T cells, and cytotoxic CD4+ T cells. In conclusion, oligo JIA is characterized by Th1 polarization that encompasses Tregs but does not compromise their regulatory identity. Targeting Th1-driven inflammation and augmenting Treg function may represent important therapeutic approaches in oligo JIA.

Keywords: Autoimmunity; Immunology; Rheumatology; T cells; Th1 response.


Conflict of interest statement

Conflict of interest: MBFS received salary support from Childhood Arthritis and Rheumatology Research Alliance (CARRA) and royalties from UpToDate, Inc. PAN has been supported by investigator-initiated research grants from AbbVie, Bristol Myers Squibb, Novartis, Pfizer, and Sobi; consulting from Bristol Myers Squibb, Cerecor, Miach Orthopedics, Novartis, Pfizer, Quench Bio, Sigilon, Simcere, Sobi, and XBiotech; royalties from UpToDate, Inc.; and salary support from CARRA. LAH has received salary support from CARRA and consulting fees from Sobi, Pfizer, and Adaptive Biotechnologies.

Figures

Figure 1
Figure 1. CD4+ memory T cells adopt a Th1 phenotype in the SF of oligo JIA.
(A) Percentage of CD45RO+ cells among CD3+CD4+ lymphocytes. (B) Representative flow staining of cytokine production in stimulated CD3+CD4+CD45RO+ cells (CD4+ Tmem). (C) Percentage of CD4+ Tmem cells expressing IFN-γ, IL-17, or both after stimulation. The PB of adult (n = 7) and pediatric (n = 8) controls and PB (n = 14) and SF (n = 23) of oligo JIA patients were evaluated in A and C. (D) Representative histogram of CXCR3 MFI in paired PB and SF samples from an oligo JIA patient and quantification of CXCR3+ cells among unstimulated CD4+ Tmem cells from HC adult PB (n = 7), HC pediatric PB (n = 7), oligo JIA PB (n = 10), and SF (n = 17). (E) Representative flow staining of CD161 and cytokine production in stimulated cells gated on CD4+ Tmem cells. (F) Percentage of CD161+ cells (unstimulated) and of CD161+ and cytokine dual-expressing cells (stimulated) among CD4+ Tmem cells from HC adult PB (n = 5), HC pediatric PB (n = 6), oligo JIA PB (n = 5), and SF (n = 11). (G) Percentage of CD4+ Tmem cells expressing IFN-γ in SF samples from persistent (n = 14) and extended (n = 7) oligo JIA patients. Summary data on bar graphs are mean ± SEM. *P < 0.05, **P < 0.01, ***P < 0.001, ****P < 0.0001. Statistical testing: (AF) 1-way ANOVA followed by multiple 2-tailed t tests with Tukey’s correction; (G) 2-tailed t test. HC, healthy control; oligo, oligoarticular juvenile idiopathic arthritis; pedi, pediatric; PB, peripheral blood; SF, synovial fluid.
Figure 2
Figure 2. The SF in oligo JIA patients is enriched in Tregs expressing Th1 markers.
(A) Percentage CD25+CD127loFOPX3+ (Tregs) cells among CD4+ lymphocytes in the PB of adult (n = 8) and pediatric (n = 7) controls and in the PB (n = 10) or SF (n = 17) of oligo JIA patients. (B) Representative histogram of HELIOS (unstimulated cells) and CTLA4 (stimulated cells) MFI in paired PB and SF samples from an oligo JIA patient, gated on Tregs. (C) Percentage Tregs expressing HELIOS in HC adult PB (n = 8), HC pediatric PB (n = 7), oligo JIA PB (n = 10), and SF (n = 15). (D) Percentage Tregs expressing CTLA4 after stimulation in HC adult PB (n = 7), HC pediatric PB (n = 9), oligo JIA PB (n = 9), and SF (n = 16). (E) Representative histogram of CXCR3 and CD161 MFI in unstimulated Tregs. (F) Percentage Tregs expressing CXCR3 in HC adult PB (n = 6), HC pediatric PB (n = 7), oligo JIA PB (n = 5), and SF (n = 10). (G) Percentage Tregs expressing CD161 in HC adult PB (n = 5), HC pediatric PB (n = 7), oligo JIA PB (n = 5), and SF (n = 9). (H) Percentage Tregs jointly expressing IFN-γ and CD161 after stimulation in HC adult PB (n = 4), HC pediatric PB (n = 7), oligo JIA PB (n = 4), and SF (n = 10). (I) Representative flow staining of cytokine production in unstimulated and stimulated Tregs. (J) Percentage of Tregs expressing IFN-γ, IL-17, or both cytokines after stimulation in HC adult PB (n = 8), HC pediatric PB (n = 7), oligo JIA PB (n = 8), and SF (n = 16). Summary data on bar graphs are mean ± SEM. *P < 0.05, **P < 0.01, ***P < 0.001, ****P < 0.0001. Statistical testing: 1-way ANOVA followed by multiple 2-tailed t tests with Tukey’s correction. HC, healthy control; pedi, pediatric; oligo, oligoarticular juvenile idiopathic arthritis; PB, peripheral blood; SF, synovial fluid.
Figure 3
Figure 3. Teffs and Tregs in oligo JIA SF upregulate IFN-γ–related genes.
Tregs (CD4+CD25+CD127lo) and Teffs (CD4+CD25) were sorted from paired SF and PB samples of JIA patients (n = 14) and from the PB of pediatric (n = 5) and adult (n = 4) controls. (A) Principal component (PC) plot based on analysis of complete transcriptomes. (B) Log2 fold change (LFC) in gene expression derived from independent differential gene expression analyses of SF Tregs versus PB Tregs (x axis) and SF Teffs versus PB Teffs (y axis). Genes of the IFN-γ signaling pathway (Reactome database) and Treg signature (30) are color-coded. Selected Th1- and Th17-related genes are annotated. (C) Normalized enrichment score (NES) of top hits in gene set enrichment analyses (GSEAs) of Treg and Teff subsets (see Supplemental Table 4 for complete GSEA results). (D) Running enrichment scores for the set of genes upregulated in classical Tregs (30) and for the IFN-γ signaling pathway (Reactome database). (E) LFC in gene expression derived from differential gene expression analysis of Treg (x axis) and Teff (y axis) subsets. Genes of the peripherally induced Treg (pTreg) signature (29) are color-coded. Selected Treg-related genes are annotated. HC, healthy control; pedi, pediatric; oligo, oligoarticular juvenile idiopathic arthritis; Tx, treatment.
Figure 4
Figure 4. Th1-like Tregs maintain Treg-specific demethylation patterns and suppressive function.
(A) Heatmap of methylation at 9 CpG sites in the conserved noncoding sequence 2 (CNS2) region of the FOXP3 locus in sorted Tregs (CD4+CD25+CD127lo) and Teffs (CD4+CD25) from HC adult PB (n = 3) and oligo JIA PB (n = 3) and SF (n = 5). Black arrows highlight male subjects. (B) Percentage methylation (mean ± SEM) at CpG sites across different Treg-related gene loci in sorted Treg and Teff populations. The location of CpG sites for each locus is specified in Supplemental Table 3. IKZF2 encodes for HELIOS and IKZF4 encodes for EOS. (C) Representative histogram of CTV-positive Teffs (CD4+CD25) after 4 days of coculture alone or with anti-CD2/CD3/CD28 beads and the corresponding Treg (CD4+CD25+CD127lo) population at a ratio of 1:1, gated on dividing Teffs. (D) Percentage suppression (mean ± SEM) in the proliferation of Teffs from a third-party control after cocultures with CXCR3+ SF Tregs or CXCR3 SF Tregs (n = 4 controls, n = 7 oligo JIA patients). See Supplemental Figure 4 for detailed representation per patient. (E) Percentage suppression (mean ± SEM) in the proliferation of Teffs from HC PB or oligo SF after cocultures with autologous Tregs (n = 4 controls, n = 4 oligo JIA patients). *P < 0.05, **P < 0.01, ***P < 0.001, ****P < 0.0001. Statistical testing: (B) 1-way ANOVA followed by multiple 2-tailed t tests with Tukey’s correction; (D and E) 2-way ANOVA assessing effect of Treg population and Teff/Treg ratio. HC, healthy control; oligo, oligoarticular juvenile idiopathic arthritis; PB, peripheral blood; SF, synovial fluid; CTV, CellTrace Violet.
Figure 5
Figure 5. ScRNA-Seq reveals heterogeneous subsets of Tregs and Teffs in oligo JIA SF.
Sorted Tregs (CD4+CD25+CD127lo) and Teffs (CD4+CD25) from the SF of 2 oligo JIA patients were studied with 10x Genomics. (A) Uniform manifold approximation and projection (UMAP) of data set, split by patient and color-coded by hashing antibody. (B) UMAP of global data set (both subjects, 6190 cells), color-coded by cluster. (C) Heatmap showing expression of the top 50 most highly variable genes in 100 randomly selected cells from each cluster. (D and E) UMAP highlighting cells in Treg (D) and Teff (E) clusters, split by patient and annotated with the corresponding percentage of cells in each cluster. Clusters were defined as 1) Th1-like Treg, 2) classical Treg, 3) activated/HLA-DRhi Treg, 4) CD25intCD161+ Treg, 5) IFN-induced Treg, 6) activated/HLA-DRhi T peripheral helper–like (Tph-like), 7) Tph-like, 8) CD4+ cytotoxic T lymphocytes (CTLs), 9) Th1 effector memory, 10) Th17 effector memory, 11) CXCR3hi central memory, 12) CXCR3lo central memory, 13) cells undergoing OXPHOS metabolism, 14) mitotic cells. JIA, juvenile idiopathic arthritis; SF, synovial fluid.
Figure 6
Figure 6. Gene expression in Th1-polarized Tregs and Teffs from oligo JIA SF.
Sorted Tregs (CD4+CD25+CD127lo) and Teffs (CD4+CD25) from the SF of 2 oligo JIA patients were studied with 10x Genomics. (A) Cluster-level expression of markers from key immune cell types (Treg, Th1, Th17, CTLs, Tph/B cell helper T cells), states (activation, exhaustion, naive/memory), and pathways (IFN signaling, viral sensing) used to characterize clusters. For each gene and cluster, the size of the dot is proportional to the percentage of cells expressing the gene in that cluster, and the color code illustrates the average level of expression of all cells in the cluster. (B) Expression levels of key Treg-, Th1-, Th17-, and Tph-related genes across the 6190 cells. The global UMAP color-coded by cluster is shown again for reference. For each gene, cells in the top 95% quantile of expression level are color-coded; the bottom 5% appear in gray. Additional genes can be browsed at https://amjule.shinyapps.io/oligo-JIA/ Clusters were defined as 1) Th1-like Treg, 2) classical Treg, 3) activated/HLA-DRhi Treg, 4) CD25intCD161+ Treg, 5) IFN-induced Treg, 6) activated/HLA-DRhi T peripheral helper–like (Tph-like), 7) Tph-like, 8) CD4+ cytotoxic T lymphocytes (CTLs), 9) Th1 effector memory, 10) Th17 effector memory, 11) CXCR3hi central memory, 12) CXCR3lo central memory, 13) cells undergoing OXPHOS metabolism, 14) mitotic cells.
Figure 7
Figure 7. Expanded SF CD4+ T cell clones primarily concentrate in clusters of Tph-like cells.
Sorted Tregs (CD4+CD25+CD127lo) and Teffs (CD4+CD25) from the SF of 2 patients with oligo JIA were evaluated at the single-cell level for T cell receptor (TCR) repertoire analysis with 10x Genomics. (A) UMAP projection split by patient, highlighting clones with 3 copies or more across the data set (expanded). A clone is defined by its paired TCRα and TCRβ chain; cells with missing sequencing data for the α and/or β chain were excluded. (B) Percentage (mean ± SD) of expanded clones (≥3 copies) per cluster and study subject. (C) Similarity in clonotypic composition across clusters for each patient measured with the Morisita-Horn index expressed as a percentage. Clusters are defined as follows: 1) Th1-like Treg, 2) classical Treg, 3) activated/HLA-DRhi Treg, 4) CD25intCD161+ Treg, 5) IFN-induced Treg, 6) activated/HLA-DRhi Tph-like, 7) Tph-like, 8) CD4+ CTLs, 9) Th1 effector memory, 10) Th17 effector memory, 11) CXCR3hi central memory, 12) CXCR3lo central memory. JIA, juvenile idiopathic arthritis; SF, synovial fluid; Tph, T peripheral helper T lymphocytes; CTLs, cytotoxic T lymphocytes; UMAP, uniform manifold approximation and projection.

Comment in

References

    1. Petty RE, et al. International League of Associations for Rheumatology classification of juvenile idiopathic arthritis: second revision, Edmonton, 2001. J Rheumatol. 2004;31(2):390–392. - PubMed
    1. Hinks A, et al. Fine-mapping the MHC locus in juvenile idiopathic arthritis (JIA) reveals genetic heterogeneity corresponding to distinct adult inflammatory arthritic diseases. Ann Rheum Dis. 2017;76(4):765–772. doi: 10.1136/annrheumdis-2016-210025. - DOI - PMC - PubMed
    1. Nigrovic PA, et al. Review: genetics and the classification of arthritis in adults and children. Arthritis Rheumatol. 2018;70(1):7–17. doi: 10.1002/art.40350. - DOI - PMC - PubMed
    1. Oen KG, Cheang M. Epidemiology of chronic arthritis in childhood. Semin Arthritis Rheum. 1996;26(3):575–591. doi: 10.1016/S0049-0172(96)80009-6. - DOI - PubMed
    1. Saurenmann RK, et al. Prevalence, risk factors, and outcome of uveitis in juvenile idiopathic arthritis: a long-term followup study. Arthritis Rheum. 2007;56(2):647–657. doi: 10.1002/art.22381. - DOI - PubMed

Publication types

MeSH terms