. 2021 Sep 24;373(6562):eabj7364.
doi: 10.1126/science.abj7364. Epub 2021 Sep 24.

Vaccine nationalism and the dynamics and control of SARS-CoV-2

Affiliations

Vaccine nationalism and the dynamics and control of SARS-CoV-2

Caroline E Wagner et al. Science. .

Abstract

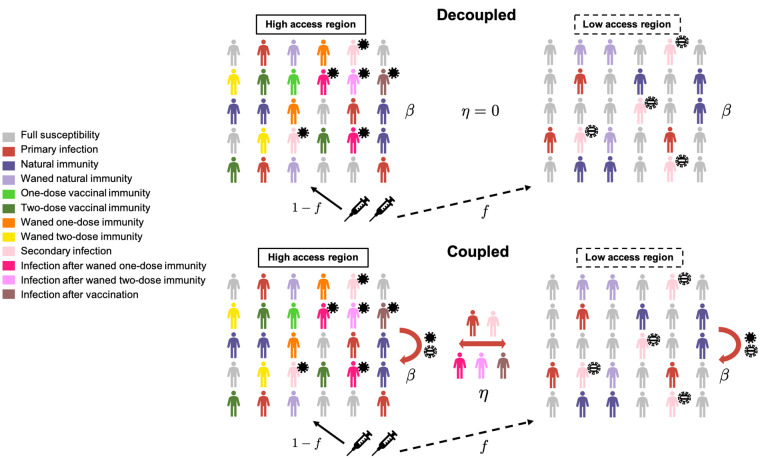
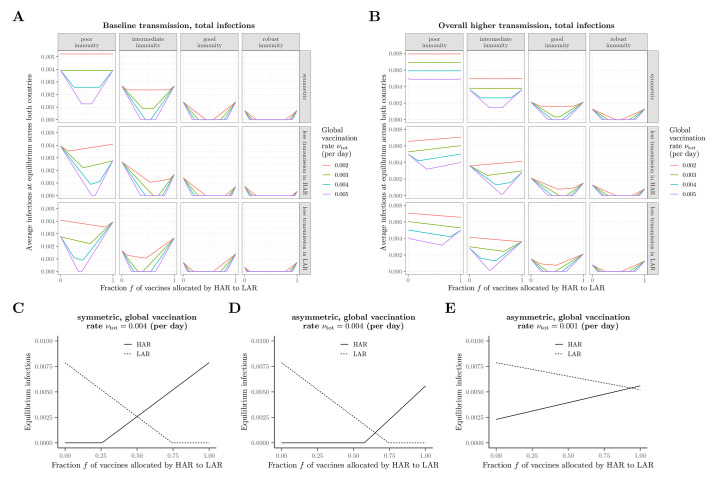
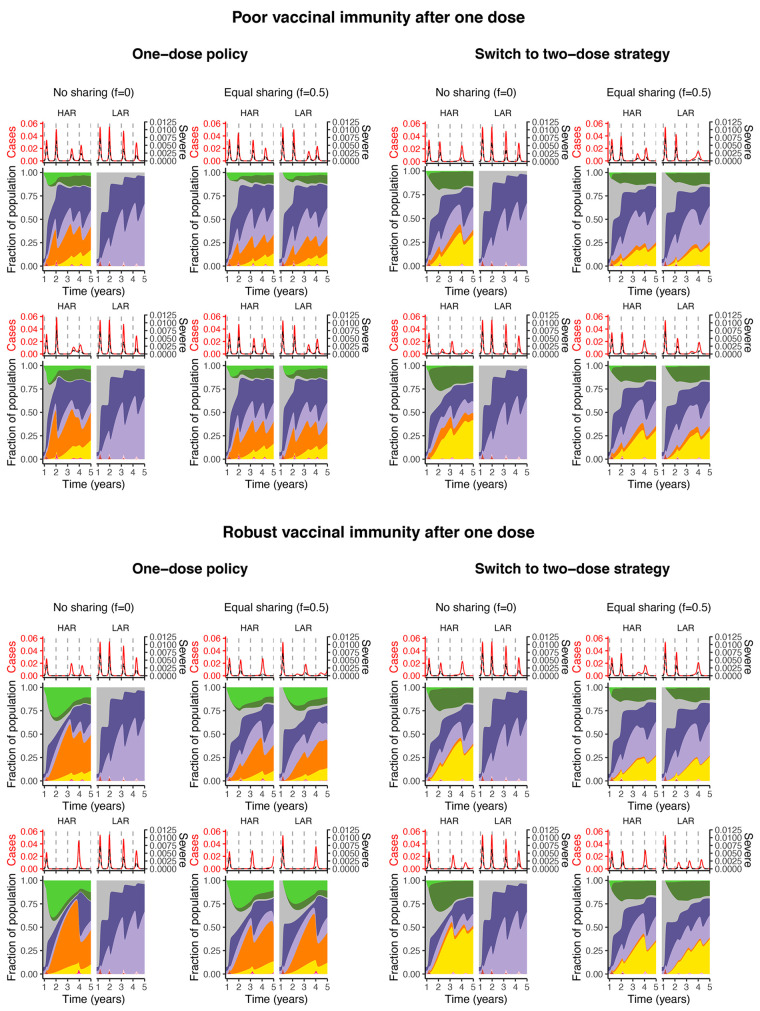
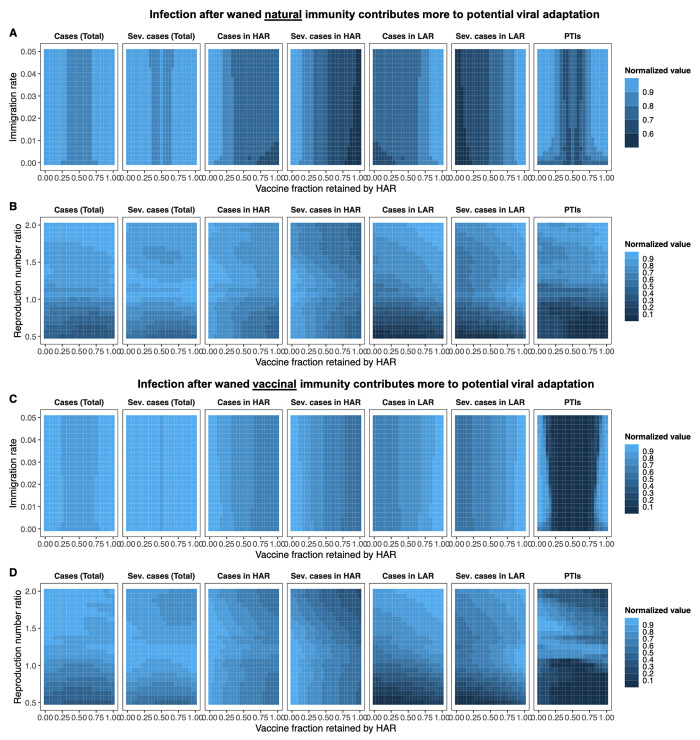
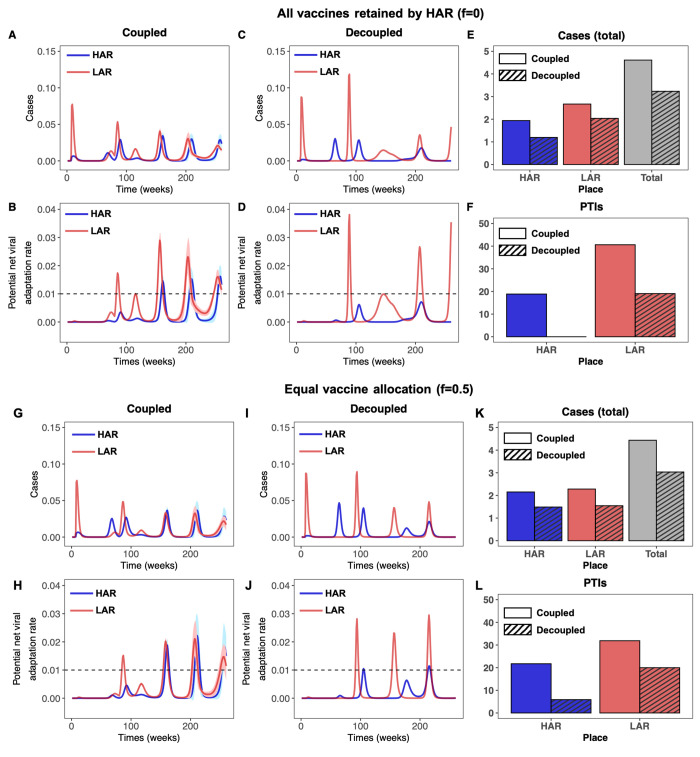
Vaccines provide powerful tools to mitigate the enormous public health and economic costs that the ongoing severe acute respiratory syndrome coronavirus 2 (SARS-CoV-2) pandemic continues to exert globally, yet vaccine distribution remains unequal among countries. To examine the potential epidemiological and evolutionary impacts of “vaccine nationalism,” we extend previous models to include simple scenarios of stockpiling between two regions. In general, when vaccines are widely available and the immunity they confer is robust, sharing doses minimizes total cases across regions. A number of subtleties arise when the populations and transmission rates in each region differ, depending on evolutionary assumptions and vaccine availability. When the waning of natural immunity contributes most to evolutionary potential, sustained transmission in low-access regions results in an increased potential for antigenic evolution, which may result in the emergence of novel variants that affect epidemiological characteristics globally. Overall, our results stress the importance of rapid, equitable vaccine distribution for global control of the pandemic.


Figures

Fig. 1
Fig. 1. Schematic depicting the two-country model.
The underlying immuno-epidemiological models for each country are based on (5, 6). Vaccines are allocated by the high access region (HAR) to the low access region (LAR). In the coupled framework, immigration of infected individuals between the countries is considered, and the national transmission rate depends on potential transmission increases (PTIs) in both countries, shown schematically as solid and striped virus particles in the HAR and LAR, respectively. In the decoupled framework, no immigration occurs, and the transmission rate is not influenced by PTIs. Full model details are provided in the supplementary materials.
Fig. 2
Fig. 2. Long-term equilibrium of the average fraction of infections.
(A to E) Equilibrium infections as a function of the vaccine fraction allocated by the HAR to the LAR under different scenarios related to immunity, transmission, and vaccination rate. In all panels, immunity scenarios are as follows: poor immunity, 1δ=1δvax=0.8 years, ϵ=0.8; intermediate immunity, 1δ=1δvax=1 year, ϵ=0.7; good immunity, 1δ=1δvax=1.5 years, ϵ=0.6; robust immunity, 1δ=1δvax=2 years, ϵ=0.5. In the scenario with asymmetrical transmission rates between the two countries, the transmission rate in the country with lower transmission is taken to be 80% of the value in the symmetric case. In the scenarios with overall higher transmission rates (B), this same asymmetric assumption is made in addition to the baseline symmetric transmission rate being elevated by 30% relative to the value in (A). In (C) to (E), illustrations of the equilibrium fraction of infections in each country with the intermediate immunity scenario are shown for (C) symmetric transmission with νtot=0.004, (D) asymmetric transmission (lower in HAR) with νtot=0.004, and (E) asymmetric transmission (lower in HAR) with νtot=0.001, with all other parameters as in (A). In all panels, the baseline transmission rate is β=2.35.
Fig. 3
Fig. 3. Immune landscapes and infections in both countries under a range of vaccination strategies and assumptions related to robustness of immune responses.
Note that the color scheme is as in Fig. 1. In all panels, vaccination begins after week 48. Poor vaccinal immunity after one dose is represented by 1ρ1=0.25 year and ϵ1=0.9, whereas robust vaccinal immunity after one dose means 1ρ1=1 year and ϵ1=0.7. Other immunity parameter values are as follows: 1δ= 1 year, 1ρ2=1 year, ϵ=ϵ2=0.7, ϵV1=0.1, and ϵV2=0.05. All other parameters including the procedure for the calculation of severe cases are described in the supplementary materials. In both the top and bottom panels: the top row depicts a switch from a maximum first-dose administration rate of 1% to 3% after week 60, whereas it is 1% to 5% for the bottom row (and concurrent with sharing, if it occurs).
Fig. 4
Fig. 4. Cumulative number of cases and PTIs in the medium term.
(A to D) Heat maps depicting total and severe cases from the time of vaccine onset (tvax=48 weeks) through the end of the 5 year period for both countries (leftmost two columns), the HAR (third and fourth columns from the left), the LAR (fifth and sixth columns from the left), as well as the combined number of PTIs to have occurred in both countries at the end of 5 years (rightmost column). Each grid-point denotes the mean value of 100 simulations. The population of both countries is taken to be the same. Each area plot is internally normalized, such that the largest value in each plot is 1. The x-axis indicates the fraction of vaccines retained by the HAR (i.e., 1 − f); thus the far right of a plot is the scenario where the HAR retains all vaccines (f = 0). In (A) and (C), both countries have the same average transmission rate (R¯0, see Materials and methods), and the immigration rate η is varied. In (B) and (D), the immigration rate is fixed at η = 0.01, and the relative mean transmission rate in the LAR, i.e., R¯0,LAR/R¯0,HAR, is varied between 0.5 and 2. The seasonality of the transmission rates in both countries and periods of NPI adoption are identical and as described in the Materials and methods. In all simulations, we assume a two-dose strategy throughout, i.e., 1ω=4 weeks, and take the maximal rate of administration of the first dose to be ν0,tot=2%. Assumed immunological parameters are 1δ=1 year, ϵ=0.7, ϵV1=0.1, ϵV2=0.05, ϵ2=0.7, 1ρ2=1 year, and the one- to two-dose immune response ratio is xe=0.8 (see Materials and methods). In the top panel [(A) and (B)], we assume that infection after waned natural immunity contributes more to potential viral adaptation, and take wIS=0.8, wIS1=0.2/xe, and wIS2=0.2 (see Materials and methods). In the bottom panel [(C) and (D)], we assume that infection after waned vaccinal immunity contributes more to potential viral adaptation, and take wIS=0.4, wIS1=0.8, and wIS2=0.8×xe (see Materials and methods). Additional details related to the determination of severe cases are also provided in the supplementary materials.
Fig. 5
Fig. 5. Time series of cases and potential net viral adaptation rates.
(A to F) Infections in the HAR (blue) and LAR (red) for the first 5 years after pandemic onset for the coupled (left) and decoupled (middle) frameworks. Each simulation is run 100 times, with the average indicated by the solid line and the standard deviation shown with the corresponding ribbon. The average number of cumulative cases over all simulations from the time of vaccine onset tvax=48 weeks through the end of the 5 year period are shown in the rightmost figure for the HAR, LAR, and both countries combined for the coupled (solid) and decoupled (dashed) frameworks. (G to L) Time series of the potential viral adaptation rate in both regions for the coupled (left) and decoupled (right) frameworks. The colors, averages and standard deviations are as described above. The dashed horizontal line denotes ecutoff=0.01, the assumed threshold for the occurrence of a PTI (see Materials and methods). The average number of PTIs at the end of the 5 year period are shown in the rightmost figure for the HAR and LAR for the coupled (solid) and decoupled (dashed) frameworks. The top panel [(A) to (F)] corresponds to the HAR retaining all vaccines (f = 0), while the bottom panel [(G) to (L)] corresponds to equal vaccine sharing (f = 0.5). In all simulations, we take R¯0,LAR/R¯0,HAR=1.2, η = 0.01, and assume that infection after waned natural immunity contributes primarily to evolution (i.e., wIS=0.8, wIS1=0.2/xe, and wIS2=0.2). All other parameters are identical to those in Fig. 4.

References

    1. Dong E., Du H., Gardner L., An interactive web-based dashboard to track COVID-19 in real time. Lancet Infect. Dis. 20, 533–534 (2020). 10.1016/S1473-3099(20)30120-1 - DOI - PMC - PubMed
    1. Polack F. P., Thomas S. J., Kitchin N., Absalon J., Gurtman A., Lockhart S., Perez J. L., Pérez Marc G., Moreira E. D., Zerbini C., Bailey R., Swanson K. A., Roychoudhury S., Koury K., Li P., Kalina W. V., Cooper D., Frenck R. W. Jr., Hammitt L. L., Türeci Ö., Nell H., Schaefer A., Ünal S., Tresnan D. B., Mather S., Dormitzer P. R., Şahin U., Jansen K. U., Gruber W. C., C4591001 Clinical Trial Group , Safety and efficacy of the BNT162b2 mRNA covid-19 vaccine. N. Engl. J. Med. 383, 2603–2615 (2020). 10.1056/NEJMoa2034577 - DOI - PMC - PubMed
    1. Voysey M., Clemens S. A. C., Madhi S. A., Weckx L. Y., Folegatti P. M., Aley P. K., Angus B., Baillie V. L., Barnabas S. L., Bhorat Q. E., Bibi S., Briner C., Cicconi P., Collins A. M., Colin-Jones R., Cutland C. L., Darton T. C., Dheda K., Duncan C. J. A., Emary K. R. W., Ewer K. J., Fairlie L., Faust S. N., Feng S., Ferreira D. M., Finn A., Goodman A. L., Green C. M., Green C. A., Heath P. T., Hill C., Hill H., Hirsch I., Hodgson S. H. C., Izu A., Jackson S., Jenkin D., Joe C. C. D., Kerridge S., Koen A., Kwatra G., Lazarus R., Lawrie A. M., Lelliott A., Libri V., Lillie P. J., Mallory R., Mendes A. V. A., Milan E. P., Minassian A. M., McGregor A., Morrison H., Mujadidi Y. F., Nana A., O’Reilly P. J., Padayachee S. D., Pittella A., Plested E., Pollock K. M., Ramasamy M. N., Rhead S., Schwarzbold A. V., Singh N., Smith A., Song R., Snape M. D., Sprinz E., Sutherland R. K., Tarrant R., Thomson E. C., Török M. E., Toshner M., Turner D. P. J., Vekemans J., Villafana T. L., Watson M. E. E., Williams C. J., Douglas A. D., Hill A. V. S., Lambe T., Gilbert S. C., Pollard A. J., Oxford COVID Vaccine Trial Group , Safety and efficacy of the ChAdOx1 nCoV-19 vaccine (AZD1222) against SARS-CoV-2: An interim analysis of four randomised controlled trials in Brazil, South Africa, and the UK. Lancet 397, 99–111 (2021). 10.1016/S0140-6736(20)32661-1 - DOI - PMC - PubMed
    1. Baden L. R., El Sahly H. M., Essink B., Kotloff K., Frey S., Novak R., Diemert D., Spector S. A., Rouphael N., Creech C. B., McGettigan J., Khetan S., Segall N., Solis J., Brosz A., Fierro C., Schwartz H., Neuzil K., Corey L., Gilbert P., Janes H., Follmann D., Marovich M., Mascola J., Polakowski L., Ledgerwood J., Graham B. S., Bennett H., Pajon R., Knightly C., Leav B., Deng W., Zhou H., Han S., Ivarsson M., Miller J., Zaks T., COVE Study Group , Efficacy and safety of the mRNA-1273 SARS-CoV-2 vaccine. N. Engl. J. Med. 384, 403–416 (2021). 10.1056/NEJMoa2035389 - DOI - PMC - PubMed
    1. Saad-Roy C. M., Wagner C. E., Baker R. E., Morris S. E., Farrar J., Graham A. L., Levin S. A., Mina M. J., Metcalf C. J. E., Grenfell B. T., Immune life history, vaccination, and the dynamics of SARS-CoV-2 over the next 5 years. Science 370, 811–818 (2020). 10.1126/science.abd7343 - DOI - PMC - PubMed

Publication types

Substances