. 2021 Aug 17;12(1):5061.
doi: 10.1038/s41467-021-25167-5.

Two doses of SARS-CoV-2 vaccination induce robust immune responses to emerging SARS-CoV-2 variants of concern

Collaborators, Affiliations

Two doses of SARS-CoV-2 vaccination induce robust immune responses to emerging SARS-CoV-2 variants of concern

Donal T Skelly et al. Nat Commun. .

Abstract

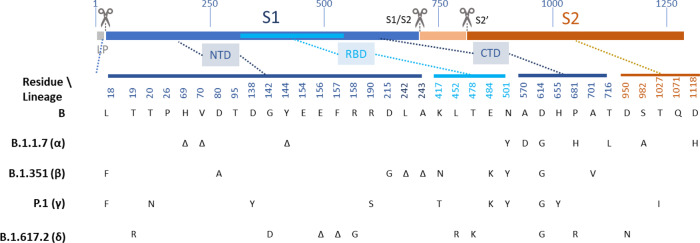
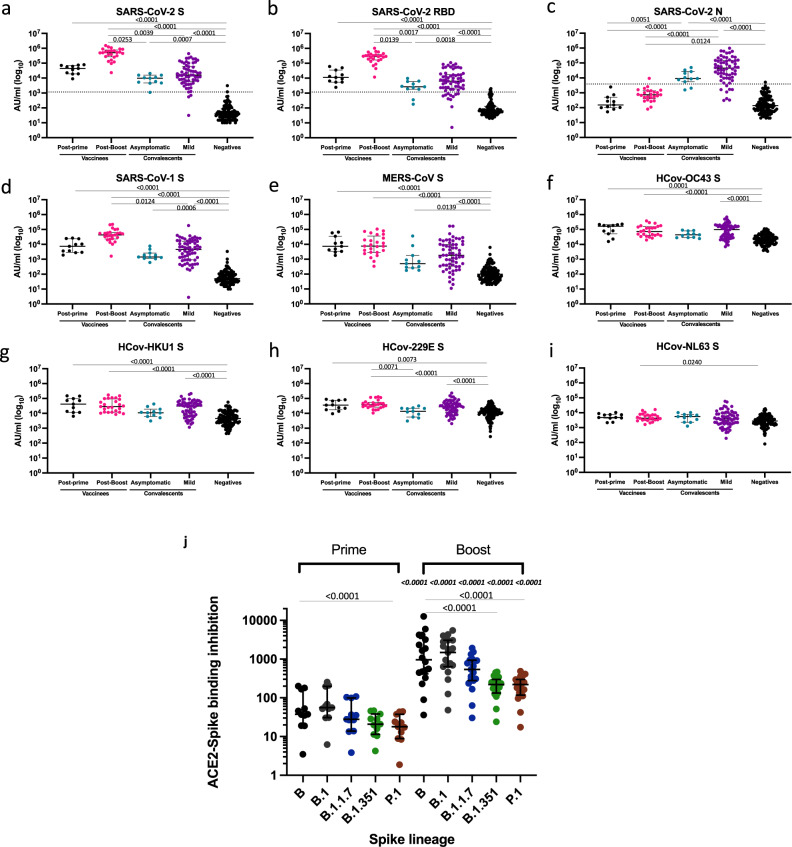
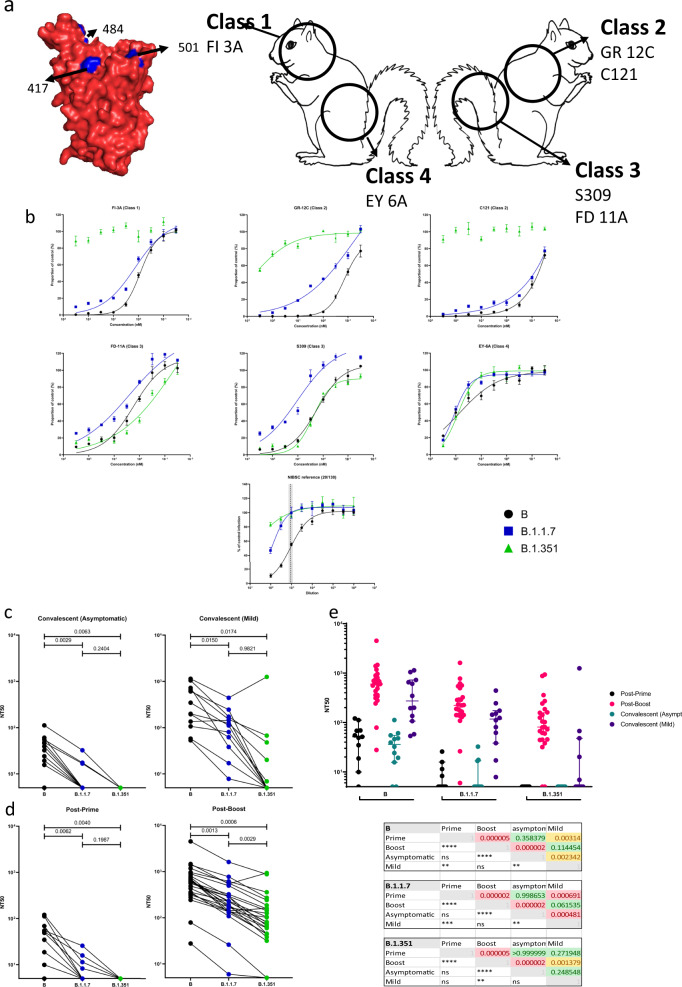
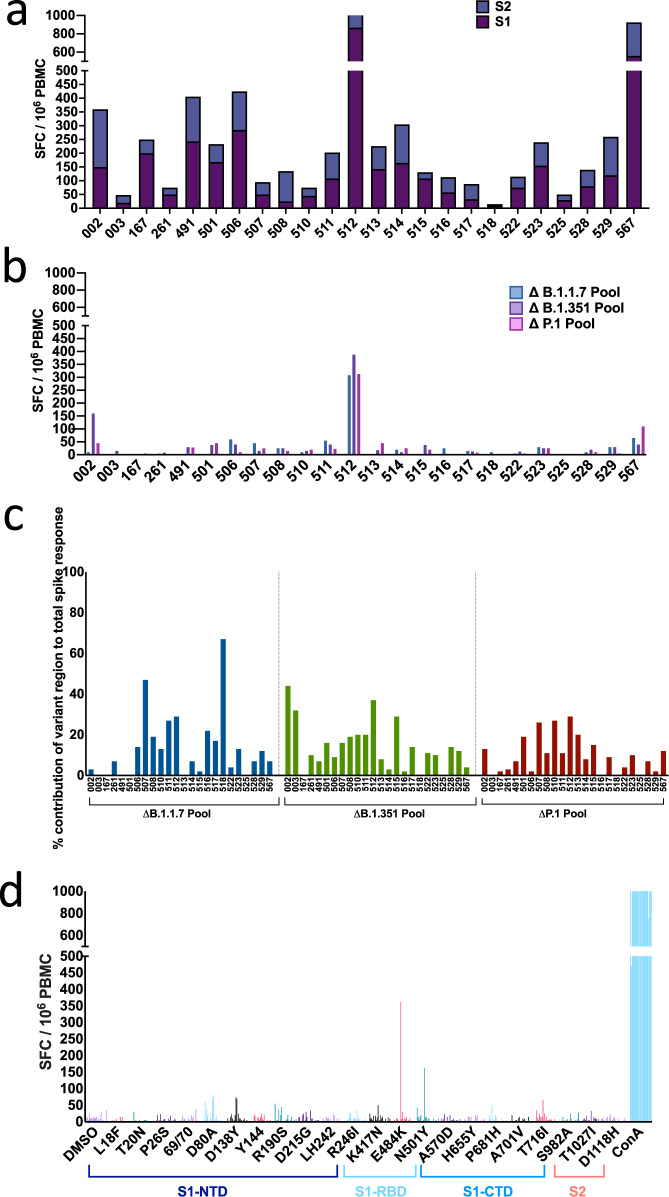
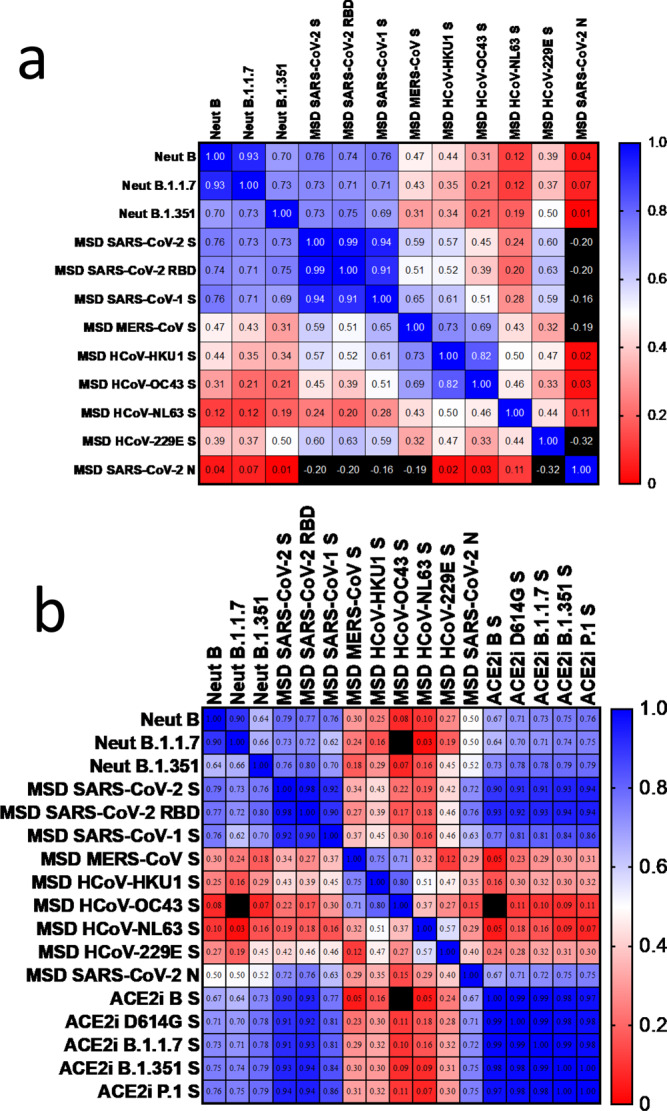
The extent to which immune responses to natural infection with severe acute respiratory syndrome coronavirus 2 (SARS-CoV-2) and immunization with vaccines protect against variants of concern (VOC) is of increasing importance. Accordingly, here we analyse antibodies and T cells of a recently vaccinated, UK cohort, alongside those recovering from natural infection in early 2020. We show that neutralization of the VOC compared to a reference isolate of the original circulating lineage, B, is reduced: more profoundly against B.1.351 than for B.1.1.7, and in responses to infection or a single dose of vaccine than to a second dose of vaccine. Importantly, high magnitude T cell responses are generated after two vaccine doses, with the majority of the T cell response directed against epitopes that are conserved between the prototype isolate B and the VOC. Vaccination is required to generate high potency immune responses to protect against these and other emergent variants.


Conflict of interest statement

The authors declare no competing interests.

Figures

Fig. 1
Fig. 1. Sequence variation in spike glycoprotein.
The open reading frame encoding spike (S) is illustrated, with the position of key features of processing and function indicated to approximate scale (residue number indicated above). During co-translational translocation to the endoplasmic reticulum (ER), the short leader peptide (LP) is proteolytically removed. Following folding, trimer assembly and glycosylation in the ER and Golgi, the trans-Golgi localized protease, furin, cleaves the boundary between the S1 and S2 polypeptides. Following binding of the receptor-binding domain (RBD, cyan) to ACE2 on host cells, cell-surface TMPRSS2 proteolytically cleaves the S2’ site, facilitating conformational changes to spike that result in fusion of the virus envelope with the plasma membrane. Variant residue positions are indicated below, and their approximate location on the S polypeptide is indicated. Residue identities are shown at each of these positions for a prototype lineage B isolate, and at each position in four lineages of interest, B.1.1.7 (α—Alpha), B.1.351 (β—Beta), P.1 (γ—Gamma) and B.1.617 (δ—Delta), at which the respective lineage differs from prototype. Δ indicates deletion of one or more residues. Note, there are lineage-defining substitutions outside RBD, in the N-terminal domain (NTD) and C-terminal domain (CTD) of S1 (dark blue), and in S2 (tan). These may include changes that directly or indirectly affect antibody-mediated neutralization or cellular immunity, by loss or altered dynamics of epitope, respectively.
Fig. 2
Fig. 2. Binding assays.
IgG antibodies specific to; ac SARS-CoV-2 (spike [S], receptor-binding domain [RBD], nucleocapsid [N]), d, e SARS-CoV-1 S, MERS-CoV S, fi HCoV-OC43 S, HCoV-HKU1 S, HCoV-229E S, HCoV-NL63 S, were measured using an MSD technology platform customised array. Sera analysed were from vaccinees (post-prime and post-boost), asymptomatic (mean 27 days post-PCR positive test, range 22–33 days) and mild COVID-19 convalescent sera (mean 29 days post-symptom onset, range 18–40 days) and a cohort of prepandemic sera collected between 2014 and 2018 negative for SARS-CoV-2 (negatives). Data are displayed as calculated concentrations which use an MSD standard reference curve to interpret arbitrary units (AU). Statistical difference between the groups was performed using a two-tailed Kruskal–Wallis one-way ANOVA with Dunn’s post-test for multiple comparisons made to compare all groups (significant adjusted P values are displayed). Vaccinees post-prime n = 11; vaccinees post-boost n = 25; negatives n = 103; asymptomatic COVID-19 convalescents n = 11; mild COVID-19 convalescents n = 62. The dashed lines in ac show the cut-offs determined as the mean of negatives +3 SD. Samples were run in monoplicate (convalescent samples) or duplicates (vaccine samples). j Inhibition analysis between ACE2 and recombinant spike from the designated homotypic and heterotypic lineages. Sera derived from individuals receiving prime or boost vaccination: post-prime n = 11, post-boost n = 18–25 dependent on spike variant. Differences between B and other variants in post-prime and post samples were tested using a Friedman statistical test with Dunn’s multiple comparison test (significant P values are displayed on lines linking B to variant). A two-tailed Mann–Whitney U test was used to compare post-prime and post boost groups for each variant. P values are displayed on the boost panel, immediately above each variant and are italicized. Plots show median with error bars indicating ± intraquartile range) (IQR). ACE2 inhibition assay samples were run in monoplicate.
Fig. 3
Fig. 3. Homotypic and heterotypic neutralization of key SARS-CoV-2 lineages by antibody.
The potency of neutralization was determined by a focus-forming unit microneutralization assay against authentic virus of prototype B lineage and isolates of B.1.1.7 and B.1.351. a A cartoon of a ‘squirrel’ illustrating the receptor-binding domain (RBD). Markings on the squirrel show the epitopes of the RBD antibodies used in this study (classes 1–4). Neutralization by the panel of monoclonal antibodies binding to four distinct epitopes of RBD (upper left). A space-filling model of prototype RBD (PDB 6YZ5) created in PyMOL, shows the residue of the mutations present in the B.1.1.7 and B.1.351 lineages in blue (upper middle and upper right; same aspect and reverse aspect as the space-filling model, respectively). b Neutralization by the international reference plasma NIBSC 20/130, nominally NT50 = 1/1000. The mean number of foci ± SD relative to a no-antibody control is plotted against the reciprocal of the respective serum dilution. Data were fitted by non-linear regression in GraphPad Prism 9 to the Hill Equation, with TOP and BOTTOM constrained to 100 and 0%, respectively. Where a significant fit was obtained, it is represented by a trend line on the respective plot, and NT50 values used in Supplementary Fig. 1 and main results. NT50 against B established in our assay indicated by the vertical dashed line with grey bars indicating the 95% confidence interval. c Neutralization by convalescent sera from asymptomatic participants (left) and those with mild symptoms (right) against B, B.1.1.7 and B.1.351 isolates. A Tukey’s multiple comparison test was performed for each serum group, comparing mean NT50 response to each virus isolate. P values of all comparisons are displayed in the figures. d Neutralization by sera from recipients of a single dose (left) and both prime and boost doses (right) of BNT162b2 vaccine. e Homotypic and heterotypic neutralization potencies of the three sources of antibody against the three isolates, shown by individual (dots) and sub-population mean and SD of NT50 values shown with error bars (upper panel). For each isolate, pairwise comparisons of average NT50 estimates were made between groups of serum using the Kolmogorov–Smirnov non-parametric test. P values for the r statistic are shown (lower panel), both numerically and symbolically. P > 0.05 in green and ‘ns’. No results for 0.05 > P > 0.01. 0.01 > P > 0.001 in yellow and **P < 0.001 in red and ****. Vaccinees post-prime n = 11; vaccinees post-boost n = 25; asymptomatic COVID-19 convalescents n = 12; mild COVID-19 convalescents n = 13. MNA tests were performed in quadruplicate for all samples. Each plate contained serum-free controls for normalization of results.
Fig. 4
Fig. 4. ELISpot responses to prototype, B.1.1.7, B.1.351 and P.1.
T cell responses were measured using IFN-γ ELISpot assays in 24 healthy volunteers, 7–17 days after receiving the 2nd dose of BNT162b2. a T cell responses to 15–18-mer peptides in B strain overlapping by 10 amino-acids and spanning the entire spike region. b Summed T cell responses to peptides from B strain that mapped to sites with mutations in B.1.1.7 (n = 17 peptides), B.1.351 (n = 21 peptides) and P.1 (n = 22 peptides). c Percentage contribution T cells (using B peptides) that target mutational regions within B.1.1.7, B.1.351 and P.1, relative to the total T cell spike response in each of the 24 volunteers. d T cell responses to 22 individual peptides in B strain that have corresponding mutations in B.1.1.7, B.1.351 and P.1 variants. Standardised ELISpot assays were run in triplicate for background and spike peptides and duplicates for all others to allow cell preservation. DMSO control with matching percent DMSO was also used in all assays to account for DMSO content in peptide pools. Each bar represents one volunteer with a positive response (defined as a response to the peptide minus the background that was greater than twice the background). SFC/106 PBMC = spot forming cells per million peripheral blood mononuclear cells, with background subtracted.
Fig. 5
Fig. 5. Cross-correlation of immune parameters.
For each serum, pairwise Spearman correlation analyses were undertaken between the value of binding of serum antibody to coronavirus antigens, the ACE2-spike binding-inhibition potency (see Fig. 2), and the homotypic and heterotypic neutralizing titre of the same sera (see Fig. 3). a Heatmap of two-tailed Spearman’s r parameter for each comparison in which spike binding data was available across samples drawn from participants after 1 dose (n = 11, mean 27 days after the 1st dose) and 2 doses of BNT162b2 vaccine (n = 25, mean 8 days after receiving the 2nd dose), and previous infection (n = 20, 11:9 asymptomatic to symptomatic, mean 28 days since PCR test for asymptomatics or symptoms onset). Colour mapping is dual gradient from Blue (r = 1.0) through White (r = 0.5) to Red (r = 0). Values outside this range are Black. b Heatmap Spearman’s r parameter for each comparison in which ACE2-spike binding-inhibition data were available (n = 35:11 after the 1st dose and 24 after the 2nd vaccine dose). Colour mapping as in (a).

References

    1. World Health Organization. Tracking SARS-CoV-2 variants. https://www.who.int/en/activities/tracking-SARS-CoV-2-variants (2021).
    1. Starr TN, et al. Deep mutational scanning of SARS-CoV-2 receptor binding domain reveals constraints on folding and ACE2 binding. Cell. 2020;182:1295–1310.e20. doi: 10.1016/j.cell.2020.08.012. - DOI - PMC - PubMed
    1. GISAID. GISAID Initiative. https://www.gisaid.org/ (2021).
    1. Tegally H, et al. Detection of a SARS-CoV-2 variant of concern in South Africa. Nature. 2021;592:438–443. doi: 10.1038/s41586-021-03402-9. - DOI - PubMed
    1. Verkhivker, G. M., Agajanian, S., Oztas, D. & Gupta, G. Computational analysis of protein stability and allosteric interaction networks in distinct conformational forms of the SARS-CoV-2 Spike D614G mutant: reconciling functional mechanisms through allosteric model of spike regulation. J. Biomol. Struct. Dyn.10.1080/07391102.2021.1933594 (2021). - PubMed

Publication types

MeSH terms

Associated data