. 2021 Aug 17;12(1):4985.
doi: 10.1038/s41467-021-25156-8.

SARS-CoV-2 disease severity and transmission efficiency is increased for airborne compared to fomite exposure in Syrian hamsters

Affiliations

SARS-CoV-2 disease severity and transmission efficiency is increased for airborne compared to fomite exposure in Syrian hamsters

Julia R Port et al. Nat Commun. .

Abstract

Transmission of SARS-CoV-2 is driven by contact, fomite, and airborne transmission. The relative contribution of different transmission routes remains subject to debate. Here, we show Syrian hamsters are susceptible to SARS-CoV-2 infection through intranasal, aerosol and fomite exposure. Different routes of exposure present with distinct disease manifestations. Intranasal and aerosol inoculation causes severe respiratory pathology, higher virus loads and increased weight loss. In contrast, fomite exposure leads to milder disease manifestation characterized by an anti-inflammatory immune state and delayed shedding pattern. Whereas the overall magnitude of respiratory virus shedding is not linked to disease severity, the onset of shedding is. Early shedding is linked to an increase in disease severity. Airborne transmission is more efficient than fomite transmission and dependent on the direction of the airflow. Carefully characterized SARS-CoV-2 transmission models will be crucial to assess potential changes in transmission and pathogenic potential in the light of the ongoing SARS-CoV-2 evolution.


Conflict of interest statement

The authors declare no competing interests.

Figures

Fig. 1
Fig. 1. Disease severity in Syrian hamsters.
a Experimental layout for intranasal (I.N.), fomite and aerosol exposure experiments. White circle: inoculation, black: necropsy, gray, swab time-points b Relative weight loss in hamsters after SARS-CoV-2 inoculation over time (DPI = day post inoculation, N = 4 per group). The lines represent mean ± SEM. Black line indicates weights of unexposed control group. Dotted vertical line represent averaged peak weight loss post inoculation or exposure. Statistical significance was measured using a Mann–Whitney two-sided test, p-values are shown. c Violin plot with individuals and median of weight gain at 14 DPI. Statistical significance was measured using a Kruskal–Wallis test, followed by Dunn’s multiple comparison test. d Violin plot with individual and median titers of infectious SARS-CoV-2 in the respiratory and intestinal tissues at 1 DPI and e 4 DPI, Red: I.N, blue: aerosol, purple: fomite, black: unexposed; dotted horizontal line = limit of detection (0.5). GI = gastrointestinal tract; N = 4 per group. Statistical significance was measured using a two-way ANOVA, followed by Tukey’s multiple comparison test. *P < 0.05, **P < 0.001, ***P < 0.0001, ****P < 0.0001. NS, not significant. Source data are provided as a Source Data file.
Fig. 2
Fig. 2. Comparison of early replication of SARS-CoV-2 in respiratory tract.
Comparison of replication of SARS-CoV-2 for intranasal (I.N.), aerosol and fomite inoculated hamsters at 1 day post inoculation (DPI) by immunohistochemistry (N = 4). ac SARS-CoV-2 antigen detection in ciliated epithelial cells of the nasal mucosa (200x; bar = 100 µm). d Nasal mucosa from a control hamster (200x; bar = 100 µm). eg SARS-CoV-2 antigen detection throughout tracheal ciliated epithelial cells (400x; bar = 50 µm). h Normal tracheal mucosa from a control hamster. i SARS-CoV-2 antigen detection focused on terminal bronchioles and adjacent alveolar spaces (40x; bar = 500 µm). j Lack of SARS-CoV-2 in epithelial cells with strong antigen detection noted in pulmonary macrophages (inset) (40x; bar = 500 µm). k Lack of SARS-CoV-2 antigen detection throughout the lung (40x; bar = 500 µm). l Normal lung from control hamster (40x; bar = 500 µm). m Quantitative comparison of antigen detection for lung (type I and type II pneumocytes, macrophages (mos), mucosa of the trachea and skull sections (olfactory and ciliated epithelium of the nasal turbinates) at 1 day post inoculation for I.N., aerosol, fomite, and control groups.
Fig. 3
Fig. 3. Comparison of the respiratory tract pathology of SARS-CoV-2 Infected hamsters.
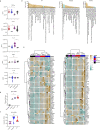
Comparison of SARS-CoV-2 pathology for intranasal (I.N.), aerosol and fomite inoculated hamsters at 4 day post inoculation (DPI) (N = 4). a Infiltration and disruption of the ciliated nasal mucosa by moderate numbers of leukocytes with multifocal epithelial cell necrosis (200x; bar = 100 µm). b Multifocal disruption of the nasal ciliated mucosa by low numbers of leukocytes with accumulations of degenerate leukocytes in the nasal passage (200x; bar = 100 µm). c Intact ciliated nasal mucosa with normal mucus presence within the lumen (200x; bar = 100 µm). d A control nasal turbinate with intact ciliated nasal mucosa and mucus within the lumen (200x; bar = 100 µm). e Disruption of the tracheal mucosa with single cell necrosis and infiltration by low numbers of leukocytes (400x; bar = 50 µm). f Unaffected tracheal mucosa (400x; bar = 50 µm). g Unaffected tracheal mucosa (400x; bar = 50 µm). h Section of tracheal mucosa from a control hamster (400x; bar = 50 µm). il No significant histopathologic lesions in the lung of any inoculation route at 1 day-post-inoculation (100x; bar = 200 µm). m Multifocal disruption of ciliated nasal mucosa with accumulation of cellular debris and degenerate leukocytes within the nasal passage (200x; bar = 100 µm). n Severe disruption and multifocal erosion of the nasal mucosa with accumulation of numerous degenerate leukocytes and abundant cellular debris within the nasal passage (200x; bar = 100 µm). o Ciliated epithelial cell degeneration and mucosal erosion with leukocyte infiltration into the lamina propria (200x; bar = 100 µm). p Normal nasal turbinate from a control hamster (200x; bar = 100 µm). q Focal disruption of the tracheal mucosa by low numbers of leukocytes (400x; bar = 50 µm). r Multifocal infiltration of the mucosa by moderate numbers of leukocytes and multifocal epithelial cell necrosis (400x; bar = 50 µm). s Multifocal loss of epithelial cilia and infiltration of the lamina propria by moderate numbers of leukocytes (400x; bar = 50 µm). t Normal tracheal mucosa from a control hamster (400x; bar = 50 µm). u Widespread, moderate to severe broncho-interstitial pneumonia (100x; bar = 200 µm). v Multifocal moderate broncho-interstitial pneumonia focused on terminal bronchioles (100x; bar = 200 µm). w Multifocal, mild interstitial pneumonia focused on terminal bronchioles (100x; bar = 200 µm). x Normal lung from a control hamster (100x; bar = 200 µm). y, z Clustering (Euclidean, complete) of animals based on viral titers in lung and trachea and quantitative assessment of pathology in the upper and lower respiratory tract on 1 DPI and 4 DPI. Heatmap colors refer to color scale on the right, gray = NA, I.N. = red, Aerosol = blue, Fomite = purple, Control = black. Exposure route is indicated by color bar at the top. Source data are provided as a Source Data file.
Fig. 4
Fig. 4. Exposure dependent SARS-CoV-2 acute local immune gene activation, systemic cytokine response and strength of humoral response.
a Violin plots with individuals and median of serum concentrations of key cytokines (interferon (IFN)-γ, tumor necrosis factor (TNF)-α, interleukin (IL)-6, IL-4, and IL-10) on 4 days post inoculation (DPI). Statistical significance was measured using a Kruskal–Wallis test. b, c Violin plots with individuals and median of endpoint IgG antibody titers against SARS-CoV-2 spike ectodomain measured by ELISA in serum and reciprocal live virus neutralization titers. ELISAs and neutralization assays (VNs) were done once. d Selection of significantly up- (brown) or downregulated (blue) immune- or infection associated pathways in the lung at 4 DPI, identified by integrated pathway analysis. e Clustering (Euclidean, Ward.D2) of animals based on gene-expression associated with the coronavirus pathway (left) and Th1/Th2 pathway (right) in lung at 4 DPI. Heatmap colors refer to color scale on the right (normalized z-score). Exposure route is indicated by color bar at the top, I.N. = red, Aerosol = blue, Fomite = purple, Control = black. *P < 0.05, **P < 0.001, ***P < 0.0001, ****P < 0.0001. NS, not significant. Source data are provided as a Source Data file.
Fig. 5
Fig. 5. Exposure dependent SARS-CoV-2 shedding.
a Respiratory and b intestinal viral shedding of intranasal (I.N.), aerosol and fomite exposed hamsters. Median, 95% CI and individuals are shown. c Peak shedding and d cumulative (area under the curve (AUC) analysis) respiratory and intestinal shedding of I.N., aerosol and fomite exposed hamsters. Statistical significance was measured by Kruskal–Wallis test, N = 4 per group. *P < 0.05, **P < 0.001, ***P < 0.0001, ****P < 0.0001. NS, not significant. e Correlation between cytokine levels, early shedding (2 days post inoculation (DPI)), peak shedding, peak weight loss, ELISA and virus neutralization (VN) titers (14 DPI), lung titers and pathology at 4 DPI. Significant correlations (N = 4 per group, Pearson–Spearman analysis, p < 0.05) are indicated with an asterisk and strength of correlation (R2) is depicted according to the color bar on the right. Source data are provided as a Source Data file.
Fig. 6
Fig. 6. Fomite and airborne transmission in the Syrian hamster.
a Experimental layout for fomite and b airborne exposure experiments in hamsters. I.N. = intranasal. c Pictures of smoke test to demonstrate unidirectional airflow in the transmission cage. d Aerodynamic particle size distribution on either side of the transmission cage. e Reduction of particles by the divider. f, g Relative weight loss in hamsters after SARS-CoV-2 transmission via fomite and airborne routes. DPE = days post exposure. Lines represent mean ± SEM. h Violin plot with individuals and median of endpoint IgG antibody titers against SARS-CoV-2 spike ectodomain by ELISA in serum of hamsters infected through airborne and fomite transmission route. ELISAs were done once. i Respiratory shedding profile of hamsters exposed through fomite and airborne transmission routes, individuals, median and 95% CI are shown. j Cumulative (area under the curve (AUC) analysis) of respiratory shedding from animals which seroconverted after airborne and fomite transmission. Violin plots with individuals and median are depicted. Statistical significance was measured by Kruskal–Wallis test, N = 8 per group. *P < 0.05, **P < 0.001, ***P < 0.0001, ****P < 0.0001. NS, not significant. Source data are provided as a Source Data file.

Update of

References

    1. WHO, Coronavirus disease 2019 (COVID-19) Situation Report – 52. (2020).
    1. Nie S, et al. Coronavirus Disease 2019-related dyspnea cases difficult to interpret using chest computed tomography. Respiratory Med. 2020;167:105951–105951. doi: 10.1016/j.rmed.2020.105951. - DOI - PMC - PubMed
    1. Parry AH, et al. Spectrum of chest computed tomographic (CT) findings in coronavirus disease-19 (COVID-19) patients in India. Eur. J. Radiol. 2020;129:109147–109147. doi: 10.1016/j.ejrad.2020.109147. - DOI - PMC - PubMed
    1. van Kampen, J. J. A. et al. Shedding of infectious virus in hospitalized patients with coronavirus disease-2019 (COVID-19): duration and key determinants. Nat. Commun. 12, 267 (2021). - PMC - PubMed
    1. Cevik, M. et al. SARS-CoV-2, SARS-CoV, and MERS-CoV viral load dynamics, duration of viral shedding, and infectiousness: a systematic review and meta-analysis. Lancet Microbe. 2, E13–E22 (2020). - PMC - PubMed

Publication types

MeSH terms