. 2021 Aug 17;12(1):4977.
doi: 10.1038/s41467-021-25246-7.

Single-cell sequencing of immune cells from anticitrullinated peptide antibody positive and negative rheumatoid arthritis

Affiliations

Single-cell sequencing of immune cells from anticitrullinated peptide antibody positive and negative rheumatoid arthritis

Xunyao Wu et al. Nat Commun. .

Abstract

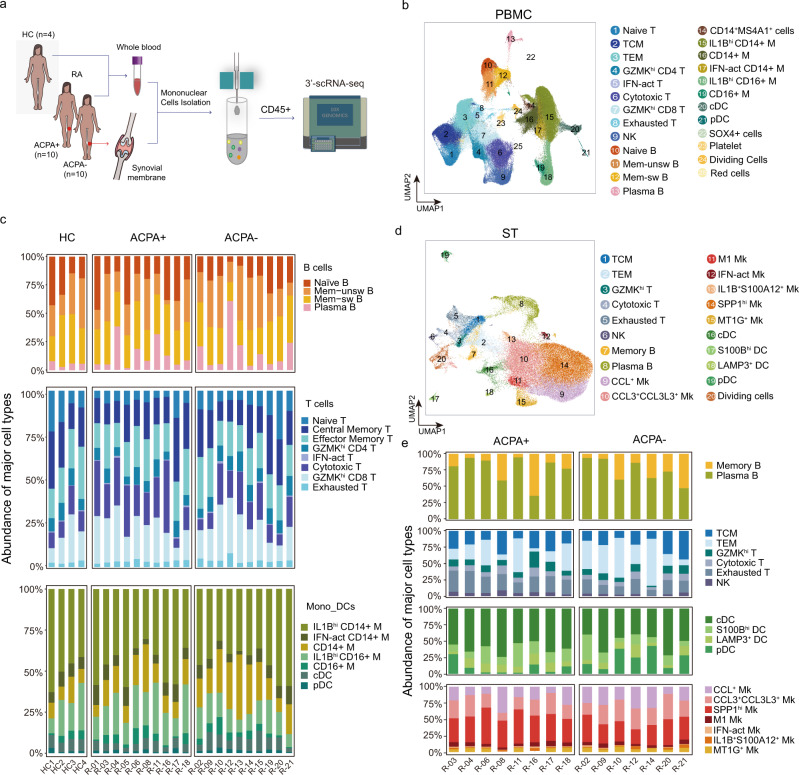
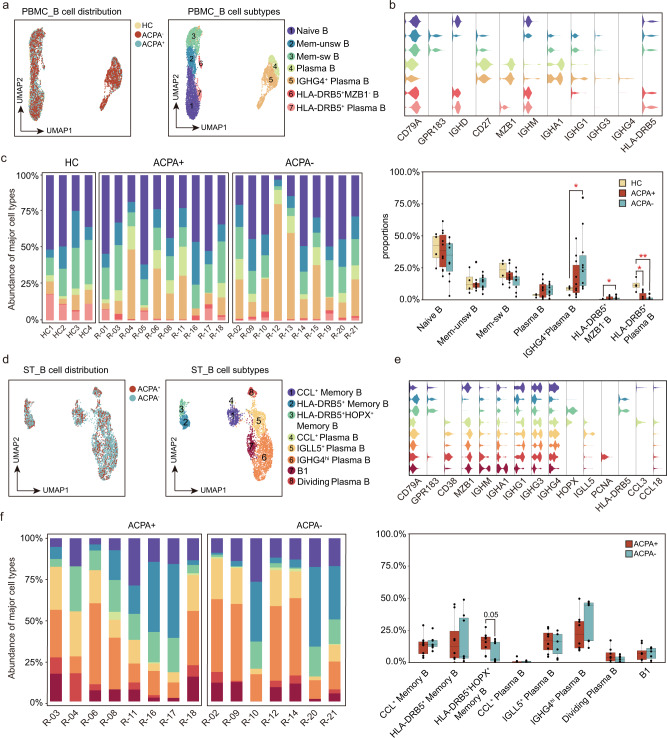
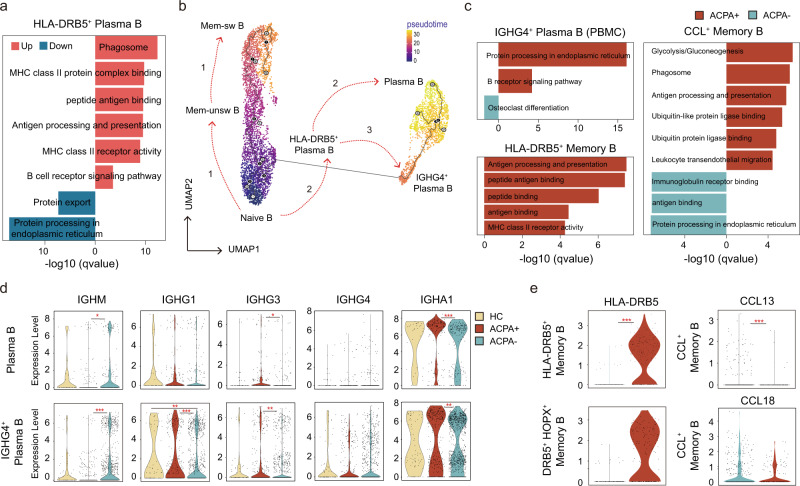
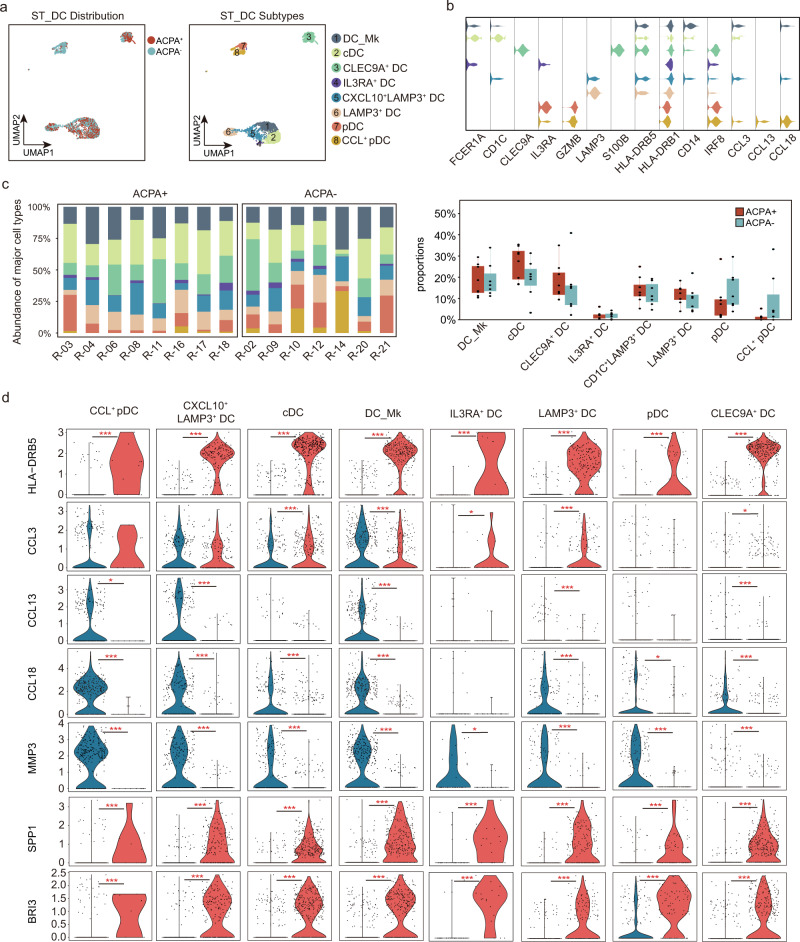
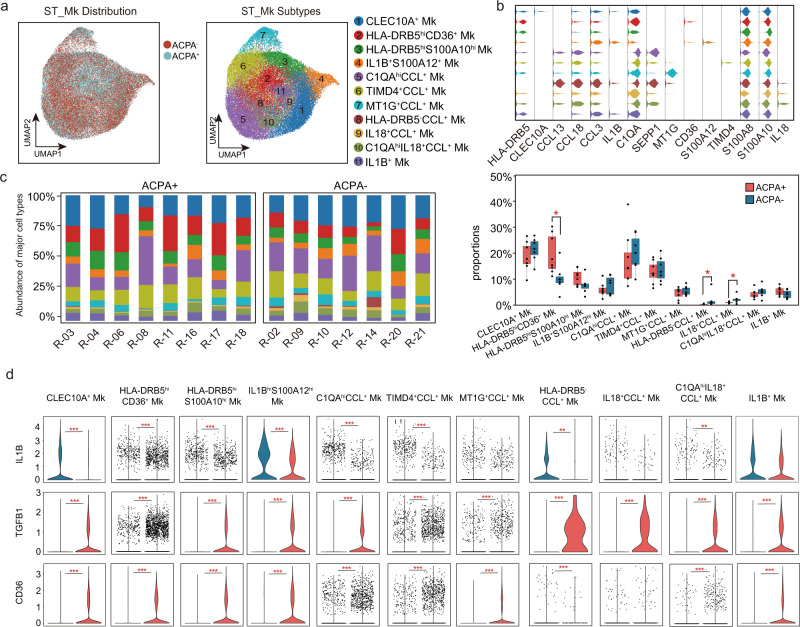
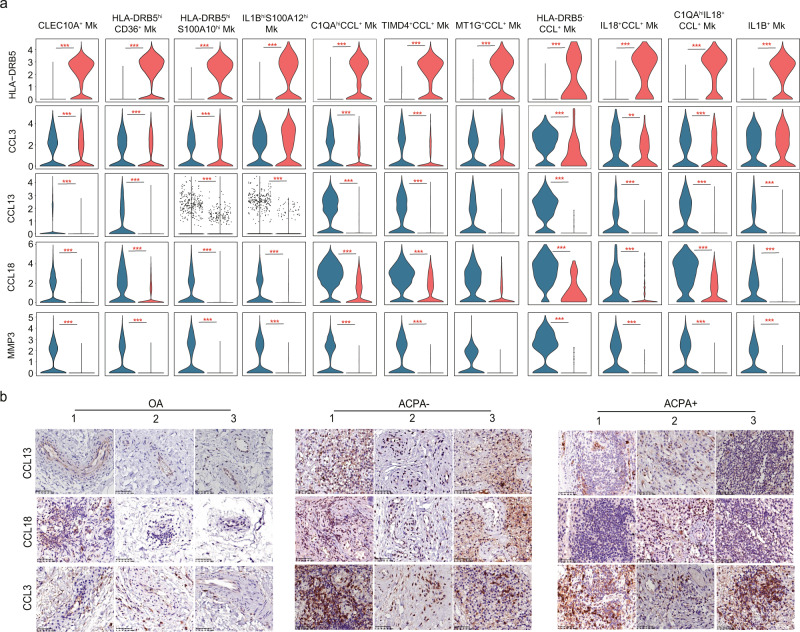
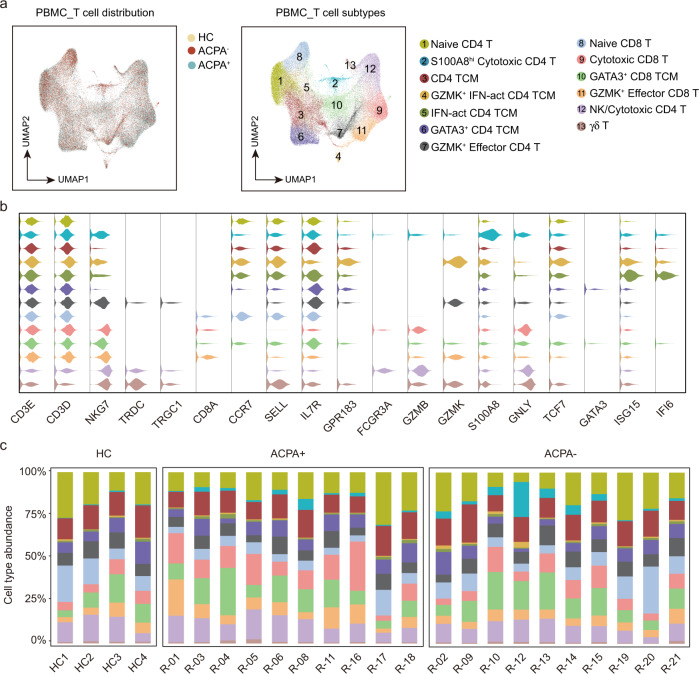
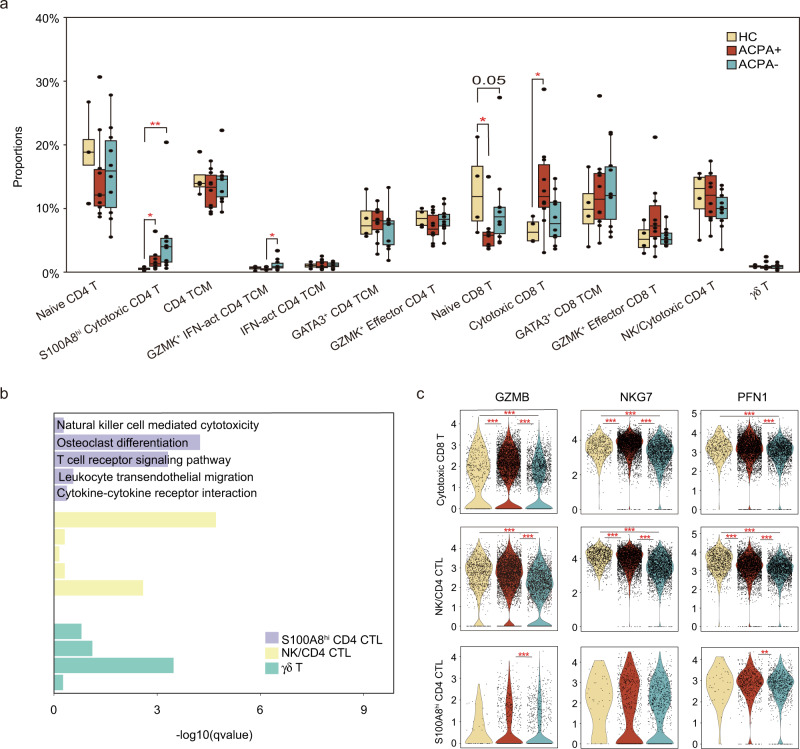
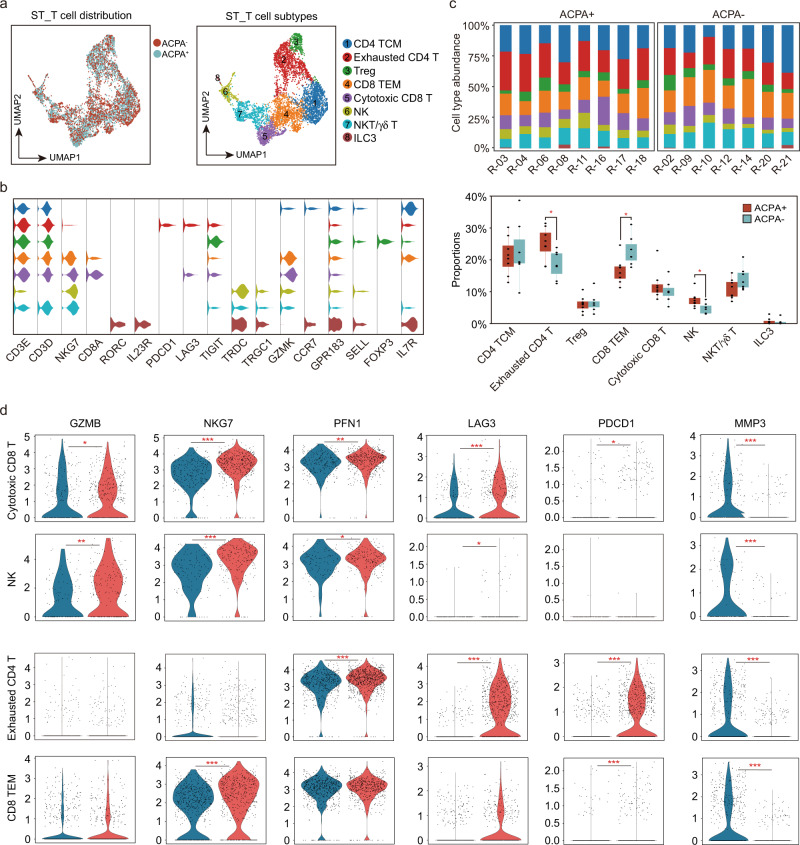
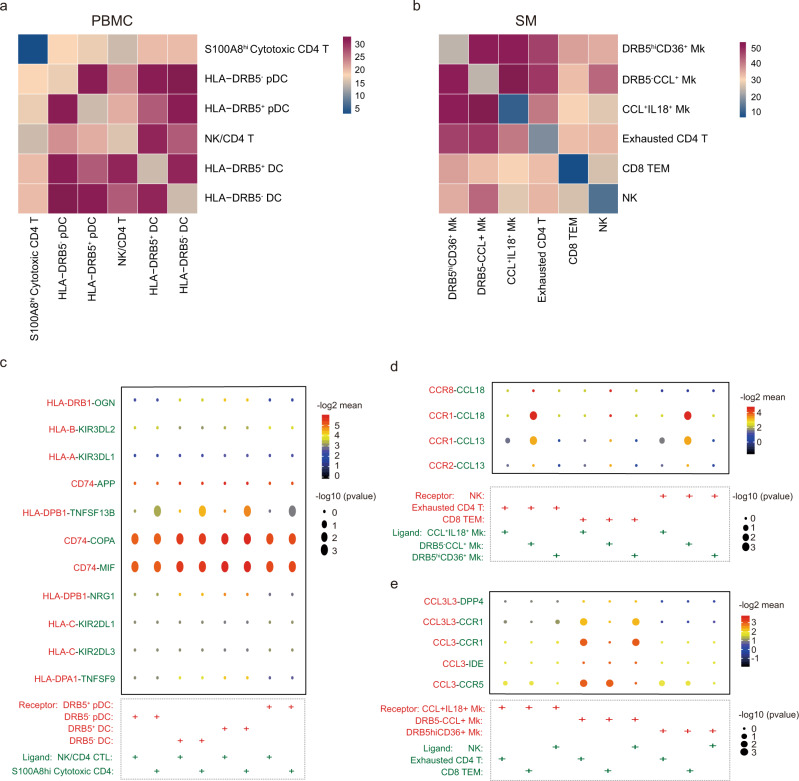
The presence or absence of anti-citrullinated peptide antibodies (ACPA) and associated disparities in patients with rheumatoid arthritis (RA) implies disease heterogeneity with unknown diverse immunopathological mechanisms. Here we profile CD45+ hematopoietic cells from peripheral blood or synovial tissues from both ACPA+ and ACPA- RA patients by single-cell RNA sequencing and identify subsets of immune cells that contribute to the pathogenesis of RA subtypes. We find several synovial immune cell abnormalities, including up-regulation of CCL13, CCL18 and MMP3 in myeloid cell subsets of ACPA- RA compared with ACPA+ RA. Also evident is a lack of HLA-DRB5 expression and lower expression of cytotoxic and exhaustion related genes in the synovial tissues of patients with ACPA- RA. Furthermore, the HLA-DR15 haplotype (DRB1/DRB5) conveys an increased risk of developing active disease in ACPA+ RA in a large cohort of patients with treatment-naive RA. Immunohistochemical staining shows increased infiltration of CCL13 and CCL18-expressing immune cells in synovial tissues of ACPA- RA. Collectively, our data provide evidence of the differential involvement of cellular and molecular pathways involved in the pathogenesis of seropositive and seronegative RA subtypes and reveal the importance of precision therapy based on ACPA status.


Conflict of interest statement

The authors declare no competing interests.

Figures

Fig. 1
Fig. 1. Clustering and classification of immune cells in peripheral blood and synovium from patients with RA.
a Overview of the experimental workflow. HC: Healthy Control; ACPA: anti-citrullinated-peptide antibodies; scRNA-seq: single-cell RNA sequencing. b UMAP visualization of pooled scRNA-seq data of 135,429 CD45+ cells from PBMC (Peripheral blood mononuclear cells). We identified 25 clusters, including B cells (four clusters), T/NK cells (nine clusters), and myeloid cells (seven clusters). c Relative percentage of cell subtypes in PBMC across donors, grouped by ACPA type. d UMAP visualization of pooled scRNA-seq data of 71,073 CD45+ cells from STMC (synovial tissue mononuclear cells). We identified 20 clusters, including B cells (two clusters), T cells (6 clusters), dendritic cells (four clusters), and macrophages (seven clusters). e Relative percentage of cell subtypes in STMC across donors, grouped by ACPA type.
Fig. 2
Fig. 2. Lack of HLA-DRB5 expression by B cells from patients with ACPA- RA.
a UMAP visualization of B cell subsets from PBMC. We identified 7 B cell clusters across 6152 cells. Cells are marked by ACPA type (left) and cell subtype (right). b Violin plots showing marker genes across PBMC B cell subtypes. The y axis represents log-scaled normalized counts. c Left: bar plots showing the relative percentage of PBMC B cell subtypes for each sample as in a. Right: box plots showing the proportions of each PBMC B cell subtypes across ACPA groups. Cell types showed enrichment in ACPA+ or ACPA- subgroups are marked with *P values were calculated by the two-sided Wilcoxon test. *p < 0.05 (from left to right, p = 0.024,0.036,0.013), **p < 0.01 (p = 0.0058). n = 4 for HC, n = 10 for ACPA+ group, and n = 10 for ACPA- group. d UMAP visualization of B cell subsets from STMC. We identified 8 B cell clusters across 4151 cells. Cells are marked by ACPA type (left) and cell subtype (right). e Violin plots showing marker genes across STMC B cell subtypes. The y axis represents log-scaled normalized counts. f Left: bar plots showing the relative percentage of STMC B cell subtypes for each sample as in d. Right: box plots showing the proportions of STMC each B cell subtypes across ACPA groups. Cell types showed enrichment in ACPA+ or ACPA- subgroups are marked. P values were calculated by the two-sided Wilcoxon test. n = 10 for ACPA+ group, and n = 10 for ACPA- group.
Fig. 3
Fig. 3. Abnormal B cell class-switching in patients with ACPA- RA.
a Bar plots showing the DEG (differential expressed genes) enriched Kyoto Encyclopedia of Genes and Genomes (KEGG) pathways and Gene Ontology (GO) terms of HLA-DRB5+ Plasma B. P values were calculated using Hyper Geometric Test, and q values were adjusted from p values using the Benjamini-Hochberg method. b Pseudotime reconstruction and developmental trajectory of B cells in PBMCs inferred by Monocle 3. Predicted developmental trajectories are shown using arrows. c. Bar plots showing the DEG (differential expressed genes) enriched Kyoto Encyclopedia of Genes and Genomes (KEGG) pathways and Gene Ontology (GO) terms of specific B cell subtypes. P values were calculated using Hyper Geometric Test, and q values were adjusted from p values using the Benjamini-Hochberg method. d Violin plots showing the differences in immunoglobin gene expression between ACPA- and ACPA+ B cells in PBMC. The y axis represents log-scaled normalized counts. P values were calculated by the two-sided Wilcoxon test. *p < 0.05, **p < 0.01, ***p < 0.001. e Violin plots showing the differences in HLA-DRB5 gene and chemokine gene expression between ACPA- and ACPA+ B cells in STMC. Asterisks indicate the significance. The y axis represents log-scaled normalized counts. P values were calculated by the two-sided Wilcoxon test. *p < 0.05, **p < 0.01, ***p < 0.001.
Fig. 4
Fig. 4. Enrichment of CCL+ DC subsets in synovial tissue from patients with ACPA- RA.
a UMAP visualization of dendritic cell (DC) subtypes from the synovium. We identified eight DC clusters across 3369 cells. Cells are marked by ACPA type (left) and cell subtypes (right). b Violin plots showing marker genes across STMC DC subtypes. The y axis represents log-scaled normalized counts. c Left: bar plots showing the relative percentage of STMC DC subtypes for each sample as in a Right: box plots showing the proportions of each STMC DC subtypes across ACPA groups. n = 10 for ACPA+ group, and n = 10 for ACPA- group. d Violin plots showing the differences in interested gene expression between ACPA- and ACPA+ DC subtypes in STMC. Asterisks indicate the significance. The y axis represents log-scaled normalized counts. P values were calculated by the two-sided Wilcoxon test. *p < 0.05, **p < 0.01, ***p < 0.001.
Fig. 5
Fig. 5. Identification of macrophage subsets in the synovium of patients with RA.
a UMAP visualization of macrophages from the synovium. Among 46,973 cells, we identified 11 macrophage subtypes. Cells are marked by ACPA type(left) and cell subtypes (right). b Violin plots showing marker genes across cell subtypes in A. The y axis represents log-scaled normalized counts. c Left: Bar plots showing the relative percentage of STMC macrophage subtypes for each sample as in a. Right: Box plots showing the proportions of each STMC macrophage subtypes across ACPA groups. Cell types showed enrichment in ACPA+ or ACPA- subgroups are marked with *P values were calculated by the two-sided Wilcoxon test. *p < 0.05 (from left to right, p = 0.021, 0.043), **p < 0.01 (p = 0.0093). n = 10 for ACPA+ group, and n = 10 for ACPA- group. d Violin plots showing the differences in the expression of IL1B, TGFB1, and CD36 between ACPA- and ACPA+ macrophage subtypes in STMC. Asterisks indicate the significance. P values were calculated by the two-sided Wilcoxon test. *p < 0.05, **p < 0.01, ***p < 0.001.
Fig. 6
Fig. 6. CCL+ macrophages are enriched in the synovial tissue of patients with ACPA- RA.
a Violin plots showing the differences in the expression of HLA-DRB5, CCL3, CCL13, CCL18, and MMP3 between ACPA- and ACPA+ macrophage subtypes in STMC. Asterisks indicate the significance. P values were calculated by the two-sided Wilcoxon test. *p < 0.05, **p < 0.01, ***p < 0.001. b Immunohistochemistry of CCL3, CCL13, and CCL18 expression in the synovial tissue of 3 OA, 3 ACPA- RA, and 3 ACPA+ RA patients. The immunohistochemistry results were carried out in one independent experiment of three biological replicates from each group.
Fig. 7
Fig. 7. Heterogeneous subpopulations of T and NK cell subsets in the blood of patients with RA.
a UMAP visualization of T/NK cells from PBMC, with 13 cell subtypes identified across 70,650 cells. Cells are marked by ACPA type(left) and cell subtypes (right). b Violin plots showing marker genes across PBMC T/NK cell subtypes in a. The y axis represents log-scaled normalized counts. c Bar plots showing the relative percentage of T/NK cell subtypes in PBMC for each sample.
Fig. 8
Fig. 8. Expression pattern of T and NK cell subsets in the blood of patients with RA.
a Box plots showing the proportions of each T/NK cell subtype in PBMC across ACPA groups. Cell types showed enrichment in ACPA+ or ACPA- subgroups are marked with *. P values were calculated by the two-sided Wilcoxon test. *p < 0.05 (from left to right, p = 0,014, 0.011, 0.024, and 0.036), **p < 0.01 (p = 0.004). n = 4 for HC, n = 10 for ACPA+ group, and n = 10 for ACPA- group. b Bar plots showing the enriched upregulated KEGG pathways and GO biological processes in terms of specific T/NK cell subtypes. c Violin plots showing the differences in interested gene expression between ACPA- and ACPA+ T/NK cell subtypes in PBMC. Asterisks indicate the significance. P values were calculated by the two-sided Wilcoxon test. *p < 0.05, **p < 0.01, ***p < 0.001.
Fig. 9
Fig. 9. Identification of synovial T and NK cell subsets in patients with RA.
a UMAP visualization of T/NK cells from STMC, with eight-cell subtypes identified across 5760 cells. b Violin plots showing marker genes across STMC T/NK cell subtypes in F. The y axis represents log-scaled normalized counts. c Top: bar plots showing the relative percentage of T/NK cell subtypes in STMC for each sample. Bottom: box plots showing the proportions of each T/NK cell subtype in STMC across ACPA groups. Cell types showed enrichment in ACPA+ or ACPA- subgroups are marked with *. P values were calculated by the two-side Wilcoxon test. *p < 0.05 (from left to right, p = 0.029, 0.014, 0.021). n = 10 for ACPA+ group, and n = 10 for ACPA- group. d Violin plots showing the differences in interested gene expression between ACPA- and ACPA+ T/NK cell subtypes in STMC. Asterisks indicate the significance. P values were calculated by the two-sided Wilcoxon test. *p < 0.05, **p < 0.01, ***p < 0.001.
Fig. 10
Fig. 10. Interaction relationships between macrophage, DC, T cell, and NK cell subsets.
a Heatmap displaying the key cell-cell interaction pairs in PBMC. b Heatmap displaying the key cell-cell interaction pairs in the synovium. c Dot plot showing the significant ligand-receptor pairs involved in the interaction between DC subsets and CD4 T cell subsets. d Dot plot showing the significant ligand-receptor pairs involved in the interaction between macrophage subsets and T cell or NK subsets. (Ligand: T cell or NK subsets, Receptor: Macrophage subsets). e Dot plot showing the significant ligand-receptor pairs involved in the interaction between T cell or NK subsets and macrophage subsets. (Ligand: Macrophage subsets, Receptor: T cell or NK subsets).

References

    1. Daha NA, Toes REM. Rheumatoid arthritis: are ACPA-positive and ACPA-negative RA the same disease? Nat. Rev. Rheumatol. 2011;7:202–203. doi: 10.1038/nrrheum.2011.28. - DOI - PubMed
    1. Schett G, Gravallese E. Bone erosion in rheumatoid arthritis: mechanisms, diagnosis and treatment. Nat. Rev. Rheumatol. 2012;8:656–664. doi: 10.1038/nrrheum.2012.153. - DOI - PMC - PubMed
    1. Padyukov L, et al. A genome-wide association study suggests contrasting associations in ACPA-positive versus ACPA-negative rheumatoid arthritis. Ann. Rheum. Dis. 2011;70:259–265. doi: 10.1136/ard.2009.126821. - DOI - PMC - PubMed
    1. MalmstroM V, Catrina AI, Klareskog L. The immunopathogenesis of seropositive rheumatoid arthritis: from triggering to targeting. Nat. Rev. Immunol. 2017;17:60–75. doi: 10.1038/nri.2016.124. - DOI - PubMed
    1. Ajeganova S, Huizinga TW. Rheumatoid arthritis: seronegative and seropositive RA: alike but different? Nat. Rev. Rheumatol. 2015;11:8–9. doi: 10.1038/nrrheum.2014.194. - DOI - PubMed

Publication types

MeSH terms