. 2021 Aug 17;12(1):4980.
doi: 10.1038/s41467-021-25259-2.

Spatiotemporally-resolved mapping of RNA binding proteins via functional proximity labeling reveals a mitochondrial mRNA anchor promoting stress recovery

Affiliations

Spatiotemporally-resolved mapping of RNA binding proteins via functional proximity labeling reveals a mitochondrial mRNA anchor promoting stress recovery

Wei Qin et al. Nat Commun. .

Abstract

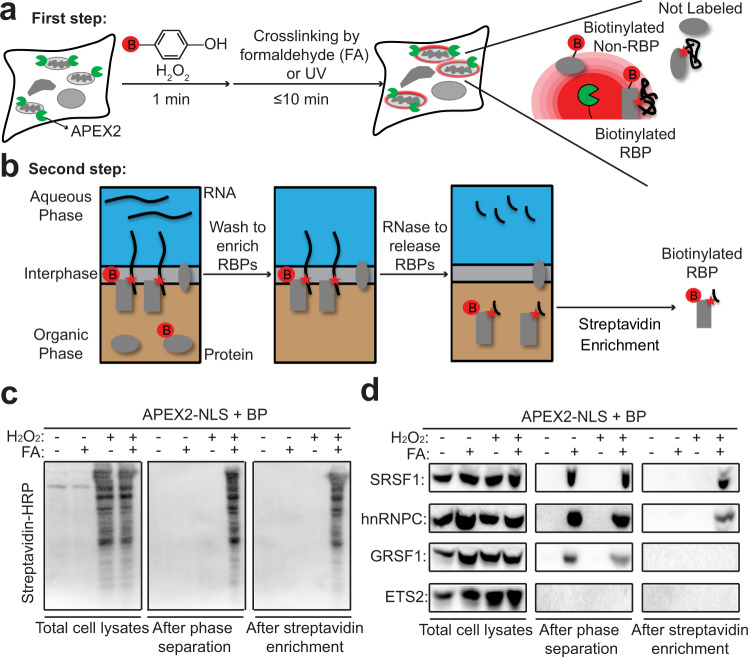
Proximity labeling (PL) with genetically-targeted promiscuous enzymes has emerged as a powerful tool for unbiased proteome discovery. By combining the spatiotemporal specificity of PL with methods for functional protein enrichment, we show that it is possible to map specific protein subclasses within distinct compartments of living cells. In particular, we develop a method to enrich subcompartment-specific RNA binding proteins (RBPs) by combining peroxidase-catalyzed PL with organic-aqueous phase separation of crosslinked protein-RNA complexes ("APEX-PS"). We use APEX-PS to generate datasets of nuclear, nucleolar, and outer mitochondrial membrane (OMM) RBPs, which can be mined for novel functions. For example, we find that the OMM RBP SYNJ2BP retains specific nuclear-encoded mitochondrial mRNAs at the OMM during translation stress, facilitating their local translation and import of protein products into the mitochondrion during stress recovery. Functional PL in general, and APEX-PS in particular, represent versatile approaches for the discovery of proteins with novel function in specific subcellular compartments.


Conflict of interest statement

The authors declare no competing interests.

Figures

Fig. 1
Fig. 1. Development and validation of functional proximity labeling to study subcellular phosphorylation and O-GlcNAcylation.
a The workflow of functional PL that combines APEX-catalyzed PL with functional protein enrichment (e.g., phase separation, IMAC, or WGA) and streptavidin bead capture to enrich subcellular protein subclasses. b Procedure combining APEX-catalyzed PL with IMAC to enrich subcellular phosphoproteins. Red B, biotin. Blue P, phosphorylation. c Western blot detection of known nuclear phosphoproteins in lysates from HEK cells expressing APEX2-NLS. After 1 min of biotin-phenol labeling, cells were lysed and subjected to IMAC and streptavidin enrichment as shown in b. SMAD2 and Histone H3 are true-positive nuclear phosphoproteins. TOMM20 and CANX are true negative mitochondrial and ER phosphoproteins, respectively. Phosphatase treatment of cell lysate removes phosphorylation. d Specificity validation for nuclear O-GlcNAcylated proteins captured by WGA and streptavidin tandem enrichment. Lysates generated from HEK cells expressing APEX2-NLS, labeled for 1 min with biotin-phenol. SP1 and FBL are true-positive nuclear O-GlcNAcylated proteins. SDHA is a true negative mitochondrial O-GlcNAcylated protein, and NHP2L1 is a true negative nuclear protein that is not O-GlcNAcylated. OSMI-1 is an O-GlcNAc transferase inhibitor that reduces global O-GlcNAcylation level. e Model of 12-O-tetradecanoylphorbol-13-acetate (TPA)-stimulated phosphorylation and nuclear translocation of ERK2. f Western blot analysis of phosphorylated ERK2 (APEX-IMAC) and total ERK2 (APEX only) levels in the nucleus (APEX2-NLS) and cytosol (APEX2-NES). Statistical analysis (Two-sided Student’s t-test) shown below. Values represent means ± SD from three biological replicates.
Fig. 2
Fig. 2. Development and validation of APEX-Phase Separation (APEX-PS) for enrichment of subcellular RNA-binding proteins (RBPs).
a In the first step of APEX-PS, 1 min APEX-catalyzed biotinylation is carried out, followed by 10 min of RNA–protein crosslinking in living cells. Red B, biotin. RBP, RNA-binding protein. b In the second step of APEX-PS, phase separation of cell lysate from a localizes crosslinked protein–RNA complexes to the interphase, while free proteins and RNA localize to the organic and aqueous phases, respectively. After washing, RNA-crosslinked proteins are released from the interphase by RNase treatment and subjected to streptavidin bead-based enrichment of biotinylated proteins. c Streptavidin blotting reveals enrichment of nuclear RBPs by APEX-PS. Biotinylation and formaldehyde crosslinking were performed in HEK293T cells expressing nuclear-localized APEX (APEX-NLS). Streptavidin blotting was performed on total cell lysate (left), samples after phase separation (middle), and samples after both phase separation and streptavidin enrichment (right). d Western blot detection of known nuclear RBPs in samples from c. SRSF1 and hnRNPC are true-positive nuclear RBPs, GRSF1 is a mitochondrial RBP, and ETS2 is a nuclear protein that does not bind RNA (non-RBP).
Fig. 3
Fig. 3. Proteomic profiling of nuclear RBPs by APEX-PS.
a Experimental design and labeling conditions for TMT-based proteomics. HEK293T cells stably expressing nuclear APEX2-NLS (samples 2–6) or nucleolar APEX2-NIK3x (samples 7–11) were subjected to proximity biotinylation and FA crosslinking. The control samples omitted enzyme (sample 1), H2O2 (sample 2 and 7), or FA (3 and 8). b Confocal fluorescence imaging of APEX2 localization (V5 or GFP) and biotinylation activity (neutravidin-Alexa 647) in the nucleus (top) and nucleolus (bottom). Live-cell biotinylation was performed for 1 min before fixation. DAPI stains nuclei. Scale bars, 10 μm. c Numbers of proteins remaining after each step of filtering the mass spectrometry data using the “pairwise ROC strategy”. The final “nuclear RBPome1” obtained by APEX-PS has 791 proteins (Supplementary Data 2). d GO biological process analysis of nuclear RBPs identified by APEX-PS. The number of proteins in each GO term is shown. e GO cellular component analysis of nuclear RBPs identified by APEX-PS. f RBP specificity of nuclear datasets. For comparison, nuclear RBPs identified by fractionation, were analyzed in the same manner. Details in Supplementary Data 2. g Nuclear specificity of nuclear RBP datasets identified by APEX-PS, compared to nuclear RBPs identified by fractionation (RBR-ID and serIC). h Using a list of 155 true-positive nuclear RBPs, the coverage of APEX-PS was compared to fractionation-based methods. i Overlap of APEX-PS datasets with global RBP dataset obtained by OOPS. Bottom: Comparison of protein abundance for RBPs identified by both methods to those identified by APEX-PS only. j Subclassification of RBPs in nuclear APEX-PS dataset. Many RBPs we enriched bind to poly(A). Of the remainder, 90 have been experimentally shown to bind to the 7 RNA classes at right. Details in Supplementary Data 2. k Comparison of FA-dependent APEX-PS enrichment for RRM-containing RBPs (green) versus unknown (gray)-RBD-containing proteins in the nuclear APEX-PS dataset. Box limits represent 25th percentiles, medians, and 75th percentiles. Statistical analysis was performed with one-sided Wilcoxon rank sum test.
Fig. 4
Fig. 4. Proteomic profiling of nucleolar RBPs by APEX-PS.
a Numbers of proteins remaining after each step of filtering the mass spectrometric data using the “pairwise ROC strategy”. The final nucleolar RBPome has 252 proteins (Supplementary Data 3). b Sample histogram showing how the cutoff for 130 C/126 C TMT ratio was applied. c GO cellular component analysis of nucleolar RBPs identified by APEX-PS. d GO biological process analysis of nucleolar RBPs identified by APEX-PS. e Molecular complexes enriched in nucleolar RBPome. Gray lines indicate protein-protein interactions annotated by the STRING database. f Nuclear specificity of nucleolar RBPome. g RBP specificity of nucleolar dataset. See Supplementary Data 3 for details. h Overlap with global RBP dataset obtained by OOPS. Bottom: Comparison of protein abundance for RBPs identified by both methods to those identified by APEX-PS only. Box limits represent 25th percentiles, medians, and 75th percentiles. Statistical analysis was performed with one-sided Wilcoxon rank sum test. i Validation of MIS18A and ATAD5 as novel nucleolar RBPs by UV crosslinking APEX-PS. j Validation of the RNA binding of MIS18A and ATAD5 by metabolic labeling of RNA by 5-EU and UV crosslinking. k Confocal imaging of endogenous MIS18A and ATAD5. Anti-FBL stains nucleolus and DAPI stains nuclei. Scale bars, 10 μm.
Fig. 5
Fig. 5. Proteomic profiling of RBPs localized to the outer mitochondrial membrane by APEX-PS.
a Experimental design and labeling conditions for TMT-based proteomics. HEK cells stably expressing APEX2-OMM were subjected to proximity biotinylation, FA crosslinking, and enrichment according to Fig. 1a-b. The control samples omitted H2O2 (samples 1 and 5) or FA (samples 2 and 6). Cytosolic APEX2-NES was included as a reference for ratiometric analysis (samples 9–11). b Schematic showing expected changes at the OMM upon treatment with puromycin (PUR), which inhibits protein translation and disrupts polysomes. Blue lines, RNA. Gray shapes, potential RBPs. c Numbers of proteins remaining after each step of filtering the mass spectrometric data. The final nuclear −PUR and +PUR OMM RBP proteomes obtained by APEX-PS have 28 and 15 proteins, respectively. d Overlap of OMM-localized RBPs under basal and +PUR conditions. RBP orphans (proteins with no previous RNA-binding annotation in literature) are starred. e Mitochondrial specificity of OMM RBPs identified by APEX-PS. For comparison, same analysis was performed on entire human proteome. f RBP specificity of APEX-PS OMM datasets. Details in Supplementary Data 5.
Fig. 6
Fig. 6. SYNJ2BP binds to specific mitochondrial mRNAs at the OMM and promotes their translation during recovery from stress.
a Validation of five hits from Fig. 5d as OMM-localized RBPs by UV crosslinking-based APEX-PS. Non-RBP ACTB was used as a negative control. b Validation of RNA-binding activity using metabolic RNA labeling by 5-EU and UV crosslinking. c Confocal imaging of mitochondrial RBP orphan TAX1BP1. Anti-TOMM20 stains mitochondria and DAPI stains nuclei. Scale bars, 10 μm. d Comparison of RNA-binding activities for OMM-localized and nuclear-localized EXD2 using APEX-PS-OMM and APEX-PS-NLS. Direct streptavidin enrichment (APEX only) was performed to quantify total EXD2 protein levels in each compartment. PS only condition shows RNA-binding activity of total EXD2. e Validation of mitochondria-related SYNJ2BP clients in the absence or presence of protein translation inhibitor PUR by CLIP and qRT-PCR. IARS2 is an OMM-localized mRNA not identified to bind with SYNJ2BP. Other SYNJ2BP clients and negative controls are shown in Supplementary Fig. 10a. f Evaluation of OMM localization of SYNJ2BP clients in SYNJ2BP knockout cells by APEX-mediated proximity labeling of RNA. The OMM localization was determined by comparing APEX2-OMM with APEX2-NES labeling (y-axis). Other SYNJ2BP clients and negative controls are shown in Supplementary Fig. 10d. g Impact of SYNJ2BP knockout on protein synthesis of SYNJ2BP-regulated clients under different cellular states. The newly synthesized proteins were labeled by AHA and captured by click-based enrichment. HSP60 is a mitochondrial protein not identified as a target of SYNJ2BP. Right: quantification of western blot data from three biological replicates. Two-sided Student’s t-test was performed and values represent means ± SD from three biological replicates.
Fig. 7
Fig. 7. SYNJ2BP improves mitochondrial OXPHOS recovery and cell viability following stress.
a, b Evaluation of Complex III (a) and IV (b) activities in SYNJ2BP knockout cells. c Evaluation of complex I–V assembly 12 h following treatment of HEK cells with protein translation inhibitor PUR. The quantification of each OXPHOS complex is shown below; data from three independent biological replicates. d Evaluation of cell viability 12 h following treatment of HEK cells with PUR. e, f Evaluation of protein synthesis for SYNJ2BP clients in SYNJ2BP knockout cells following heat (e) and sodium arsenite (f) stresses. The quantification of western blot data from three biological replicates is shown in Supplementary Fig. 12b-c. g Evaluation of Complex III activity in SYNJ2BP knockout cells following heat stress. h Working model of SYNJ2BP’s role in retaining important (blue) mRNAs at the OMM during stress, to facilitate their rapid local translation for restoration of mitochondrial function during stress recovery (right). Two-sided Student’s t-test was performed and values represent means ± SD from three biological replicates.

Similar articles

Cited by

References

    1. Qin W, et al. Deciphering molecular interactions by proximity labeling. Nat. Methods. 2021;18:133–143. doi: 10.1038/s41592-020-01010-5. - DOI - PMC - PubMed
    1. Samavarchi-Tehrani P, Samson R, Gingras AC. Proximity dependent biotinylation: key enzymes and adaptation to proteomics approaches. Mol. Cell. Proteomics. 2020;19:757–773. doi: 10.1074/mcp.R120.001941. - DOI - PMC - PubMed
    1. Rhee HW, et al. Proteomic mapping of mitochondria in living cells via spatially restricted enzymatic tagging. Science. 2013;339:1328–1331. doi: 10.1126/science.1230593. - DOI - PMC - PubMed
    1. Branon TC, et al. Efficient proximity labeling in living cells and organisms with TurboID. Nat. Biotechnol. 2018;36:880–887. doi: 10.1038/nbt.4201. - DOI - PMC - PubMed
    1. Roux KJ, Kim DI, Raida M, Burke B. A promiscuous biotin ligase fusion protein identifies proximal and interacting proteins in mammalian cells. J. Cell Biol. 2012;196:801–810. doi: 10.1083/jcb.201112098. - DOI - PMC - PubMed

Publication types