. 2021 Aug 17;12(1):4984.
doi: 10.1038/s41467-021-25312-0.

Protective humoral and cellular immune responses to SARS-CoV-2 persist up to 1 year after recovery

Affiliations

Protective humoral and cellular immune responses to SARS-CoV-2 persist up to 1 year after recovery

Chengqian Feng et al. Nat Commun. .

Abstract

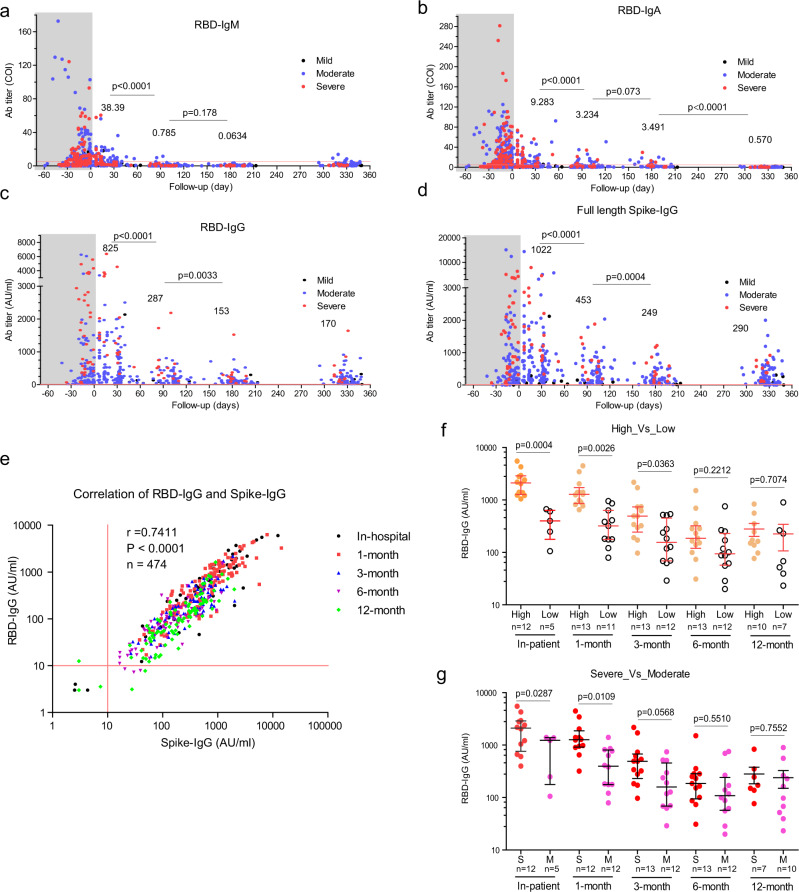
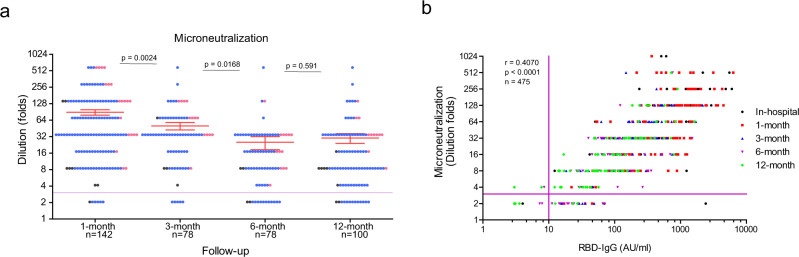
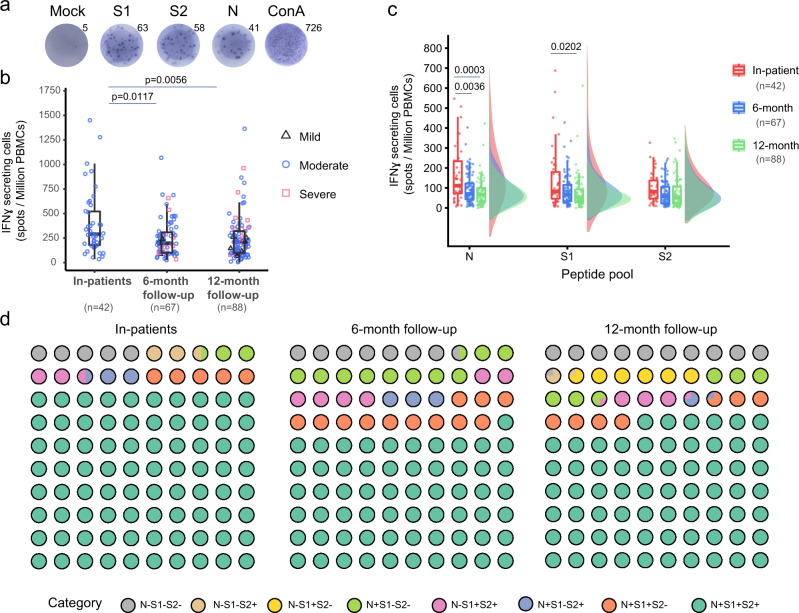
SARS-CoV-2 vaccination has been launched worldwide to build effective population-level immunity to curb the spread of this virus. The effectiveness and duration of protective immunity is a critical factor for public health. Here, we report the kinetics of the SARS-CoV-2 specific immune response in 204 individuals up to 1-year after recovery from COVID-19. RBD-IgG and full-length spike-IgG concentrations and serum neutralizing capacity decreases during the first 6-months, but is maintained stably up to 1-year after hospital discharge. Even individuals who had generated high IgG levels during early convalescent stages had IgG levels that had decreased to a similar level one year later. Notably, the RBD-IgG level positively correlates with serum neutralizing capacity, suggesting the representative role of RBD-IgG in predicting serum protection. Moreover, viral-specific cellular immune protection, including spike and nucleoprotein specific, persisted between 6 months and 12 months. Altogether, our study supports the persistence of viral-specific protective immunity over 1 year.


Conflict of interest statement

The authors declare no competing interests.

Figures

Fig. 1
Fig. 1. Kinetics of SARS-CoV-2 viral-specific antibodies up to 1 year.
SARS-CoV-2 infected individuals who attended the follow-up program were included in this analysis. ac RBD-IgM, IgA, and IgG changes since symptom on-set. x-axis, follow-up time (day). y-axis, antibody titer (COI cut-off index; or arbitrary unit, AU/ml). The shaded regions represent the in-patient stage. The average values in the 1-month, 3-month, 6-month, and 12-month stages were labeled. P values (two-tailed) were shown. Mild (black dots), moderate (blue dots), and severe (red dots) symptoms. d Full-length spike-IgG changes since symptom on-set. x-axis, follow-up time (day). y-axis, antibody titer (AU/ml). e Correlation of RBD-IgG and Spike-IgG. In-hospital stage (black), 1-month follow-up (red), 3-month follow-up (blue), 6-month follow-up (purple), 12-month follow-up (green). Pearson r number and p value (two-tailed) were shown. f Longitudinal analysis of RBD-specific IgG between patients with high titer (RBD-IgG >1000 AU/ml, orange circle) and patients with low titer (RBD-IgG <1000 AU/ml, empty circle). g Longitudinal analysis of RBD-specific IgG between severe patients (red circle) and moderate patients (pink circle). Lines in x-axis and y-axis in ae indicate the cut-off values. ad, Mean values were labeled for each column. f, g, Data were presented as median with interquartile range. An unpaired t-test with Welch’s correction analysis was applied, and p values (two-tailed) were labeled. Source data are provided as a Source Data file.
Fig. 2
Fig. 2. Longitudinal analysis of serum protection against SARS-CoV-2 infection.
Serum collected from multiple time points were tested against alive SARS-CoV-2 virus infection. a Microneutralization assay was performed using an alive SARS-CoV-2 infection cell culture system. y-axis, serum dilution folds. Data were presented as mean value ± SEM. Colored dots represent disease severity. Mild (blank dots), moderate (blue dots), and severe (red dots) symptoms. An unpaired t-test with Welch’s correction analysis was applied, and p values (two-tailed) were labeled. b Correlation of microneutralization (dilution folds) and RBD-IgG (arbitrary unit, AU/ml). A total of 475 pairs were analyzed, and Pearson r and p value (two-tailed) were shown. Lines in x-axis and y-axis in a and b indicate the cut-off values. Source data are provided as a Source Data file.
Fig. 3
Fig. 3. SARS-CoV-2 specific T cells response in recovered COVID-19 patients.
a Representative ELISpot well images displaying IFNγ-secreting cells. N, S1, and S2, Synthetic overlapping peptide pool of nucleocapsid (N), Spike 1 subunit (S1), and 2 (S2). Con A, Concanavalin A positive control. b Spot numbers of IFNγ-secreting cells indicating the reduction in SARS-CoV-2 specific immune response over time. The numbers are the sum of N, S1, S2-stimulated wells. Data were presented as median with interquartile range. c Raincloud plots show different T cellular response levels among three peptide pools at different time points of follow-up. d Waffle dot plot showing composition percentage of the SARS-CoV-2 response during 1-year follow-up. Statistics by Mann–Whitney U-test. P value (two-tailed) were shown. b, c Data were represented as box-and-whisker plots (median with interquartile, upper-limit, and lower-limit). Source data are provided as a Source Data file.

Similar articles

Cited by

References

    1. Garcia-Beltran WF, et al. COVID-19-neutralizing antibodies predict disease severity and survival. Cell. 2020;184:476–488. doi: 10.1016/j.cell.2020.12.015. - DOI - PMC - PubMed
    1. Deng W, et al. Primary exposure to SARS-CoV-2 protects against reinfection in rhesus macaques. Science. 2020;369:818–823. doi: 10.1126/science.abc5343. - DOI - PMC - PubMed
    1. Chen P, et al. SARS-CoV-2 neutralizing antibody LY-CoV555 in outpatients with Covid-19. N. Engl. J. Med. 2020;384:229–237. doi: 10.1056/NEJMoa2029849. - DOI - PMC - PubMed
    1. Polack FP, et al. Safety and efficacy of the BNT162b2 mRNA Covid-19 vaccine. N. Engl. J. Med. 2020;383:2603–2615. doi: 10.1056/NEJMoa2034577. - DOI - PMC - PubMed
    1. Huang C, et al. 6-month consequences of COVID-19 in patients discharged from hospital: a cohort study. Lancet. 2021;397:220–232. doi: 10.1016/S0140-6736(20)32656-8. - DOI - PMC - PubMed

Publication types

MeSH terms