. 2021 Aug 17;12(1):4979.
doi: 10.1038/s41467-021-25256-5.

Parallel adaptation in autopolyploid Arabidopsis arenosa is dominated by repeated recruitment of shared alleles

Affiliations

Parallel adaptation in autopolyploid Arabidopsis arenosa is dominated by repeated recruitment of shared alleles

Veronika Konečná et al. Nat Commun. .

Abstract

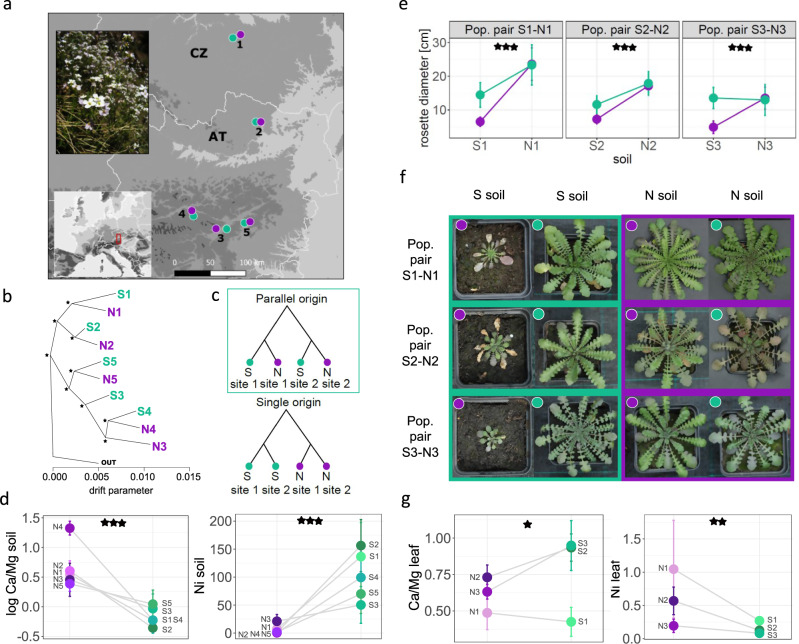
Relative contributions of pre-existing vs de novo genomic variation to adaptation are poorly understood, especially in polyploid organisms. We assess this in high resolution using autotetraploid Arabidopsis arenosa, which repeatedly adapted to toxic serpentine soils that exhibit skewed elemental profiles. Leveraging a fivefold replicated serpentine invasion, we assess selection on SNPs and structural variants (TEs) in 78 resequenced individuals and discover significant parallelism in candidate genes involved in ion homeostasis. We further model parallel selection and infer repeated sweeps on a shared pool of variants in nearly all these loci, supporting theoretical expectations. A single striking exception is represented by TWO PORE CHANNEL 1, which exhibits convergent evolution from independent de novo mutations at an identical, otherwise conserved site at the calcium channel selectivity gate. Taken together, this suggests that polyploid populations can rapidly adapt to environmental extremes, calling on both pre-existing variation and novel polymorphisms.


Conflict of interest statement

The authors declare no competing interests.

Figures

Fig. 1
Fig. 1. Parallel adaptation of Arabidopsis arenosa to challenging serpentine soils.
a Locations of the investigated serpentine (S, green) and non-serpentine (N, violet) populations sampled as spatially proximate pairs (numbers) in Central Europe with an illustrative photo of an S population (photo was taken by F. Kolář). b Allele frequency covariance graph of populations based on ~870,000 fourfold-degenerate SNPs; asterisks show the 100 bootstrap branch support. The outgroup (OUT) is represented by a tetraploid population from Western Carpathians, the ancestral area of tetraploid A. arenosa. c Two contrasting evolutionary scenarios of serpentine colonisation compared in coalescent simulations; the topology assuming independent serpentine colonisations (framed in green) received the highest support consistently across all 10 pairwise combinations of S–N population pairs. d Differences in Ca/Mg ratio and in Ni concentrations [µg/g] in S and N soils from the original sampling sites (n = 78 individual samples, one-way ANOVAs: F1,77 = 26.5, p = 1.94e−06 and F1,77 = 117.4, p = 2.01e−16 for Ca/Mg and Ni, respectively). e Differences in maximum rosette size of three population pairs attained after 3 months of cultivation in local serpentine and non-serpentine substrates (significance of the soil treatment × soil origin interaction in a two-way ANOVA is indicated: F1,90 = 21.6, p = 1.17e−05, F1,96 = 12.3, p = 6.88e−04, and F1,85 = 42, p = 5.68e−09 for population pairs 1, 2 and 3, respectively). f Example photos illustrating parallel growth response in the three population pairs to serpentine soils (green frame) depending on the soil of origin (dot colour) (photo was taken by V. Konečná). g Differences in ion uptake between originally S and N individuals when cultivated in serpentine soils; Ni concentrations were standardised by corresponding soil Ni values (n = 28 individual samples, one-way ANOVAs: F1,27 = 6.2, p = 0.019 and F1,27 = 13.5, p = 0.001 for Ca/Mg ratio and Ni, respectively). Points denote mean, error bars depict standard error of mean in charts e, d, g. Source data underlying Fig. 1d, g are provided as a Source data file.
Fig. 2
Fig. 2. Parallel serpentine adaptation candidates and the sources of parallel variants in A. arenosa.
a Intersection of candidates from each population pair (S1–N1 to S5–N5) demonstrating more genes repeatedly found as candidates across two, three, and four population pairs than expected by chance alone (all intersections were significant at p < 0.01 (highlighted by asterisks), one-sided Fisher’s exact test); note: the colour intensity of the bars represents the p value significance of the intersections. b Gene ontology (GO) enrichment of the candidates (across all population pairs); GO categories: biological process (BP) and molecular function (MF); for complete list of GO terms, see Supplementary Data 4. c Overlap between parallel differentiation candidates and latent factor mixed model (LFMM) candidates resulting in 61 serpentine adaptation candidate genes. d Proportions of serpentine adaptation candidates originating from de novo mutations or being of shared origin out of the total of 29 cases of non-neutral parallelism as inferred by the Distinguishing among Modes of Convergence approach (DMC; see text for details). e Two examples of parallel candidate loci, illustrating nucleotide divergence and maximum composite log-likelihood (MCL) estimation of the source of the selected alleles in these particular loci inferred in DMC. Allele frequency difference (AFD) for locus with independent de novo mutations (left) and with parallel recruitment of shared ancestral standing variation (right). Left y-axis: AFD between S and N populations. Dots: AFD values of individual SNPs; bright green circles: non-synonymous SNPs with AFD ≥ 0.4; lines (right y-axis): MCL difference between neutral versus parallel selection scenario following colour scheme in d; gene models are in blue.
Fig. 3
Fig. 3. Serpentine-private, convergent de novo high-impact protein changes in the TWO PORE CHANNEL 1 (TPC1) locus.
a All populations with serpentine-specific variants and all other resequenced A. arenosa populations in the focal area of Eastern Alps, showing frequencies of amino acid substitutions at residue 630 as pie charts (map drawn by V. Konečná). b Population frequencies of substitutions in the residue 630 among 1,724 alleles from range-wide A. arenosa resequenced samples. Colours denote frequencies from ancestral non-serpentine (violet) to serpentine-specific alleles (green) and number in brackets denotes total N of alleles screened. c Cross-kingdom conservation of the site shown by multiple sequence alignment of surrounding exon, including consensus sequences (AF > 0.5) from all serpentine A. arenosa populations (in S5 population, the frequency of Val630Leu is 0.5). Residues are coloured according to the percentage that matches the consensus sequence from 100% (dark blue) to 0% (white), the position of the serpentine-specific high-frequency non-synonymous polymorphism is highlighted in red. dg Structural homology models of A. arenosa TPC1 alleles. Dimeric subunits are coloured blue or marine. Non-synonymous variation that is not linked to serpentine soil is coloured deep purple. Residue 630 is coloured red and drawn as sticks. The adjacent residue, 627 (631 in A. thaliana), which has an experimentally demonstrated key role in selectivity control, is yellow and drawn as sticks. d Side view of the non-serpentine allele. e Top view of the non-serpentine allele with the detail of the pore opening depicted in the inset. f Top view of the Leu630 allele private for S3 and S5 populations. g Top view of the Tyr630 allele private for S4 population. Source data underlying Fig. 3a, b are provided as a Source data file.

References

    1. Stern DL. The genetic causes of convergent evolution. Nat. Rev. Genet. 2013;14:751–764. doi: 10.1038/nrg3483. - DOI - PubMed
    1. Barrett RDH, Schluter D. Adaptation from standing genetic variation. Trends Ecol. Evol. 2008;23:38–44. doi: 10.1016/j.tree.2007.09.008. - DOI - PubMed
    1. Wood TE, et al. The frequency of polyploid speciation in vascular plants. Proc. Natl Acad. Sci. USA. 2009;106:13875–13879. doi: 10.1073/pnas.0811575106. - DOI - PMC - PubMed
    1. Soltis DE, Visger CJ, Soltis PS. The polyploidy revolution then…and now: Stebbins revisited. Am. J. Bot. 2014;101:1057–1078. doi: 10.3732/ajb.1400178. - DOI - PubMed
    1. Van De Peer Y, Mizrachi E, Marchal K. The evolutionary significance of polyploidy. Nat. Rev. Genet. 2017;18:411–424. doi: 10.1038/nrg.2017.26. - DOI - PubMed

Publication types