

Emergency Department Quality Dashboard; a Systematic Review of Performance Indicators, Functionalities, and Challenges
- PMID: 34405145
- PMCID: PMC8366462
- DOI: 10.22037/aaem.v9i1.1230
Emergency Department Quality Dashboard; a Systematic Review of Performance Indicators, Functionalities, and Challenges
Abstract
Introduction: Effective information management in the emergency department (ED) can improve the control and management of ED processes. Dashboards, known as data management tools, efficiently provide information and contribute greatly to control and management of ED. This study aimed to identify performance indicators quality dashboard functionalities, and analyze the challenges associated with dashboard implementation in the ED.
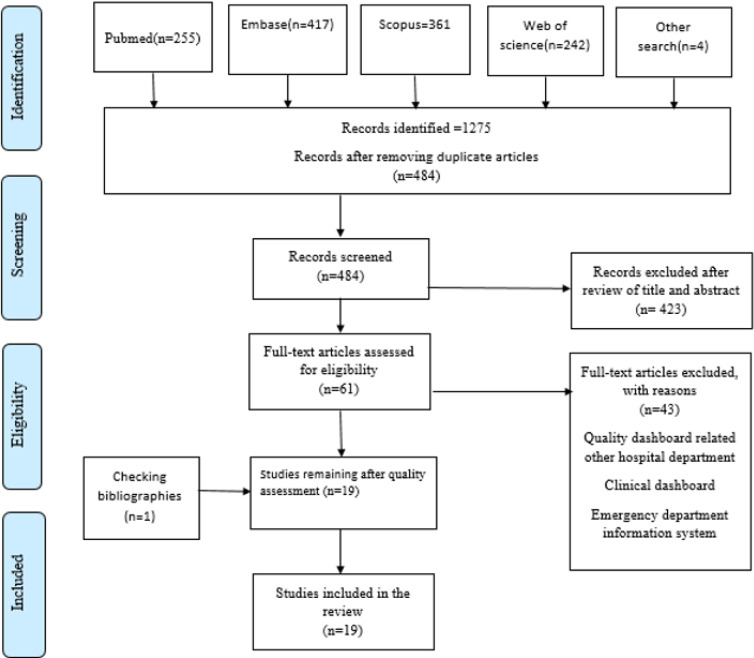
Methods: This systematic review began with a search in four databases (Web of Science, PubMed, Embase, and Scopus) from 2000 to May 30, 2020, when the final search for papers was conducted. The data were collected using a data extraction form and the contents of the extracted papers were analyzed through ED performance indicators, dashboard functionalities, and implementation challenges.
Results: Performance indicators reported in the reviewed papers were classified as the quality of care, patient flow, timeliness, costs, and resources. The main dashboard functionalities noted in the papers included reporting, customization, alert creation, resource management, and real-time information display. The dashboard implementation challenges included data sources, data quality, integration with other systems, adaptability of dashboard functionalities to user needs, and selection of appropriate performance indicators.
Conclusions: Quality dashboards facilitate processes, communication, and situation awareness in the ED; hence, they can improve care provision in this department. To enhance the effectiveness and efficiency of ED dashboards, officials should set performance indicators and consider the conformity of dashboard functionalities with user needs. They should also integrate dashboards with other relevant systems at the departmental and hospital levels.
Keywords: Emergency service; data management; health care; hospital; quality indicators; systematic review.
Conflict of interest statement
The authors declare that they have no competing interests.
Similar articles
-
Requirements and challenges of hospital dashboards: a systematic literature review.BMC Med Inform Decis Mak. 2022 Nov 8;22(1):287. doi: 10.1186/s12911-022-02037-8. BMC Med Inform Decis Mak. 2022. PMID: 36348339 Free PMC article.
-
Usability and Acceptability of Clinical Dashboards in Aged Care: Systematic Review.JMIR Aging. 2023 Jun 19;6:e42274. doi: 10.2196/42274. JMIR Aging. 2023. PMID: 37335599 Free PMC article. Review.
-
Involving end-users in the design of an audit and feedback intervention in the emergency department setting - a mixed methods study.BMC Health Serv Res. 2019 Apr 29;19(1):270. doi: 10.1186/s12913-019-4084-3. BMC Health Serv Res. 2019. PMID: 31035992 Free PMC article.
-
From Information Management to Information Visualization: Development of Radiology Dashboards.Appl Clin Inform. 2016 May 11;7(2):308-29. doi: 10.4338/ACI-2015-08-RA-0104. eCollection 2016. Appl Clin Inform. 2016. PMID: 27437043 Free PMC article.
-
Involving Health Professionals in the Development of Quality and Safety Dashboards: Qualitative Study.J Med Internet Res. 2023 Jun 12;25:e42649. doi: 10.2196/42649. J Med Internet Res. 2023. PMID: 37307058 Free PMC article.
Cited by
-
Development of a Web-Based Oxygenation Dashboard for Preterm Neonates: A Quality Improvement Initiative.J Med Syst. 2024 Apr 24;48(1):46. doi: 10.1007/s10916-024-02064-0. J Med Syst. 2024. PMID: 38656727 Free PMC article.
-
Work Systems Analysis of Emergency Nurse Patient Flow Management Using the Systems Engineering Initiative for Patient Safety Model: Applying Findings From a Grounded Theory Study.JMIR Hum Factors. 2024 Dec 10;11:e60176. doi: 10.2196/60176. JMIR Hum Factors. 2024. PMID: 39656555 Free PMC article.
-
Clinical and economic impact of digital dashboards on hospital inpatient care: a systematic review.JAMIA Open. 2025 Jul 26;8(4):ooaf078. doi: 10.1093/jamiaopen/ooaf078. eCollection 2025 Aug. JAMIA Open. 2025. PMID: 40718761 Free PMC article. Review.
-
Requirements and challenges of hospital dashboards: a systematic literature review.BMC Med Inform Decis Mak. 2022 Nov 8;22(1):287. doi: 10.1186/s12911-022-02037-8. BMC Med Inform Decis Mak. 2022. PMID: 36348339 Free PMC article.
-
Developing public health surveillance dashboards: a scoping review on the design principles.BMC Public Health. 2024 Feb 6;24(1):392. doi: 10.1186/s12889-024-17841-2. BMC Public Health. 2024. PMID: 38321469 Free PMC article.
References
LinkOut - more resources
Full Text Sources