. 2021 Aug;4(4):558-574.
doi: 10.1089/crispr.2021.0021.

CRISPRclassify: Repeat-Based Classification of CRISPR Loci

Affiliations

CRISPRclassify: Repeat-Based Classification of CRISPR Loci

Matthew A Nethery et al. CRISPR J. 2021 Aug.

Abstract

Detection and classification of CRISPR-Cas systems in metagenomic data have become increasingly prevalent in recent years due to their potential for diverse applications in genome editing. Traditionally, CRISPR-Cas systems are classified through reference-based identification of proximate cas genes. Here, we present a machine learning approach for the detection and classification of CRISPR loci using repeat sequences in a cas-independent context, enabling identification of unclassified loci missed by traditional cas-based approaches. Using biological attributes of the CRISPR repeat, the core element in CRISPR arrays, and leveraging methods from natural language processing, we developed a machine learning model capable of accurate classification of CRISPR loci in an extensive set of metagenomes, resulting in an F1 measure of 0.82 across all predictions and an F1 measure of 0.97 when limiting to classifications with probabilities >0.85. Furthermore, assessing performance on novel repeats yielded an F1 measure of 0.96. Although the performance of cas-based identification will exceed that of a repeat-based approach in many cases, CRISPRclassify provides an efficient approach to classification of CRISPR loci for cases in which cas gene information is unavailable, such as metagenomes and fragmented genome assemblies.


Conflict of interest statement

The authors declare no potential conflict of interest.

Figures

FIG. 1.
FIG. 1.
Area under the curve (AUC) performance by k-mer size. Model performance varied based on the k-mer length selected during training. A length of 5 provided optimal performance, with a mean AUC of 0.993. K-mer lengths of 4 and 6 also performed well, both with mean AUCs of 0.988. AUC performance with a k-mer length of 2 had the lowest performance of 0.966.
FIG. 2.
FIG. 2.
Prediction matrix of one-vs-all (OVA) XGBoost results on validation set. Application of the 0.85 probability threshold leaves only 14 total repeats incorrectly classified. The bottom-right quadrant of the graph displays the few examples from subtypes III-A, III-B, and III-D that were misclassified in the validation set.
FIG. 3.
FIG. 3.
K-mer feature gain by subtype. Subtypes that demonstrated the highest-gain k-mer features were I-C (“GCGAC”), I-E (“TCCCC”), I-F (“CTGCC”), I-G (“CAATG”), II-A (“AAAAC”), and III-A (“CCGTC”). High-gain k-mers are distinct to individual subtypes. Only subtypes with >50 validation examples are listed for clarity.
FIG. 4.
FIG. 4.
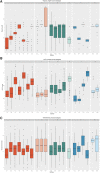
Distribution of biological features by subtype. Box plots of repeat length (A), GC content (B), and palindromicity index (C) are shown for repeats in the training set. Repeat length, GC content, and palindromicity index display the widest variability across type I and type V repeats, while the median of these features is more conserved within type II and type III repeats.
FIG. 5.
FIG. 5.
Overview of the web interface of CRISPRclassify. Locus counts are displayed by subtype, and distinct repeats are listed by locus, along with predicted subtype and corresponding probability. High-gain k-mers are highlighted in the repeat sequence either in blue, indicating forward orientation, or in yellow, indicating the reverse complement. The strain with the closest matching repeat from the training data set is calculated and listed as “Closest Strain,” along with the corresponding number of single nucleotide polymorphisms between the repeats (Edit Dist).
FIG. 6.
FIG. 6.
Overview of CRISPRclassify results on an unseen test set. The number of high confidence loci (p > 0.85) grouped by subtype shows types I and II comprise a majority of the test data, while types III, V, and VI have more limited representation. A total of 28,438 CRISPR loci were detected in the test set.
FIG. 7.
FIG. 7.
Benchmarking result counts for the test set. Cas-based locus classification results (Actual) are plotted against CRISPRclassify predictions (Predicted). Subtypes with the most misclassified loci were I-B (61 false-negatives), V-U4 (40 false-negatives), II-C (24 false-negatives), and VI-A (23 false-negatives). The overall F1 score for the high confidence predictions (p > 0.85) of the test set is 0.97.

References

    1. Barrangou R, Fremaux C, Deveau H, et al. . CRISPR provides acquired resistance against viruses in prokaryotes. Science 2007;315:1709–1712. DOI: 10.1126/science.1138140 - DOI - PubMed
    1. Sorek R, Kunin V, Hugenholtz P. CRISPR—a widespread system that provides acquired resistance against phages in bacteria and archaea. Nat Rev Microbiol 2008;6:181–186. DOI: 10.1038/nrmicro1793 - DOI - PubMed
    1. Marraffini LA, Sontheimer EJ. CRISPR interference: RNA-directed adaptive immunity in bacteria and archaea. Nat Rev Genet 2010;11:181–190. DOI: 10.1038/nrg2749 - DOI - PMC - PubMed
    1. Horvath P, Barrangou R. CRISPR/Cas, the immune system of bacteria and archaea. Science 2010;327:167–170. DOI: 10.1126/science.1179555 - DOI - PubMed
    1. Jansen R, Embden JD, Gaastra W, et al. . Identification of genes that are associated with DNA repeats in prokaryotes. Mol Microbiol 2002;43:1565–1575. DOI: 10.1046/j.1365-2958.2002.02839.x - DOI - PubMed

Publication types

LinkOut - more resources