. 2021 Aug 18;44(8):105.
doi: 10.1140/epje/s10189-021-00097-8.

Modeling spatiotemporally varying protein-protein interactions in CyLaKS, the Cytoskeleton Lattice-based Kinetic Simulator

Affiliations

Modeling spatiotemporally varying protein-protein interactions in CyLaKS, the Cytoskeleton Lattice-based Kinetic Simulator

Shane A Fiorenza et al. Eur Phys J E Soft Matter. .

Abstract

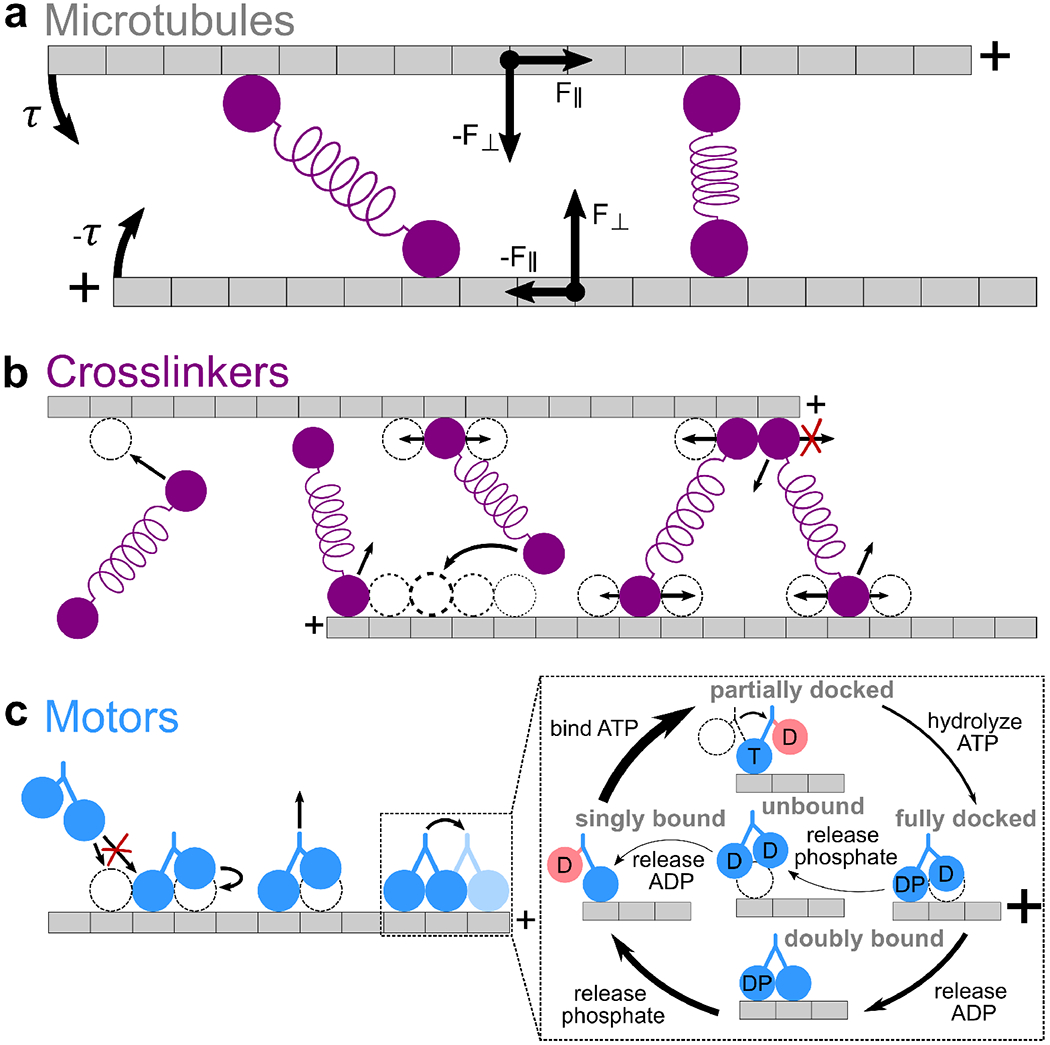
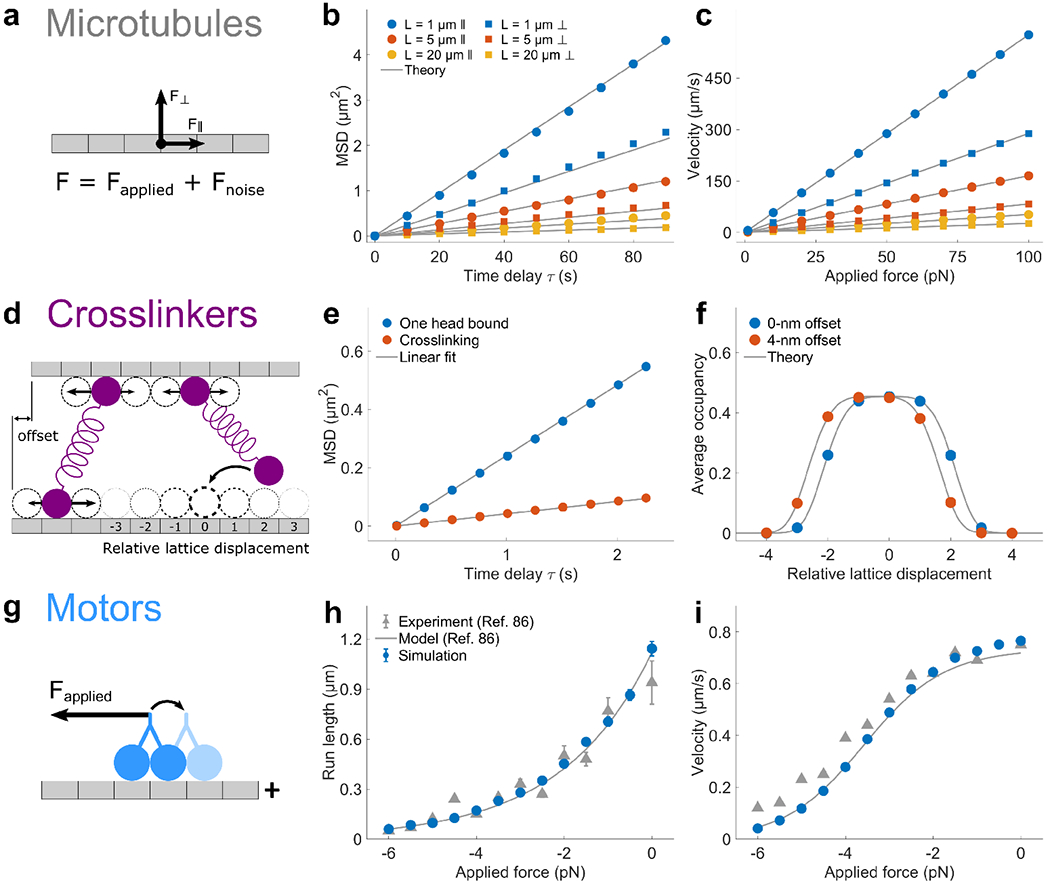
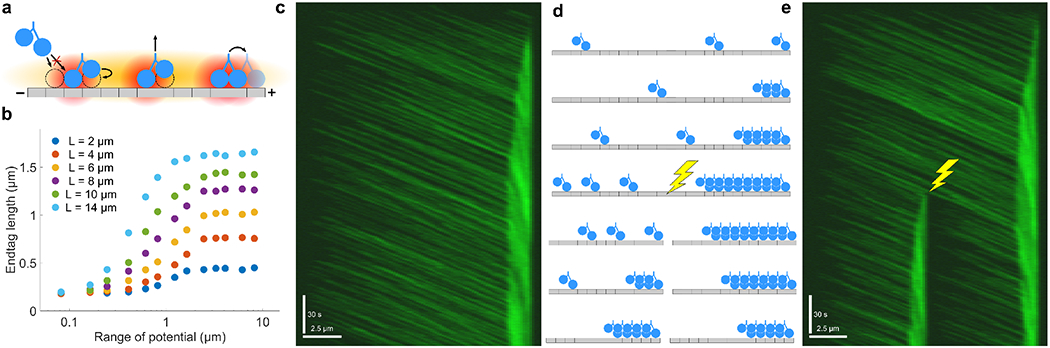
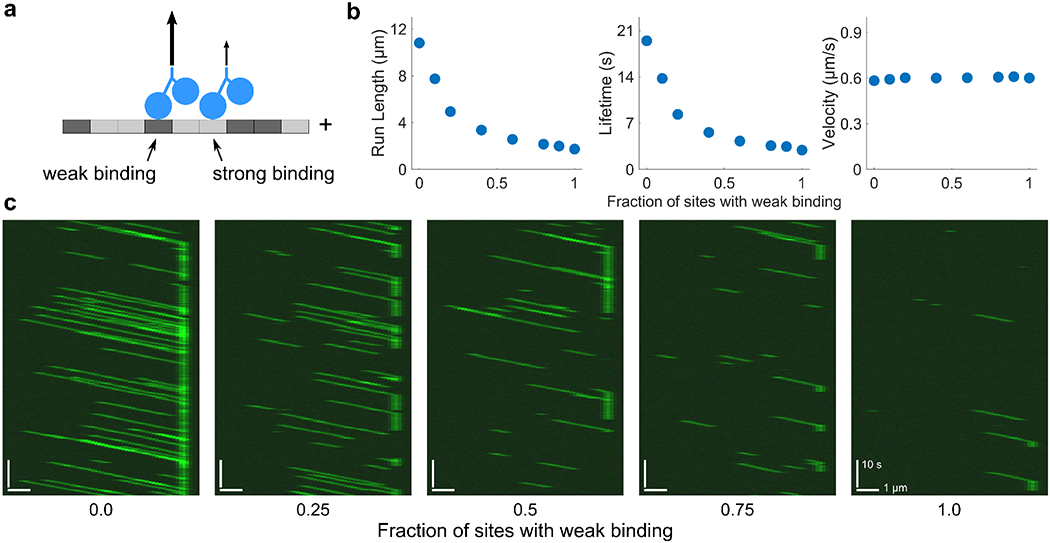
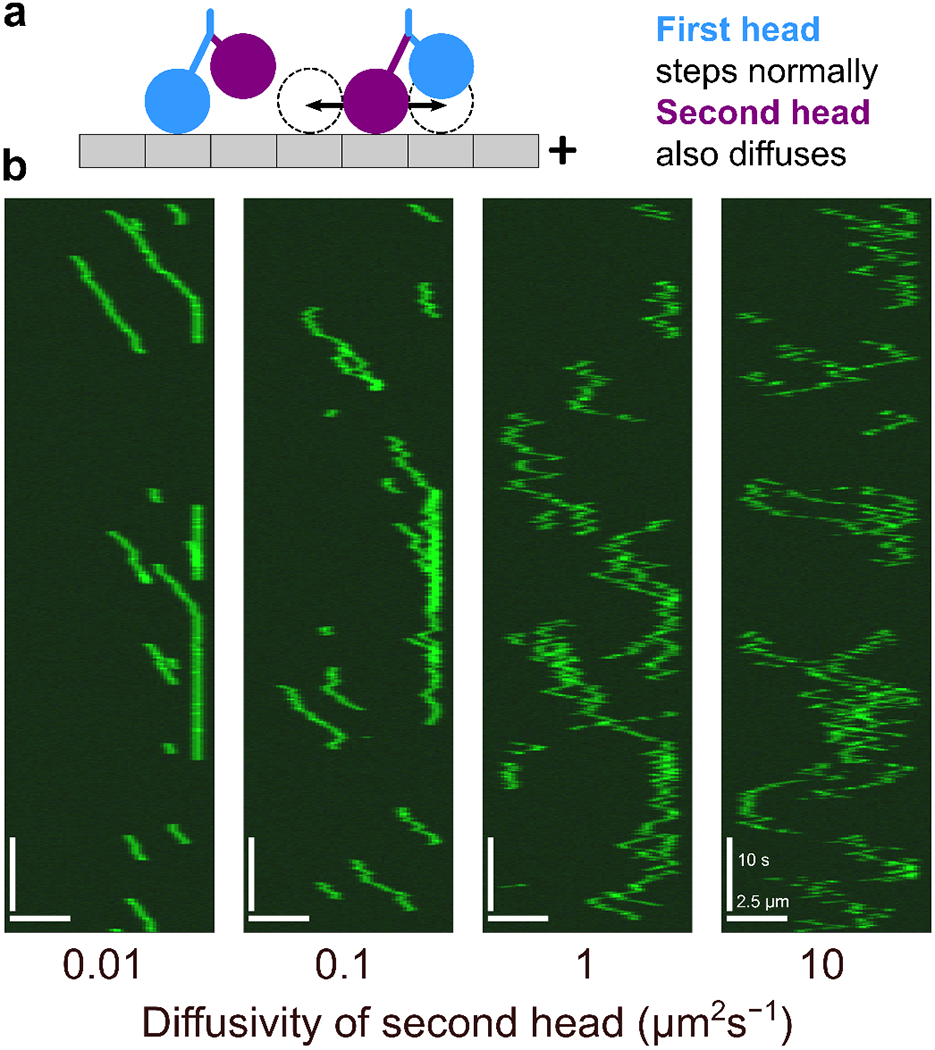
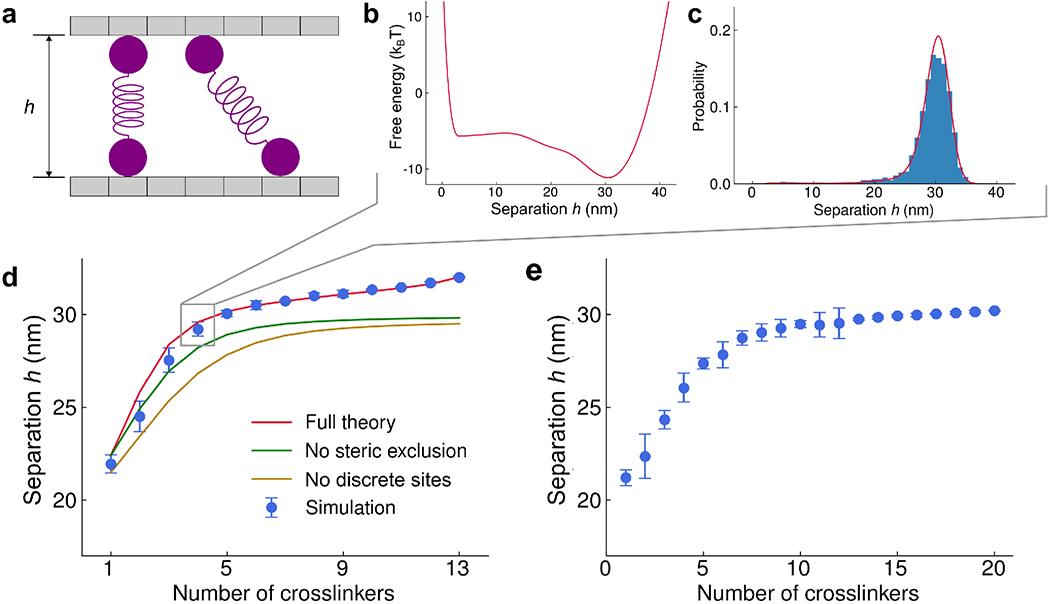
Interaction of cytoskeletal filaments, motor proteins, and crosslinking proteins drives important cellular processes such as cell division and cell movement. Cytoskeletal networks also exhibit nonequilibrium self-assembly in reconstituted systems. An emerging problem in cytoskeletal modeling and simulation is spatiotemporal alteration of the dynamics of filaments, motors, and associated proteins. This can occur due to motor crowding, obstacles along the filament, motor interactions and direction switching, and changes, defects, or heterogeneity in the filament binding lattice. How such spatiotemporally varying cytoskeletal filaments and motor interactions affect their collective properties is not fully understood. We developed the Cytoskeleton Lattice-based Kinetic Simulator (CyLaKS) to investigate such problems. The simulation model builds on previous work by incorporating motor mechanochemistry into a simulation with many interacting motors and/or associated proteins on a discretized lattice. CyLaKS also includes detailed balance in binding kinetics, movement, and lattice heterogeneity. The simulation framework is flexible and extensible for future modeling work and is available on GitHub for others to freely use or build upon. Here we illustrate the use of CyLaKS to study long-range motor interactions, microtubule lattice heterogeneity, motion of a heterodimeric motor, and how changing crosslinker number affects filament separation.


Figures

FIG. 1.
FIG. 1.
CyLaKS model ingredients A. Microtubules. Microtubules are modeled as single protofilaments, where each tubulin dimer corresponds to a discrete site on a 1-D lattice. Each microtubule has a plus-and minus-end. Associated proteins exert force and torque on filaments, causing 2-D translaton and rotation about each filament’s center of mass. B. Crosslinkers. Each crosslinker head can independently bind to, unbind from, and diffuse on the filament lattice. The relative probability of the second head binding to each sites is represented by dotted circles of different thickness. The relative probability of heads diffusing is represented by arrow length. Steric exclusion prevents more than one crosslinker head from occupying the same binding site. Crosslinker heads cannot diffuse off filament ends. C. Motor proteins. Motors can bind to, unbind from, and step toward the plus-ends of filaments. Inset, mechanochemical cycle. Motor heads can be bound to ADP (D), ATP (T), ADP·Pi (DP), or nothing (empty). Red coloring labels head which cannot bind to the microtubule due to necklinker tension. Arrow thickness represents the relative probability of each transition. Steric exclusion prevents more than one motor head from occupying the same binding site.
FIG. 2.
FIG. 2.
Simulation validation. (A-C), Microtubules. A. Schematic of 2D microtubule movement. B. Plot of mean-squared-displacement (MSD) of microtubule center of mass as a function of time delay τ for varying microtubule length, for movement parallel (circles) and perpendicular (squares) to the filament long axis. Theory is the prediction from 1D diffusion. Data were averaged from six independent simulations; error bars show standard error of the mean and are smaller than the points. C. Plot of velocity of microtubule center of mass as a function of applied force for varying microtubule length, for movement parallel (circles) and perpendicular (squares) to the filament long axis. Theory is the prediction from constant-force motion. Data were averaged from six independent simulations; error bars correspond to standard error of the mean and smaller than the points. (D-F), Crosslinkers. D. Schematic. Two microtubules are fixed with a vertical separation of 32 nm, the length of the crosslinkers. The top microtubule is horizontally displaced by the offset distance, where an offset of 0 nm means the lattices of each microtubule are aligned. E. Plot of crosslinker mean-squared-displacement (MSD) versus time delay τ. The diffusion coefficient is determined from a linear fit (0.121μm2s1 for one head bound; 0.0213 μm2s1 for crosslinking). F. Plot of average second head occupancy versus relative lattice displacement for two different values of the microtubule offset. Theory is the prediction from statistical mechanics (see text). (G-I) Motors. G. Schematic. Motors move under a constant hindering force. Plots of run length (H) and velocity (I) versus applied force. Experimental data and model from previous work [86]. These runs used the kinesin-1 parameter set of Table I.
FIG. 3.
FIG. 3.
Kif4A end-tag formation due to long-range motor interactions A. Schematic of the motor interaction model. Motors interact by short-and long-range cooperativity, and the long-range interaction affects both binding and stepping. B. Plot of end-tag length versus potential range for varying microtubule length. C. Simulated kymograph of end-tag formation. 67% of simulated motors are fluorescently labeled. Scale bars are 2.5 μm and 30 seconds. D. Schematic of the microtubule ablation simulation. After an end-tag forms, the microtubule is split in half. A new end-tag forms on the new microtubule, while the old end-tag shrinks. E. Simulated kymograph of microtubule ablation simulation. 67% of simulated motors are fluorescently labeled. Scale bars are 2.5 μm and 30 seconds.
FIG. 4.
FIG. 4.
Effects of modeling heterogeneous tubulin with a mix of strong-and weak-binding sites. (a) Model schematic. A fraction of tubulin sites (dark grey) are weakly binding. (b) Plots of motor run length, lifetime, and velocity as a function of the fraction of sites with weak binding. Here, ζi=3 and c = 50 pM. Motor processivity has been increased by an order of magnitude from the reference parameter set. Data points are the average of five independent runs. Error bars correspond to the standard error of the mean and are typically smaller than the points. (c) Simulated kymographs with varying fraction of weak-binding tubulin with all motors fluorescently labeled. Here c = 150 pM.
FIG. 5.
FIG. 5.
Kinesin heterodimer simulations. (a) Model schematic. Kinesin heterodimers are constructed of one normal head (blue) and one mutant head (purple) which diffuses while singly bound. (b) Simulated kymographs of kinesin heterodimer for D = 0.01, 0.1, 1, and 10 μm2 s−1. All simulated molecules are fluorescently labeled.
FIG. 6.
FIG. 6.
Change in microtubule separation with varying crosslinker number. (a) Schematic of the model. The microtubule separation h varies due to forces from crosslinkers. (b) Plot of free energy as a function of microtubule separation for 13-site microtubules with 4 32-nm-long crosslinkers, from semi-analytic theory. (c) Probability as a function of microtubule separation for 13-site microtubules with 4 32-nm-long crosslinkers from semi-analytic theory (red) and simulation (blue). (d) Average microtubule separation as a function of number of crosslinkers for 13-site microtubules, comparing full semi-analytic theory (red), simulation (blue), and theory neglecting steric exclusion (green) and both steric exclusion and discrete lattice sites (gold). (d) Average microtubule separation as a function of number of crosslinkers for 100-site microtubules.
FIG. 6.
FIG. 6.
Change in microtubule separation with varying crosslinker number. (a) Schematic of the model. The microtubule separation h varies due to forces from crosslinkers. (b) Plot of free energy as a function of microtubule separation for 13-site microtubules with 4 32-nm-long crosslinkers, from semi-analytic theory. (c) Probability as a function of microtubule separation for 13-site microtubules with 4 32-nm-long crosslinkers from semi-analytic theory (red) and simulation (blue). (d) Average microtubule separation as a function of number of crosslinkers for 13-site microtubules, comparing full semi-analytic theory (red), simulation (blue), and theory neglecting steric exclusion (green) and both steric exclusion and discrete lattice sites (gold). (d) Average microtubule separation as a function of number of crosslinkers for 100-site microtubules.

References

    1. Howard Jonathon. Mechanics of Motor Proteins and the Cytoskeleton. Sinauer Associates, Publishers, Sunderland, Mass, 2001.
    1. McIntosh J. Richard, Molodtsov Maxim I., and Ataullakhanov Fazly I.. Biophysics of mitosis. Quarterly Reviews of Biophysics, 45(02):147–207, 2012. - PMC - PubMed
    1. Pollard Thomas D. and Cooper John A.. Actin, a Central Player in Cell Shape and Movement. Science, 326(5957):1208–1212, November 2009. - PMC - PubMed
    1. Bray Dennis. Cell Movements: From Molecules to Motility. Garland Science, 2001.
    1. Blanchoin Laurent, Boujemaa-Paterski Rajaa, Sykes Cécile, and Plastino Julie. Actin Dynamics, Architecture, and Mechanics in Cell Motility. Physiological Reviews, 94(1):235–263, January 2014. - PubMed

Substances