Review
. 2022 Apr 27;122(8):7386-7414.
doi: 10.1021/acs.chemrev.1c00217. Epub 2021 Aug 18.

Characterizing Endogenous Protein Complexes with Biological Mass Spectrometry

Affiliations
Review

Characterizing Endogenous Protein Complexes with Biological Mass Spectrometry

Rivkah Rogawski et al. Chem Rev. .

Abstract

Biological mass spectrometry (MS) encompasses a range of methods for characterizing proteins and other biomolecules. MS is uniquely powerful for the structural analysis of endogenous protein complexes, which are often heterogeneous, poorly abundant, and refractive to characterization by other methods. Here, we focus on how biological MS can contribute to the study of endogenous protein complexes, which we define as complexes expressed in the physiological host and purified intact, as opposed to reconstituted complexes assembled from heterologously expressed components. Biological MS can yield information on complex stoichiometry, heterogeneity, topology, stability, activity, modes of regulation, and even structural dynamics. We begin with a review of methods for isolating endogenous complexes. We then describe the various biological MS approaches, focusing on the type of information that each method yields. We end with future directions and challenges for these MS-based methods.


Conflict of interest statement

The authors declare no competing financial interest.

Figures

Figure 1
Figure 1
Biological MS yields a wide range of information about biological complexes. Depending on the specifics of sample preparation and the MS method chosen, biological MS can shed light on many properties of endogenous complexes. This includes determining binding of cofactors and lipids and their effects on complex composition, identification of new subunits, heterogeneity of complexes, post-translational modifications, and transient interactions or interactions that are only present under a distinct physiological condition. Structures and topologies, as well as structural dynamics, can also be revealed.
Figure 2
Figure 2
Overview of various biological MS techniques. Each biological MS method requires different amounts of protein (row 1: refs (, , and 251) corroborate amounts for proteomic, in situ cross-linking, and HDX, respectively). For each method, the proteins must be treated in a different way (second row). While all include gas phase ion generation and MS analysis, the experimental setup differs slightly between samples, with bottom-up proteomic methods sequencing and quantifying peptides via LC/MS-MS and top-down and native MS measuring the mass of the whole protein and using tandem MS for protein fragmentation and dissociation of covalent and noncovalent interactions, respectively (third row). Each method yields different information, as detailed in section 3 and described in the last row.
Figure 3
Figure 3
Strategies for protein complex isolation for biological MS. Purification of endogenous complexes can start either from unmodified cells and tissues, in which immunoprecipitation and biochemical purification can be applied, or by genetic manipulation of cells to express an epitope tagged protein, preferably at the endogenous locus (see section 2.4.1). At the end of the purification, complexes can either be eluted in a denatured state, in which case bottom-up proteomics or intact protein MS can be applied, or eluted in a native state, which will enable application of native-MS, HDX, or cross-linking MS.
Figure 4
Figure 4
Identifying complex modularity via bottom-up proteomics vs native MS. (A) In bottom-up proteomics experiments, complexes are revealed by identifying copurified proteins. Here, three different tagged proteins were used as “bait” (top row), namely NCPB1, NCBP2, and NCBP3, which are different nuclear cap binding proteins that bind to nascent RNA. The data can be visualized as a heatmap of control-subtracted label free quantification (LFQ) intensity for each “prey” protein identified by MS. This data demonstrates that NCPB3 differs from NCBP1 and NCBP2 in selectivity, coprecipitating with members of the THO/TREX complexes. These interactions were later confirmed as supporting a biological role for NCBP3 in mRNA expression that differs from NCBP1 and NCBP2. (A) Figure reproduced and adapted with permission from ref (353). Copyright 2020 Oxford University Press. (B) Shown is a native mass spectrum of multiple coexisting complexes purified from chicken muscle. While the main charge series corresponds to monomeric vinculin, additional charge states corresponding to three protein complexes are also seen. The masses of these complexes indicate the presence of intact Arp2/3, a vinculin-associated Arp2/3 complex, and a vinculin-α actinin-associated Arp2/3 complex. (C) Tandem-MS is used to validate the complex composition; shown is the MS/MS spectrum of the charge state selected in purple, with circles denoting released subunits and squares corresponding to the remaining stripped complex. Tandem MS reveals that Arp2 is released from a complex composed of vinculin, α-actinin, and the Arp2/3 complex. (B,C) Reproduced and adapted with permissions from ref (18). Copyright 2014 Springer Nature.
Figure 5
Figure 5
Native-MS and cross-linking MS can identify complex topology. (A) Cross-linking MS identifies the architecture of complexes via cross-links detected between subunits. Here, cross-links were generated in situ for the Mycoplasma pneumoniae expressome, a supercomplex composed of RNA polymerase and the ribosome linked via NusA. Cross-links oriented the C-terminal domain of NusA to RNA polymerase and the N-terminal domain to the mRNA entry site of the ribosome. A hybrid structure was later constructed that combined data from cryoEM and cross-linking MS. Reproduced and adapted with permission from ref (239). Copyright 2020 The American Association for the Advancement of Science. (B) Endogenous affinity-isolated GINS complex, a 131 kDa heterotetramer (box), was subjected to HCD activation, causing it to dissociate into subcomplexes, which appear at lower and higher m/z. By identifying the subcomplexes generated, a subunit connectivity map could be generated which was consistent with the known structures of homologous human GINS complexes. Reproduced and adapted with permission from ref (312). Copyright 2016 American Chemical Society.
Figure 6
Figure 6
MS illuminates structural dynamics of endogenous complexes. (A,B) Cross-linking MS reveals conformational dynamics of HSP90 in vivo. HeLa cells were cross-linked, and cross-linked peptides corresponding to HSP90 were quantified with and without 17-AAG treatment. (A) Two different conformations of HSP90, with identified cross-links between the N-terminal domain (NTD) and middle domain (MD) shown in red dashed lines. (B) Plot comparing Euclidean Cα–Cα distances calculated for different HS90B experimental cross-links mapped onto the two structures: quadrant 1 is consistent with both models and quadrant 2 with compact model only. The color of the cross-links represents the log2 of the ratio between the two treatment conditions. This data demonstrates that the compact conformation increases in abundance after 17-AAG treatment. Reproduced with permission from ref (243). Copyright 2016 Cell Chemical Biology. (C) HDX-MS shows differences in structural dynamics between the standard 20S proteasome and the immunoproteasome. Shown is the difference in relative deuterium uptake for specific regions of the α and β rings of the immune-20S proteasome vs the standard 20S proteasome, demonstrating that some regions are more dynamic in the immunoproteasome (red) and some are more dynamic in the standard 20S proteasome (blue). The authors explained these differences as relating to differences in activity between these two proteoforms of the 20S proteasome. Reproduced with permission from ref (256). Copyright 2020 Springer Nature.
Figure 7
Figure 7
Top-down native MS identifies the proteoform composition of endogenous complexes. (A) Mass spectra of the intact intact fructose-1,6-bisphosphatase 1 (FBP1) homotetramer, purified endogenously from yeast grown under different conditions (carbon starved, glucose and heat shock). The inset shows the full charge series, and each panel displays the 21+ charge state for each growth condition. Spectral deconvolution (B) reveals that glucose leads to a uniformly tetra-phosphorylated, while heat shock leads to a mixture of tetramers with different numbers of phosphorylations. MS/MS analysis (not shown) revealed that each subunit is monophosphorylated in the tetramer, while MS/MS/MS fragmentation analysis localized the modifications to the 12Ser/13Thr site. Magnesium ions, known binders of FBP1, were also observed bound to the complex. Each FBP1 subunit is graphically depicted as a cyan circle. Mg2+ ions are indicated as small orange circles, and phosphorylation is labeled as “P” Reproduced and adapted with permission from ref (292). Copyright 2017 American Chemical Society.
Figure 8
Figure 8
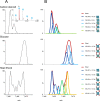
Native-MS spectra show lipid binding to endogenous membrane proteins. (A) Full spectrum of protein complexes observed from the E. coli outer membrane. The inset depicts observed complexes of an outer membrane vesicle. (B) Expansion of the mass spectrum assigned to the Bam complex (boxed region in (A)), with monomeric BamE binding to one, two, and three cardiolipins (gray, green, and yellow, respectively). Native-MS thus uncovers the range of lipid bound complexes present in the sample. Reproduced with permission from ref (316). Copyright 2018 The American Association for the Advancement of Science.

References

    1. Alberts B. The Cell as a Collection of Protein Machines: Preparing the Next Generation of Molecular Biologists. Cell 1998, 92, 291–294. 10.1016/S0092-8674(00)80922-8. - DOI - PubMed
    1. Giurgiu M.; Reinhard J.; Brauner B.; Dunger-Kaltenbach I.; Fobo G.; Frishman G.; Montrone C.; Ruepp A. CORUM: The Comprehensive Resource of Mammalian Protein Complexes - 2019. Nucleic Acids Res. 2019, 47, D559–D563. 10.1093/nar/gky973. - DOI - PMC - PubMed
    1. Stumpf M. P. H.; Thorne T.; De Silva E.; Stewart R.; An H. J.; Lappe M.; Wiuf C. Estimating the Size of the Human Interactome. Proc. Natl. Acad. Sci. U. S. A. 2008, 105, 6959–6964. 10.1073/pnas.0708078105. - DOI - PMC - PubMed
    1. Chen Z. A.; Rappsilber J. Quantitative Cross-Linking/Mass Spectrometry to Elucidate Structural Changes in Proteins and Their Complexes. Nat. Protoc. 2019, 14, 171–201. 10.1038/s41596-018-0089-3. - DOI - PubMed
    1. Benesch J. L. P.; Ruotolo B. T.; Simmons D. A.; Robinson C. V. Protein Complexes in the Gas Phase: Technology for Structural Genomics and Proteomics. Chem. Rev. 2007, 107, 3544–3567. 10.1021/cr068289b. - DOI - PubMed

Publication types

MeSH terms