. 2021 Oct 14;87(21):e0136621.
doi: 10.1128/AEM.01366-21. Epub 2021 Aug 18.

High Salinity Inhibits Soil Bacterial Community Mediating Nitrogen Cycling

Affiliations

High Salinity Inhibits Soil Bacterial Community Mediating Nitrogen Cycling

Xiang Li et al. Appl Environ Microbiol. .

Abstract

Salinization is considered a major threat to soil fertility and agricultural productivity throughout the world. Soil microbes play a crucial role in maintaining ecosystem stability and function (e.g., nitrogen cycling). However, the response of bacterial community composition and community-level function to soil salinity remains uncertain. Here, we used multiple statistical analyses to assess the effect of high salinity on bacterial community composition and potential metabolism function in the agricultural ecosystem. Results showed that high salinity significantly altered both bacterial alpha (Shannon-Wiener index and phylogenetic diversity) and beta diversity. Salinity, total nitrogen (TN), and soil organic matter (SOM) were the vital environmental factors shaping bacterial community composition. The relative abundance of Actinobacteria, Chloroflexi, Acidobacteria, and Planctomycetes decreased with salinity, whereas Proteobacteria and Bacteroidetes increased with salinity. The modularity and the ratio of negative to positive links remarkedly decreased, indicating that high salinity destabilized bacterial networks. Variable selection, which belongs to deterministic processes, mediated bacterial community assembly within the saline soils. Function prediction results showed that the key nitrogen metabolism (e.g., ammonification, nitrogen fixation, nitrification, and denitrification processes) was inhibited in high salinity habitats. MiSeq sequencing of 16S rRNA genes revealed that the abundance and composition of the nitrifying community were influenced by high salinity. The consistency of function prediction and experimental verification demonstrated that high salinity inhibited soil bacterial community mediating nitrogen cycling. Our study provides strong evidence for a salinity effect on the bacterial community composition and key metabolism function, which could help us understand how soil microbes respond to ongoing environment perturbation. IMPORTANCE Revealing the response of the soil bacterial community to external environmental disturbances is an important but poorly understood topic in microbial ecology. In this study, we evaluated the effect of high salinity on the bacterial community composition and key biogeochemical processes in salinized agricultural soils (0.22 to 19.98 dS m-1). Our results showed that high salinity significantly decreased bacterial diversity, altered bacterial community composition, and destabilized the bacterial network. Moreover, variable selection (61% to 66%) mediated bacterial community assembly within the saline soils. Functional prediction combined with microbiological verification proved that high salinity inhibited soil bacterial community mediating nitrogen turnover. Understanding the impact of salinity on soil bacterial community is of great significance for managing saline soils and maintaining a healthy ecosystem.

Keywords: bacterial community; community assembly; functional prediction; network stability; nitrogen cycling; soil salinization.


Figures
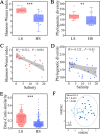
FIG 1
FIG 1
Bacterial community alpha/beta diversity in low salinity (LS) and high salinity (HS) soils. The Shannon-Wiener index (A) and phylogenetic diversity (B) in LS and HS soils. The relationship between soil salinity and Shannon-Wiener index (C) and phylogenetic diversity (D). (E) Bacterial community similarity (Bray-Curtis distance) in LS and HS soils. (F) Nonmetric multidimensional scaling (NMDS) ordination showing the variation of soil bacterial communities across two salinity levels. Black asterisks indicate that the alpha/beta diversity index was significantly higher in LS soils (*, P < 0.05; **, P < 0.01; ***, P < 0.001).
FIG 2
FIG 2
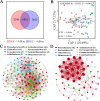
Bacterial community structure and co-occurrence network in LS and HS soils. (A) Venn diagrams of operational taxonomic unit (OTU) richness in two treatments. (B) Constrained analysis of principal coordinates (CAPSCALE) derived from Bray-Curtis dissimilarities of the community composition of sampling points based on 16S rRNA gene amplicon sequencing. Network of co-occurring bacterial genera based on Spearman correlation analysis sorted in color by phylum. A connection stands for a strong (Spearman’s r > 0.6) and significant (P < 0.01) correlation. The size of each node is proportional to the degree of the OTUs. (C) Network in soils with an EC of <4 dS m−1. (D) Network in soils with an EC of >4 dS m−1.
FIG 3
FIG 3
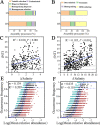
The bacterial community assembly processes in saline soils. (A and B) The percentage of turnover in soil bacterial community assembly. Deterministic processes, homogeneous + variable selection; stochastic processes, dispersal limitation + homogenizing dispersal + undominated processes; homogenizing, homogeneous selection + homogenizing dispersal; differentiating, variable selection + dispersal limitation. (C and D) Relationships between β-nearest taxon index (βNTI) and differences in soil salinity. (E and F) Fit of Sloan’s neutral model for analysis of microbial community assembly. The solid blue lines indicate the best fit to the neutral model, and the dashed blue lines represent 95% confidence intervals around the model prediction. OTUs that occur more or less frequently than predicted by the neutral community model are shown in different colors. R2 indicates the fit to this model, while the m value indicates community immigration rate.
FIG 4
FIG 4
Function differences predicted by PICRUSt2 according to the 16S rRNA gene sequencing data in LS and HS soils. (A) Function differences associated with multinutrient metabolism in LS and HS soils at KEGG level 2. (B) Function differences associated with nitrogen metabolism in LS and HS soils at KEGG level 3. Black asterisks indicate that the relative abundance was significantly higher in LS soils (*, P < 0.05; **, P < 0.01; ***, P < 0.001).
FIG 5
FIG 5
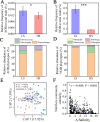
The abundance and composition of nitrifying community in LS and HS soils. Proportional changes of nitrifying populations of AOB (A) and NOB (B) based on differences in 16S rRNA genes as identified by high-throughput sequencing of total microbial communities. Proportional changes of nitrifying phylotypes of AOB (C) and NOB (D) in LS and HS soils. (E) Constrained analysis of principal coordinates (CAPSCALE) derived from Bray-Curtis dissimilarities of the nitrifying community composition. (F) The relationship between salinity differences and nitrifiers community similarity (Bray-Curtis distance).
FIG 6
FIG 6
Salinity effects on functional genes involved in nitrogen cycling. (A to J) The absolute abundance of key nitrogen cycling function genes in LS and HS soils (qPCR data). The nxrA and nxrB indicated Nitrobacter nxrA and Nitrospira nxrB genes, respectively. (K and L) Potential ammonia oxidation activity and nitrite oxidation activity in LS and HS soils. (M) The percentage changes in the normalized relative abundance associated with nitrogen cycling genes compared with low salinity soils (function prediction data at KEGG level 3). The percentage change value in blue means the decrease by comparison between LS and HS soils. The N in nirK-N, norB-N, and nosZ-N indicated denitrification function genes carried by nitrifying microorganisms (nitrifier denitrification). Black asterisks indicate that the relative abundance was significantly higher in LS soils (*, P < 0.05; **, P < 0.01; ***, P < 0.001).

References

    1. Szabolcs I. 1989. Salt-affected soils. CRC Press, Inc. Boca Raton, FL.
    1. Paul D. 2013. Osmotic stress adaptations in rhizobacteria. J Basic Microbiol 53:101–110. 10.1002/jobm.201100288. - DOI - PubMed
    1. Setia R, Rengasamy P, Marschner P. 2013. Effect of exchangeable cation concentration on sorption and desorption of dissolved organic carbon in saline soils. Sci Total Environ 465:226–232. 10.1016/j.scitotenv.2013.01.010. - DOI - PubMed
    1. Nagler K, Moeller R. 2015. Systematic investigation of germination responses of Bacillus subtilis spores in different high-salinity environments. FEMS Microbiol Ecol 91:fiv023. 10.1093/femsec/fiv023. - DOI - PubMed
    1. Richards LA. 1954. Diagnosis and improvement of saline and alkali soils. United States Department of Agriculture, Washington, DC.

Publication types

LinkOut - more resources