. 2021 Aug 17;36(7):109555.
doi: 10.1016/j.celrep.2021.109555.

Neuronal odor coding in the larval sensory cone of Anopheles coluzzii: Complex responses from a simple system

Affiliations

Neuronal odor coding in the larval sensory cone of Anopheles coluzzii: Complex responses from a simple system

Huahua Sun et al. Cell Rep. .

Abstract

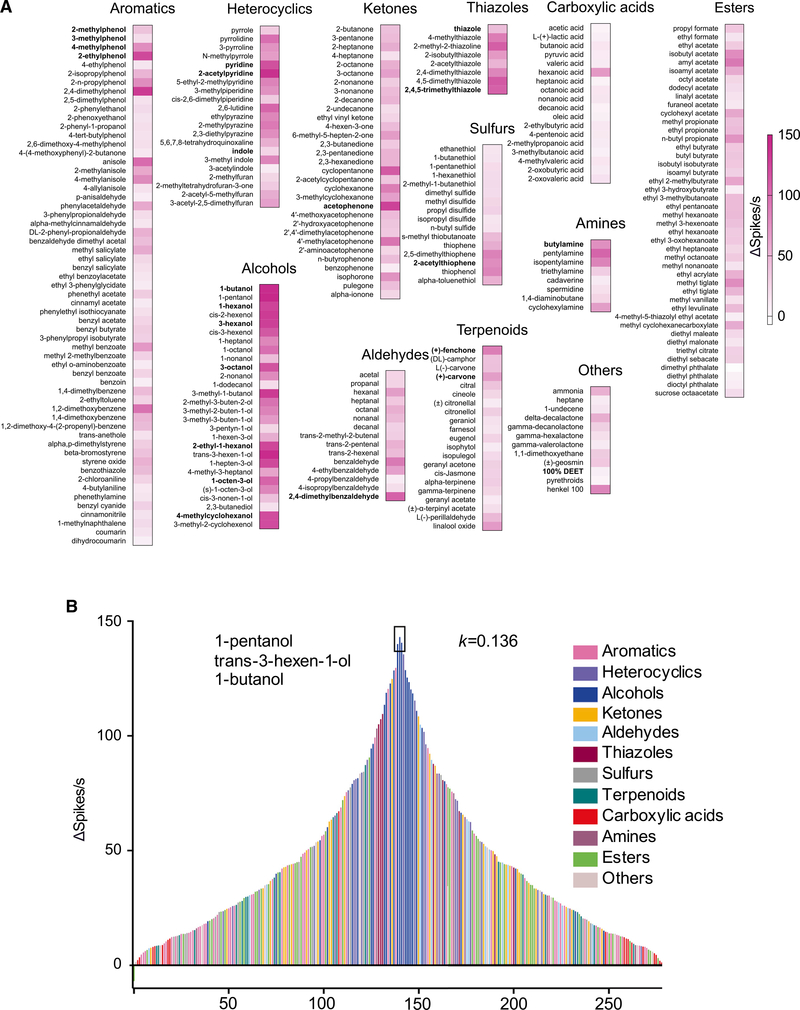
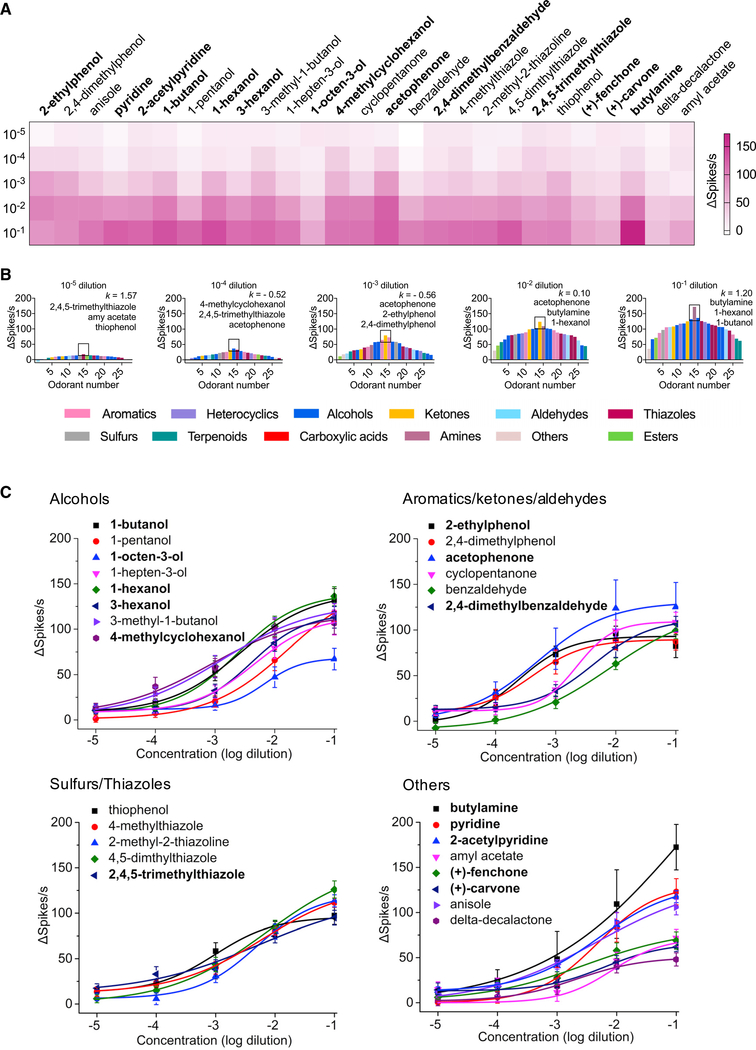
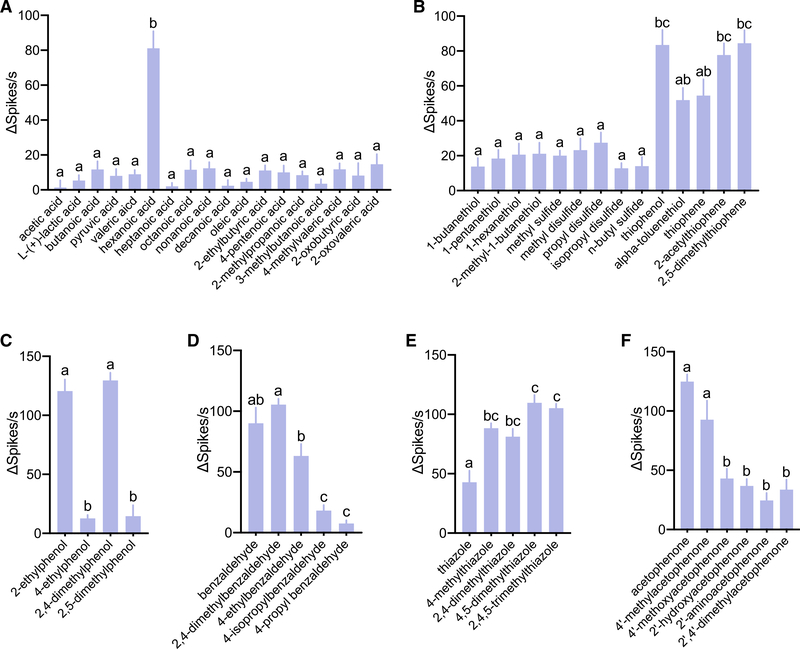
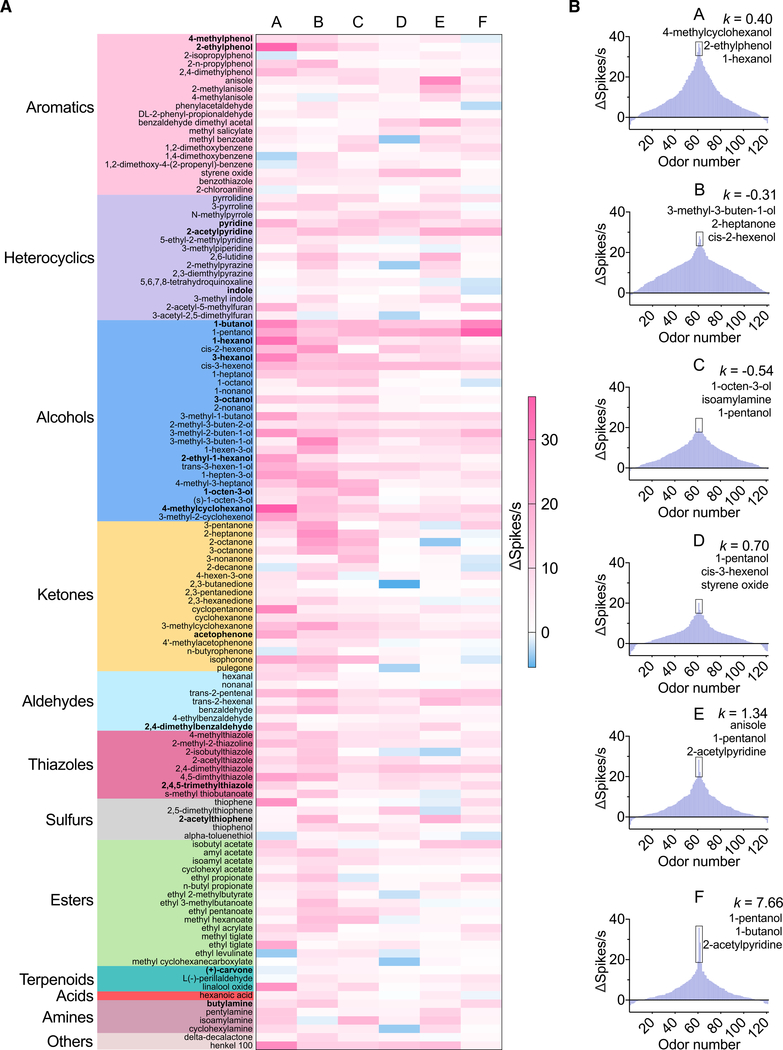
Anopheles mosquitoes are the sole vectors of malaria. Although adult females are directly responsible for disease transmission and accordingly have been extensively studied, the survival of pre-adult larval stages is vital. Mosquito larvae utilize a spectrum of chemosensory and other cues to navigate their aquatic habitats to avoid predators and search for food. Here we examine larval olfactory responses, in which the peripheral components are associated with the antennal sensory cone. Larval behavior and sensory cone responses to volatile stimuli in Anopheles coluzzii demonstrate the sensory cone is particularly tuned to alcohols, thiazoles, and heterocyclics, and these responses can be assigned to discrete groups of sensory cone neurons with distinctive profiles. These studies reveal that the anopheline larvae actively sample volatile odors above their aquatic habitats via a highly sophisticated olfactory system that is sensitive to a broad range of compounds with significant behavioral relevance.

Keywords: Anopheles coluzzii; antennal sensory cone; behavior; electrophysiology; larval olfactory system.


Conflict of interest statement

Declaration of interests The authors declare no competing interests.

Figures

Figure 1.
Figure 1.. Broad response profiles of the larval sensory cone in An. Coluzzii
(A) Response profile of the larval sensory cone to 281 odorants of diverse chemical groups (n = 6) at a 10−2 dilution. Odorants highlighted in bold evoke behavioral responses in An. coluzzii larvae (Table S1). (B) Tuning curve reveals the breadth of the larval sensory cone. The 281 odorants are distributed along the x axis according to the strengths of the responses they elicited from the sensory cone. The odors that elicited the strongest responses are near the center of the distribution; those that elicited the weakest responses are near the edges. Negative values indicate inhibitory responses. Each odorant is color coded based on its chemical class. The kurtosis (k) value, as a statistical measure of “peakedness,” is shown on the right side of the plot.
Figure 2.
Figure 2.. Odor-evoked dose-dependent responses of the larval sensory cone
(A) Dose-dependent response to a panel of 27 odorants displayed along heatmap quadrants. (B) Tuning curves of the larval sensory cone to odorant dilutions across five orders of magnitude. The 27 odorants are distributed along the x axis according to the strength of the responses they elicited from the sensory cone. Each odorant is color coded based on its chemical class. The odorants that elicited the strongest responses are near the center of the distribution; those that elicited the weakest responses are near the edges. The three odorants eliciting the highest firing frequency in the sensory cone are noted for each dilution. (C) Dose-response curves of the larval sensory cone to these 27 odorant stimuli; n = 6–10 for each odorant dilution. Error bars indicated SEM. Neuronal responses across 0.5-s intervals for all odorant stimuli were calculated by subtracting solvent-alone responses and corrected for background activity. (A and C) The odorants highlighted in bold evoked behavioral responses in An. coluzzii larvae (Table S1).
Figure 3.
Figure 3.. Responses of larval sensory cone to odorants with similar structures (n = 6)
(A–F) Responses of larval sensory cone to: (A) aliphatic carboxylic acids; (B) aliphatic and aromatic sulfurs; (C) ethylphenol-derived compounds; (D) benzaldehyde-derived compounds; (E) thiazole-derived compounds with increased alkane branches in the heterocyclic ring; and (F) acetophenone-derived compounds. Error bars indicate SEM. One-way ANOVA Tukey’s test was applied in the statistical analysis, with p < 0.05 indicating a significant difference. Different letters (a, b, c) indicate significant statistical differences (p < 0.05); those with the same letters are not statistically distinct.
Figure 4.
Figure 4.. Response profiles across neuron groups to 121 odorants in the sensory cone (n = 3–5)
Neuronal responses for all odorant stimuli at 10−2 dilution were calculated by subtracting solvent-alone responses and corrected for background activity. Thereafter, spike units were sorted using a custom-designed SSSort software algorithm (see STAR Methods). (A) Heatmap of response profile of six neuron groups (A–F) to 121 odorants; the odorants highlighted in bold evoked behavioral responses in An. coluzzii larvae (Table S1). Each odorant is color coded based on its chemical class. (B) Tuning curves of the sorted six neuron groups (A–F) in response to 121 odorants. The corresponding kurtosis (k) values were calculated for each neuron group. The top three odorants contributing to the peak response are listed.
Figure 5.
Figure 5.. Five major chemical classes constitute the odor space of the larval sensory cone
(A–E) Three-dimensional presentation of responses to (A) alcohols, (B) ketones, (C) aromatics, (D) heterocyclics, and (E) esters distributed across the odor space of the larval sensory cone. Each odorant is color coded based on its chemical class. Principal-component analysis (PCA) was conducted using IBM SPSS Statistics, and Euclidean distance between each chemical pair was calculated. (F) Mean Euclidean distance of each chemical class in the odor space. Error bars indicate SEM. One-way ANOVA (non-parametric Kruskal-Wallis test) was conducted to determine the significant differences among chemical classes. Different letters (a, b, c) indicate significant statistical differences (p < 0.05); those with the same letters are not statistically distinct.
Figure 6.
Figure 6.. Behavioral responses of anopheline larvae to volatiles
(A) Schematic of the behavioral assay. (B) Boxplot of preference index (n = 7–10) of mosquito larvae responses to larval food volatiles, as well as 24 unitary odorant volatiles and solvent-alone controls. Respective PI values for each compound were compared with that of solvent-alone sham assays and assessed for statistical significance using unpaired, two-tailed Student’s t tests with Welch’s correction. Error bars indicate SEM. Significant differences are defined as *p < 0.05 and **p < 0.01. Each odorant is color coded based on its chemical class, shown in Figure 1B.
Figure 7.
Figure 7.. Neuronal and behavioral responses to volatiles are Orco-mediated in mosquito larvae
(A) Representative raw spike recording of background electrophysiological activity in the larval antennal sensory cone of wild-type and orco−/− mosquitoes. (B) Representative spike recording of electrophysiological responses of larval antennal sensory cone to 2-methylphenol and acetophenone in wild-type and orco−/− mosquitoes. (C) Representative signal trace of electrophysiological responses of larval antennal sensory cone to the Orco agonist VUAA1 in wild-type mosquitoes. (D) Representative signal trace of electrophysiological responses of larval antennal sensory cone to the Orco agonist VUAA1 in orco−/− mosquitoes. (E) Comparison of behavioral responses of wild-type and orco−/− mosquito larvae to larval food and 12 odorants (n = 7–10). Error bars indicate SEM. Significant differences are defined as *p < 0.05 and **p < 0.01 in the unpaired t test with Welch’s correction. ns, no significant difference.

References

    1. Afify A, and Galizia CG (2014). Gravid females of the mosquito Aedes aegypti avoid oviposition on m-cresol in the presence of the deterrent isomer p-cresol. Parasit. Vectors 7, 315. - PMC - PubMed
    1. Ai M, Min S, Grosjean Y, Leblanc C, Bell R, Benton R, and Suh GS (2010). Acid sensing by the Drosophila olfactory system. Nature 468, 691–695. - PMC - PubMed
    1. Alves Z, Melo A, Figueiredo AR, Coimbra MA, Gomes AC, and Rocha SM (2015). Exploring the Saccharomyces cerevisiae volatile metabolome: Indigenous versus commercial strains. PLoS ONE 10, e0143641. - PMC - PubMed
    1. Amani H, Yaghoobi-Ershadi MR, and Kassiri H (2014). The ecology and larval habitats characteristics of anopheline mosquitoes (Diptera: Culicidae) in Aligudarz County (Luristan province, western Iran). Asian Pac. J. Trop. Biomed. 4 (Suppl 1), S233–S241. - PMC - PubMed
    1. Audrain B, Farag MA, Ryu CM, and Ghigo JM (2015). Role of bacterial volatile compounds in bacterial biology. FEMS Microbiol. Rev. 39, 222–233. - PubMed

Publication types

Substances

LinkOut - more resources