. 2021 Aug 17;36(7):109553.
doi: 10.1016/j.celrep.2021.109553.

Coordination of tumor growth and host wasting by tumor-derived Upd3

Affiliations

Coordination of tumor growth and host wasting by tumor-derived Upd3

Guangming Ding et al. Cell Rep. .

Abstract

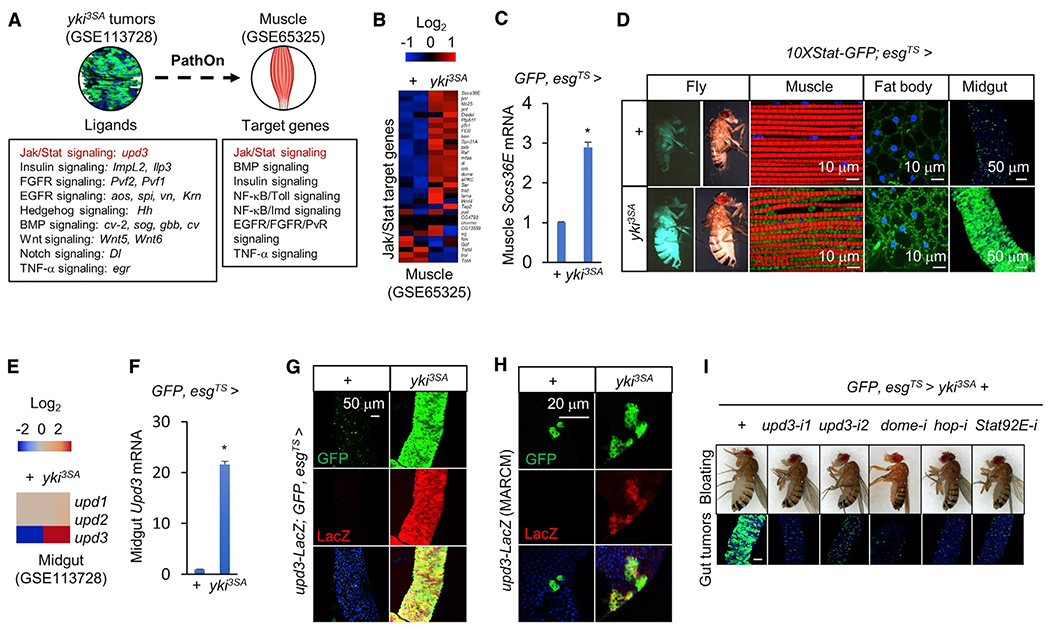
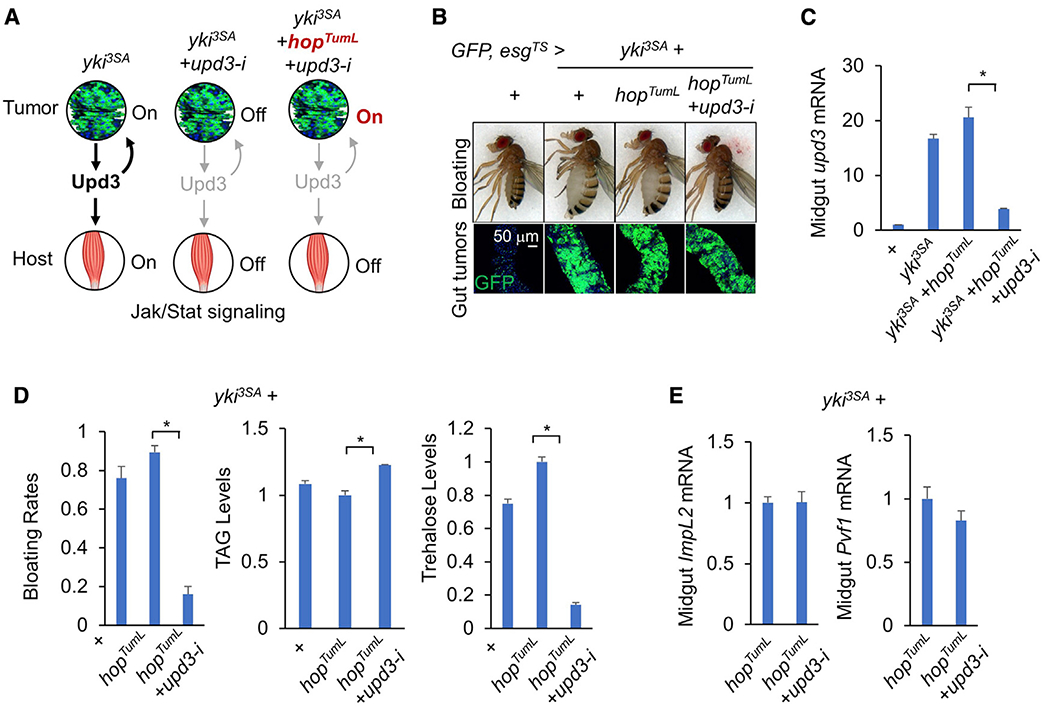
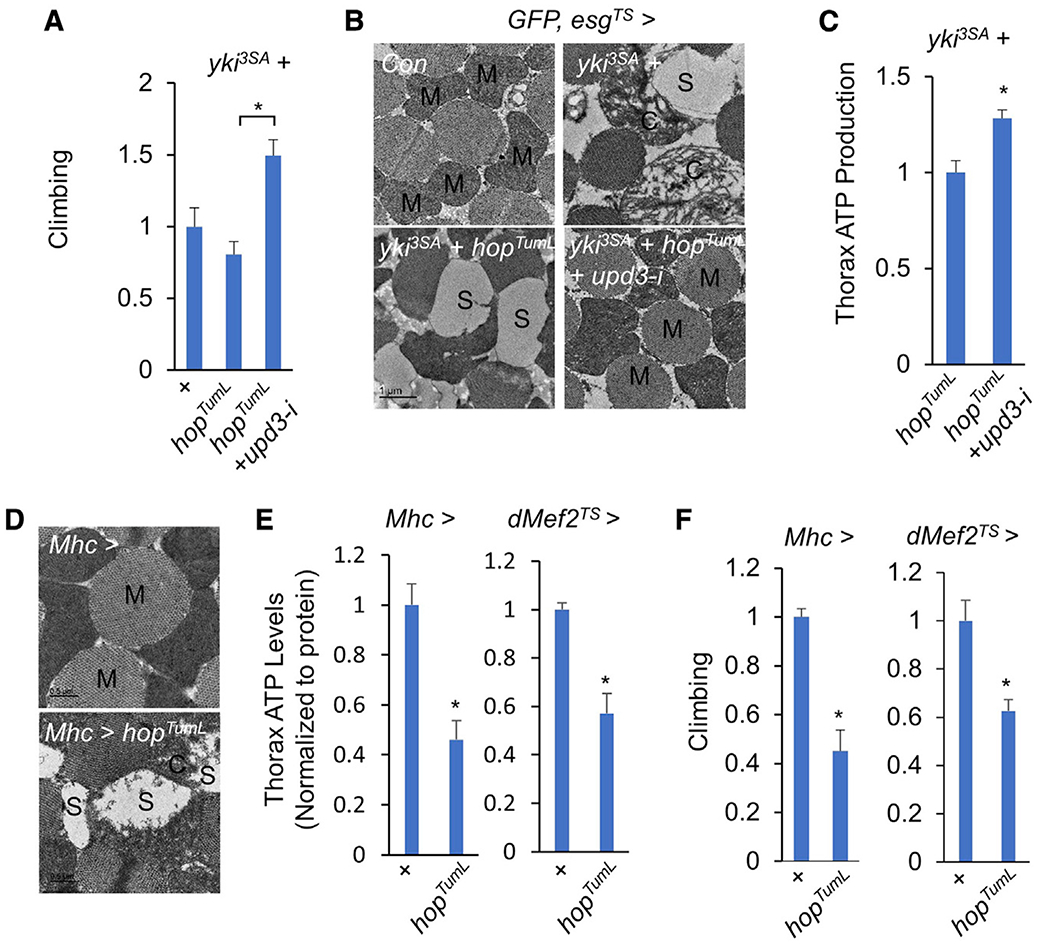
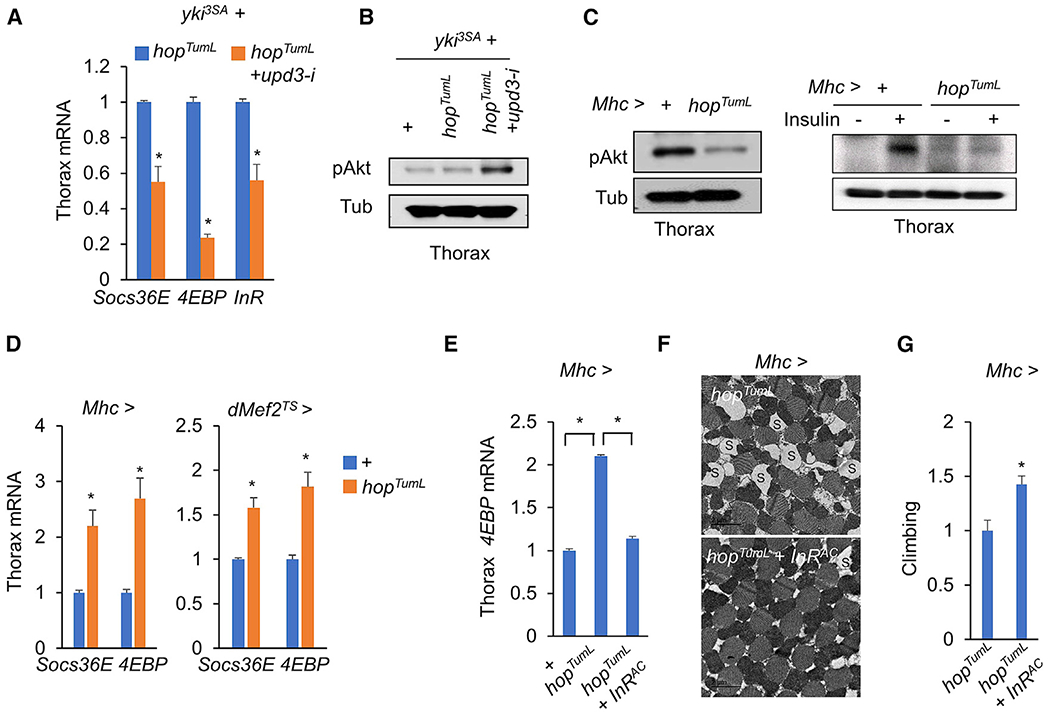
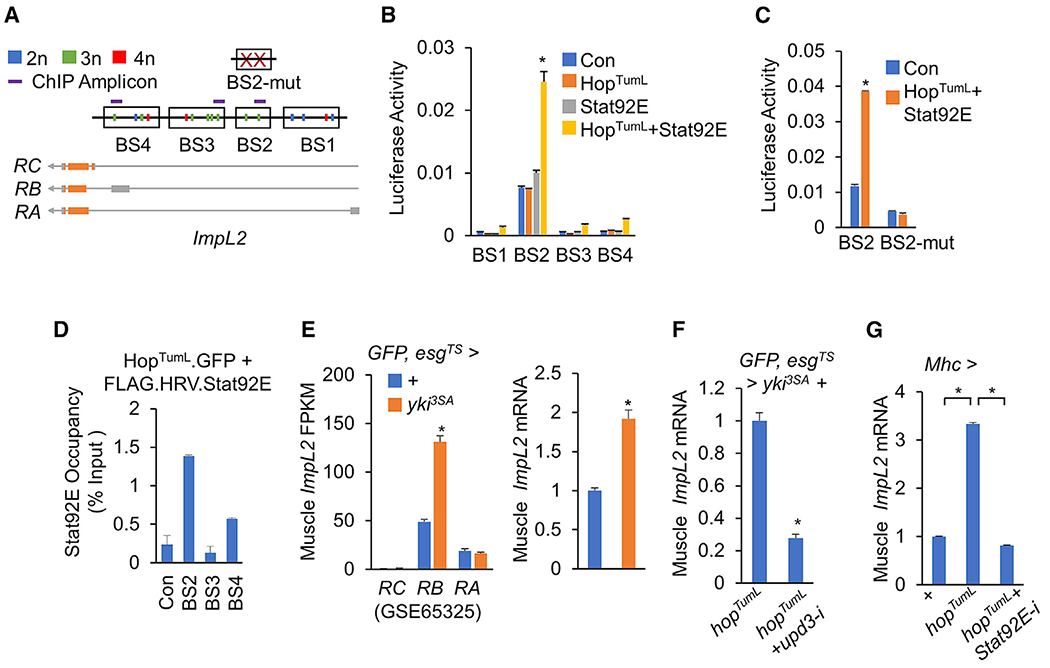
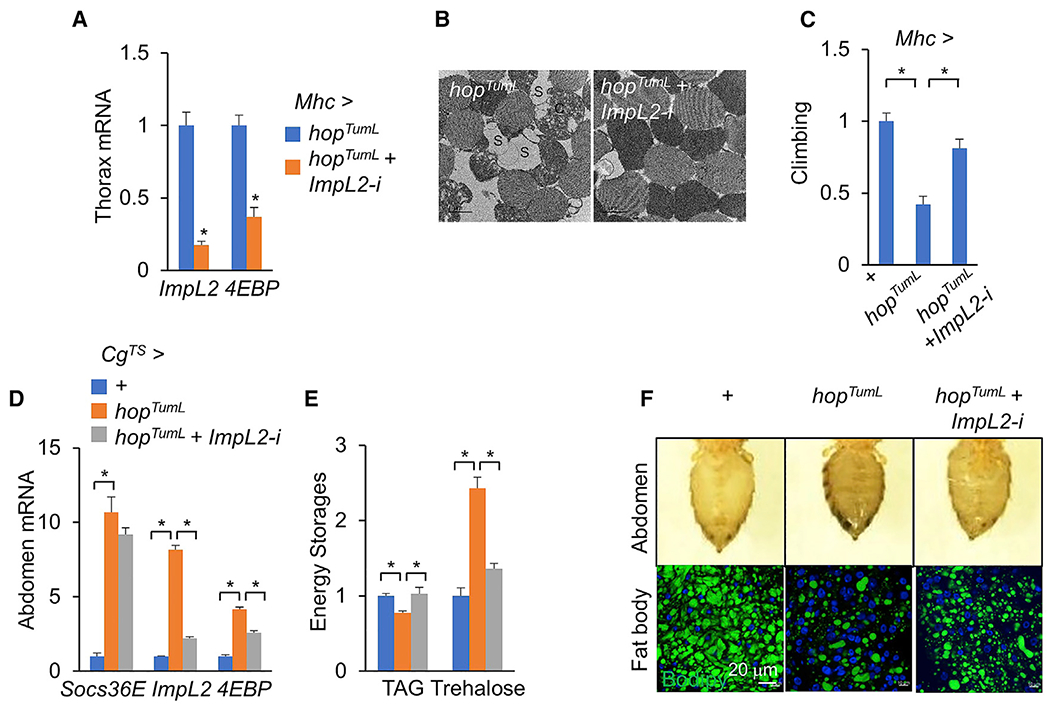
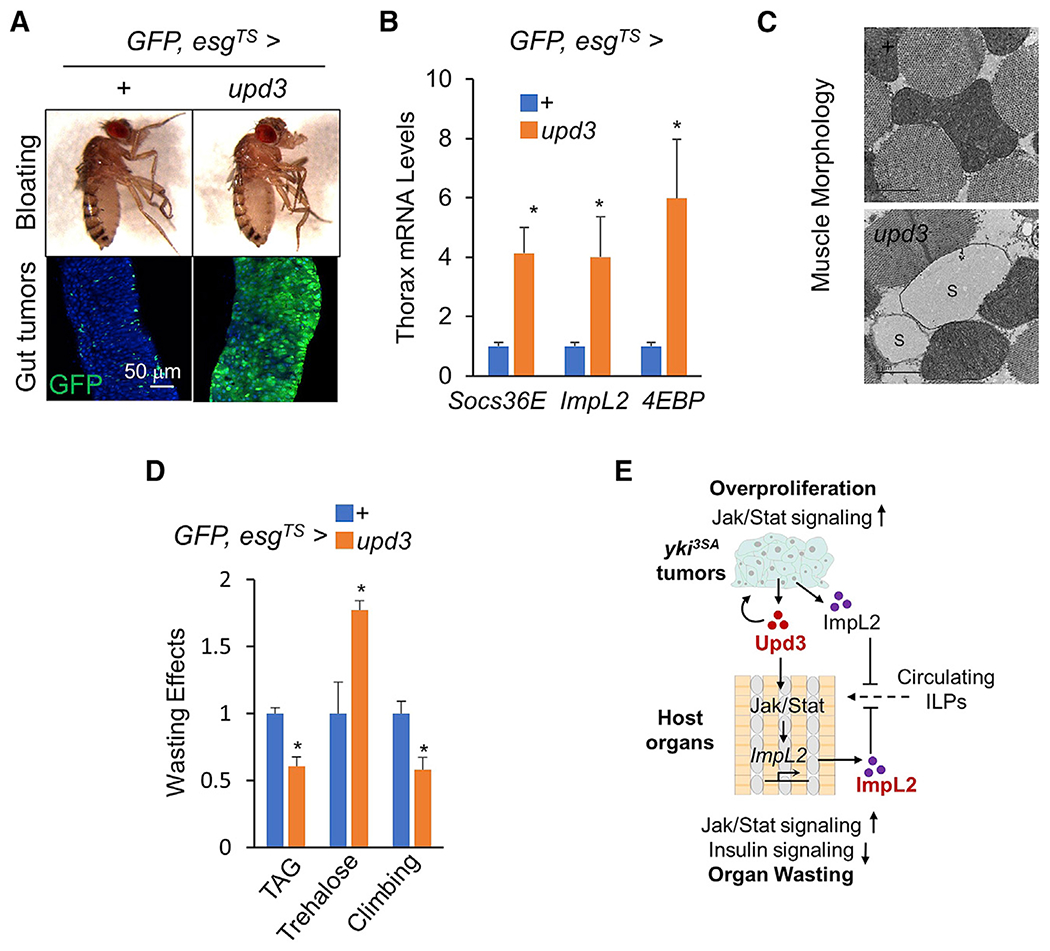
yki-induced gut tumors in Drosophila are associated with host wasting, including muscle dysfunction, lipid loss, and hyperglycemia, a condition reminiscent of human cancer cachexia. We previously used this model to identify tumor-derived ligands that contribute to host wasting. To identify additional molecular networks involved in host-tumor interactions, we develop PathON, a web-based tool analyzing the major signaling pathways in Drosophila, and uncover the Upd3/Jak/Stat axis as an important modulator. We find that yki-gut tumors secrete Upd3 to promote self-overproliferation and enhance Jak/Stat signaling in host organs to cause wasting, including muscle dysfunction, lipid loss, and hyperglycemia. We further reveal that Upd3/Jak/Stat signaling in the host organs directly triggers the expression of ImpL2, an antagonistic binding protein for insulin-like peptides, to impair insulin signaling and energy balance. Altogether, our results demonstrate that yki-gut tumors produce a Jak/Stat pathway ligand, Upd3, that regulates both self-growth and host wasting.

Keywords: Drosophila; ImpL2; Jak/Stat signaling; Upd3; cancer cachexia; lipid loss; muscle dysfunction; tumor-induced wasting; yki.


Conflict of interest statement

Declaration of interests The authors declare no competing interests.

Figures

Figure 1.
Figure 1.. Upd3/Jak/Stat signaling is involved in tumor-host interactions
(A) Results of analysis with PathON, a software resource covering 14 canonical signaling pathways in Drosophila, reveal transcriptional changes in ligands and signature target genes of the indicated signaling pathways in gut tumors and muscles of yki3SA-tumor-bearing flies, respectively, at day 8. (B and C) Expression levels of target genes of Jak/Stat signaling in the muscles of control flies (+: esg-GALl4, UAS-GFP, tub-GAL80TS/+) or yki3SA-tumor-bearing flies (yki3SA: esg-GAL4, UAS-GFP, tub-GAL80TS/+; UAS-yki3SA/+) at day 8. (B) Heatmap generated from GSE65325 RNA-seq data. (C) qPCR results (n = 3,5 flies/replicate). (D) 10XStat-GFP signals in the muscle, fat body, midgut, and whole fly. Scale bars: muscle, fat body, 10 μm; midgut, 50 μm. (E–G) Expression levels of Upd ligands in the midguts of control (+) and yki3SA-tumor-bearing flies (yki3SA) at day 8. (E) Heatmap generated from GSE113728 RNA-seq data. (F) qPCR results (n = 3, 10 flies/replicate). (G) Immunostaining indicating Upd3-LacZ expression (green) in the midgut. Scale bar: 50 μm. (H) MARCM assays indicating that upd3-LacZ expression (red) is increased mainly in the yki-tumor cells (green) and marginally in other gut cells. Scale bar: 20 μm. (I) Changes in the bloating phenotype (top) and gut tumors (bottom) of indicated genotypes at day 8. Scale bar: 50 μm. Data are presented as mean ± SEM. *p < 0.05.
Figure 2.
Figure 2.. Tumor-produced Upd3 causes bloating and muscle dysfunction
(A) Experimental strategy for uncoupling Jak/Stat signaling in the tumors and host organs. (B–D) Wasting effects in flies bearing yki3SA+hopTumL tumors with upd3 RNAi (HMS00646) at day 6: (B) bloating phenotype (top) and gut tumors (bottom; scale bar: 50 μm), (C) midgut gene expression of upd3 (n = 3, 10 flies/replicate), and (D) bloating rates (n = 4, 20 flies/replicate) and TAG and trehalose levels (n = 3, 5 flies/replicate). (E) Midgut gene expression of ImpL2 and Pvf1 (n = 3, 10 flies/replicate). Data are presented as mean ± SEM. *p < 0.05.
Figure 3.
Figure 3.. Upd3/Jak/Stat signaling impairs muscle mitochondrial homeostasis
(A–C) Climbing rates (A; n = 15), muscle mitochondrial morphologies (scale bar: 1 μm) (B), and ATP production (C; n = 3, 5 flies/replicate) of flies bearing yki3SA+hopTumL tumors with or without upd3 RNAi (HMS00646) at day 6. (D–F) Muscle mitochondrial morphologies including normal mitochondria (M) and injured mitochondria with fragmented cristae (C) or blank space (S) (D; scale bar: 0.5 μm), ATP production (E; n = 3, 5 flies/replicate), and climbing rates (F; n = 15) of flies with activation of Jak/Stat signaling in the muscle at day 4. Data are presented as mean ± SEM. *p < 0.05.
Figure 4.
Figure 4.. Upd3/Jak/Stat signaling impairs muscle insulin responses
(A and B) Insulin signaling, as indicated by target gene expression (A; n = 3,5 flies/replicate) or p-Akt (B), in thethoraces of flies bearing yki3SA-gut tumors with or without upd3 RNAi (HMS00646) at day 6. (C and D) Insulin response, as indicated by p-Akt (C; left, freshly isolated thoraces; right, isolated thoraces that were treated with 1 μg/mL insulin for 30 min) or target gene expression (D; n = 3, 5 flies/replicate), in adult thoraces with activation of Jak/Stat signaling at day 4. (E–G) Muscle gene expression (E; n = 3, 5 flies/replicate), muscle mitochondrial morphology including injured mitochondria with blank space (S) (scale bar: 2 μm) (F), and climbing rates (G; n = 15) of adult flies with activation of Jak/Stat and insulin signaling in the muscle at day 4. Data are presented as mean ± SEM. *p < 0.05.
Figure 5.
Figure 5.. Upd3/Jak/Stat signaling promotes muscle ImpL2 expression
(A) Regions that contain putative Stat92E-binding sites (BS1-4) (TTCNNGAA, 2n, blue; TTCNNNGAA, 3n, green; TTCNNNNGAA, 4n, red) in the ImpL2 gene, BS2 with two mutated Stat-binding sites (BS2-mut), and ChIP amplicons are shown. (B and C) Relative luciferase activities of the indicated vectors that contain normal (B; BS1–4) and mutated (C; BS2-mut) Stat92E binding sites with Stat92E and/or HopTumL expression in S2R+ cells (n = 3). (D) The S2R+ cells were transfected with indicated vector were lysed and pulled down with anti-FLAG antibody to perform in vitro ChIP assays. Stat92E occupancies at promoter regions of ImpL2 as indicated relative to input were analyzed using qPCR. All ChIP-qPCR experiments were performed in duplicate. (E) Expression levels of ImpL2 in thoraces of flies bearing yki3SA-gut tumors at day 8 from RNA-seq analysis (left; GSE65325, NCBI-GEO) and qPCR (right; n = 3, 5 flies/replicate). (F and G) Muscle ImpL2 expression levels of flies bearing tumors with or without upd3 RNAi (HMS00646) at day 6 (F) or flies bearing hopTumL overexpression with or without Stat92E RNAi in the muscle at day 6 (G) (n = 3, 5 flies/replicate). Data are presented as mean ± SEM. *p < 0.05.
Figure 6.
Figure 6.. Jak/Stat signaling promotes organ wasting via ImpL2
(A–C) Thorax gene expression (A; n = 3, 5 flies/replicate), muscle mitochondrial morphology including injured mitochondria with blank space (S) (scale bar: 1 μm) (B), and climbing rates (C), n = 15) of flies with activation of Jak/Stat signaling plus ImpL2 RNAi (NIG 15009R-3) in the muscle at day 6. (D–F) Gene expression in abdomens (D; n = 3, 5 flies/replicate), whole-body TAG and trehalose levels (E; n = 3, 5 flies/replicate), abdomen appearance (F, top), and BODIPY that labels lipid droplets in the abdominal fat body (F, bottom; green, BODIPY; blue, DAPI; scale bar: 20 μm) of flies with activation of Jak/Stat signaling plus ImpL2 RNAi (HMC05809) in the fat body at day 4 Data are presented as mean ± SEM. *p < 0.05.
Figure 7.
Figure 7.. Upd3 overexpression in the ISCs causes tumor formation and host wasting
(A–D) Fly appearance (A, top), gut tumors (A bottom; scale bar: 50 μm), thoracic muscle gene expression (B; n = 3, 5 flies/replicate), and wasting effects such as muscle mitochondrial morphology including injured mitochondria with blank space (S) (C; scale bar: 1 μm), TAG and Trehalose storages (D; n = 3, 5 flies/replicate), and climbing rates (D; n = 15) of adult flies with upd3 overexpression in the ISCs at day 8. Data are presented as mean ± SEM. *p < 0.05 (E) Tumor-derived Upd3 coordinates tumor growth and host wasting via Jak/Stat signaling.

Similar articles

Cited by

  • A tumor-secreted protein utilizes glucagon release to cause host wasting.
    Ding G, Li Y, Cheng C, Tan K, Deng Y, Pang H, Wang Z, Dang P, Wu X, Rushworth E, Yuan Y, Yang Z, Song W. Ding G, et al. Cell Discov. 2025 Feb 10;11(1):11. doi: 10.1038/s41421-024-00762-0. Cell Discov. 2025. PMID: 39924534 Free PMC article.
  • Body composition and lung cancer-associated cachexia in TRACERx.
    Al-Sawaf O, Weiss J, Skrzypski M, Lam JM, Karasaki T, Zambrana F, Kidd AC, Frankell AM, Watkins TBK, Martínez-Ruiz C, Puttick C, Black JRM, Huebner A, Bakir MA, Sokač M, Collins S, Veeriah S, Magno N, Naceur-Lombardelli C, Prymas P, Toncheva A, Ward S, Jayanth N, Salgado R, Bridge CP, Christiani DC, Mak RH, Bay C, Rosenthal M, Sattar N, Welsh P, Liu Y, Perrimon N, Popuri K, Beg MF, McGranahan N, Hackshaw A, Breen DM, O'Rahilly S, Birkbak NJ, Aerts HJWL; TRACERx Consortium; Jamal-Hanjani M, Swanton C. Al-Sawaf O, et al. Nat Med. 2023 Apr;29(4):846-858. doi: 10.1038/s41591-023-02232-8. Epub 2023 Apr 12. Nat Med. 2023. PMID: 37045997 Free PMC article.
  • Cachexia: A systemic consequence of progressive, unresolved disease.
    Ferrer M, Anthony TG, Ayres JS, Biffi G, Brown JC, Caan BJ, Cespedes Feliciano EM, Coll AP, Dunne RF, Goncalves MD, Grethlein J, Heymsfield SB, Hui S, Jamal-Hanjani M, Lam JM, Lewis DY, McCandlish D, Mustian KM, O'Rahilly S, Perrimon N, White EP, Janowitz T. Ferrer M, et al. Cell. 2023 Apr 27;186(9):1824-1845. doi: 10.1016/j.cell.2023.03.028. Cell. 2023. PMID: 37116469 Free PMC article. Review.
  • A comprehensive review of animal models for cancer cachexia: Implications for translational research.
    Li L, Wazir J, Huang Z, Wang Y, Wang H. Li L, et al. Genes Dis. 2023 Sep 13;11(6):101080. doi: 10.1016/j.gendis.2023.101080. eCollection 2024 Nov. Genes Dis. 2023. PMID: 39220755 Free PMC article. Review.
  • FlyRNAi.org 2025 update-expanded resources for new technologies and species.
    Hu Y, Comjean A, Rodiger J, Chen W, Kim AR, Qadiri M, Gao C, Zirin J, Mohr SE, Perrimon N. Hu Y, et al. Nucleic Acids Res. 2025 Jan 6;53(D1):D958-D965. doi: 10.1093/nar/gkae917. Nucleic Acids Res. 2025. PMID: 39435987 Free PMC article.

References

    1. Acharyya S, and Guttridge DC, (2007). Cancer cachexia signaling pathways continue to emerge yet much still points to the proteasome. Clin. Cancer Res 13, 1356–1361. - PubMed
    1. Amoyel M, Anderson AM, and Bach EA, (2014). JAK/STAT pathway dysregulation in tumors: a Drosophila perspective. Semin. Cell Dev. Biol 28, 96–103. - PMC - PubMed
    1. Amoyel M, Anderson J, Suisse A, Glasner J, and Bach EA, (2016). Socs36E controls niche competition by repressing MAPK signaling in the Drosophila testis. PLoS Genet. 12, e1005815. - PMC - PubMed
    1. Aoyagi T, Terracina KP, Raza A, Matsubara H, and Takabe K, (2015). Cancer cachexia, mechanism and treatment. World J. Gastrointest. Oncol 7, 17–29. - PMC - PubMed
    1. Bach EA, Ekas LA, Ayala-Camargo A, Flaherty MS, Lee H, Perrimon N, and Baeg GH, (2007). GFP reporters detect the activation of the Drosophila JAK/STAT pathway in vivo. Gene Expr. Patterns 7, 323–331. - PubMed

Publication types

MeSH terms