. 2021 Sep 27;56(18):2562-2578.e3.
doi: 10.1016/j.devcel.2021.07.018. Epub 2021 Aug 17.

Reprogrammed lipid metabolism protects inner nuclear membrane against unsaturated fat

Affiliations

Reprogrammed lipid metabolism protects inner nuclear membrane against unsaturated fat

Anete Romanauska et al. Dev Cell. .

Abstract

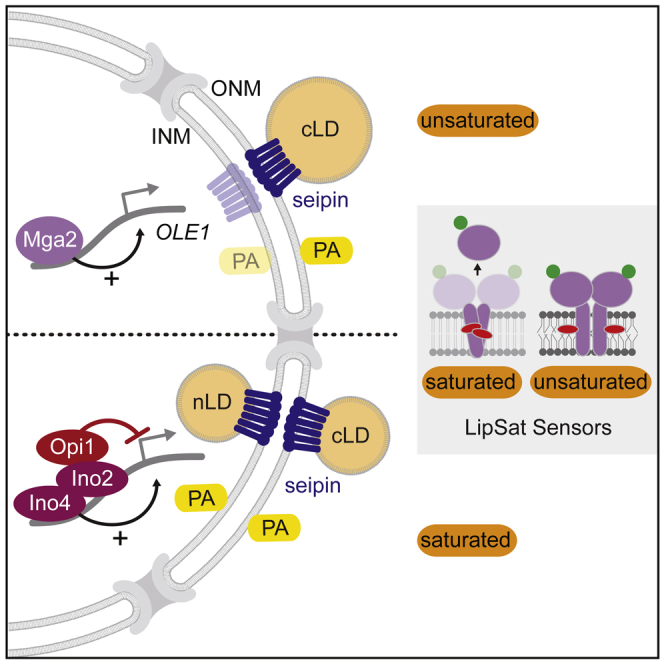
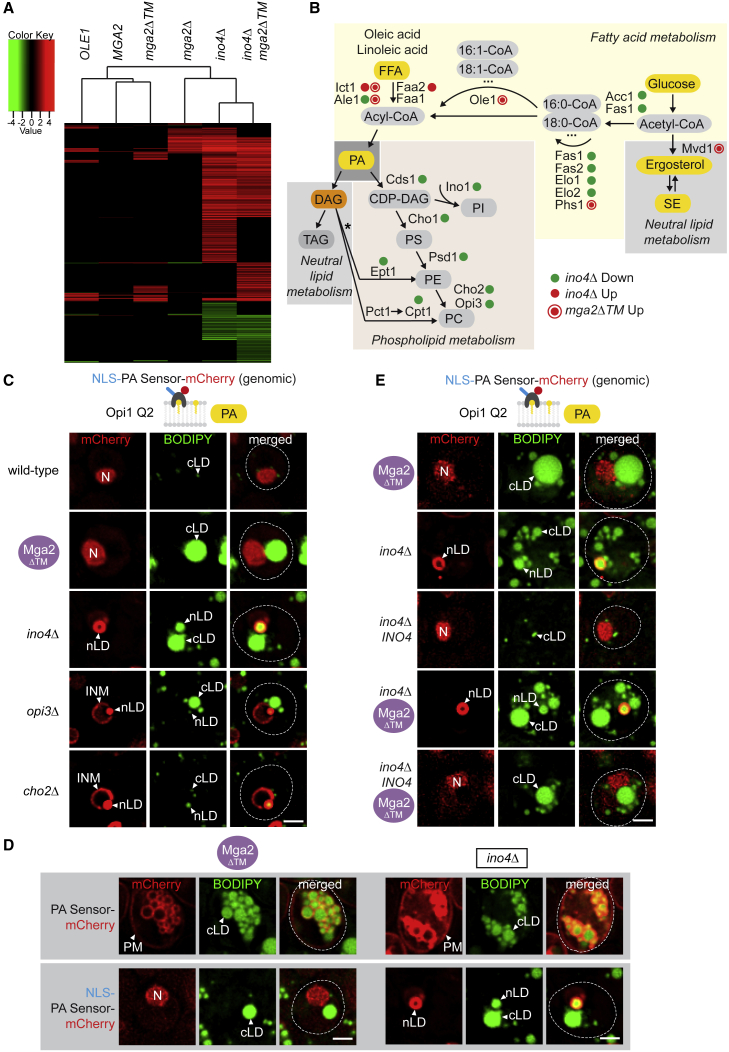
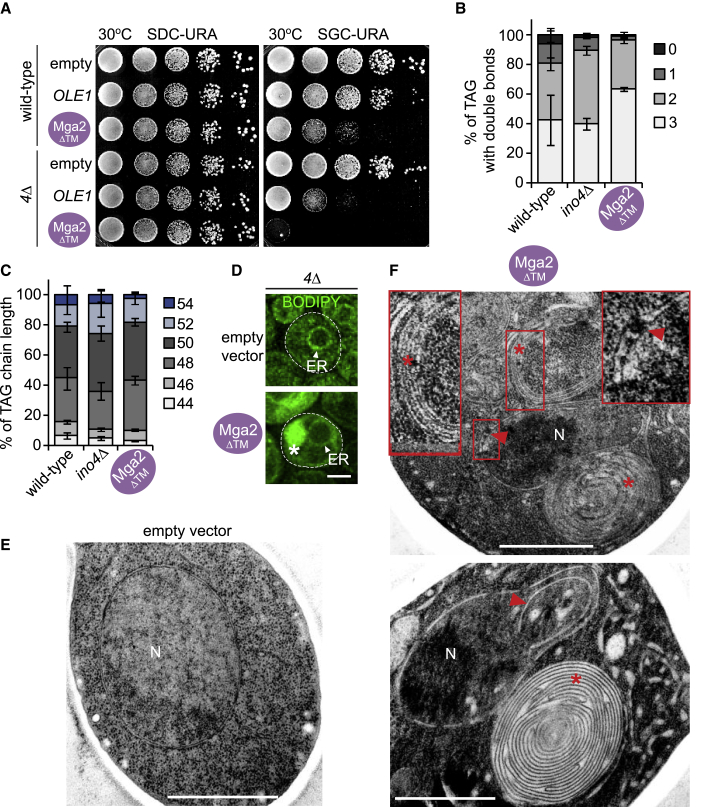
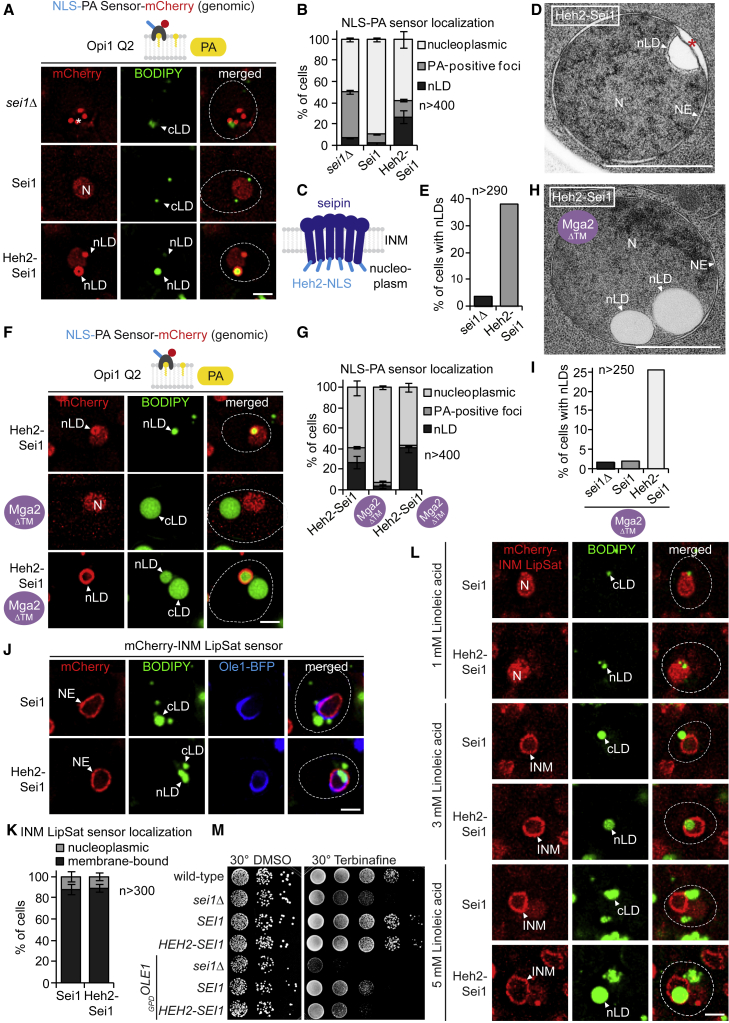
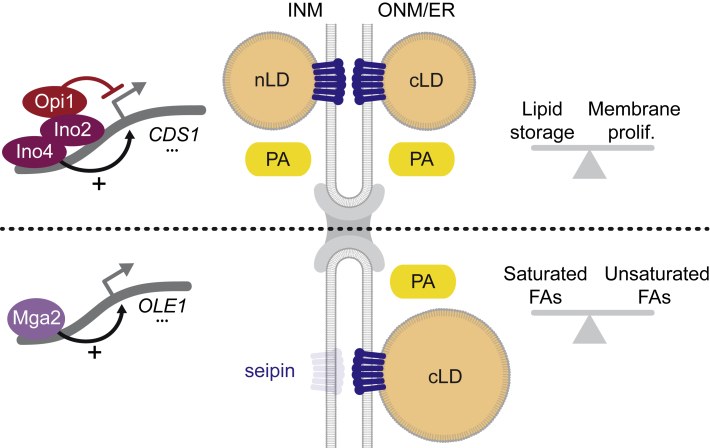
The cell nucleus is surrounded by a double membrane. The lipid packing and viscosity of membranes is critical for their function and is tightly controlled by lipid saturation. Circuits regulating the lipid saturation of the outer nuclear membrane (ONM) and contiguous endoplasmic reticulum (ER) are known. However, how lipid saturation is controlled in the inner nuclear membrane (INM) has remained enigmatic. Using INM biosensors and targeted genetic manipulations, we show that increased lipid unsaturation causes a reprogramming of lipid storage metabolism across the nuclear envelope (NE). Cells induce lipid droplet (LD) formation specifically from the distant ONM/ER, whereas LD formation at the INM is suppressed. In doing so, unsaturated fatty acids are shifted away from the INM. We identify the transcription circuits that topologically reprogram LD synthesis and identify seipin and phosphatidic acid as critical effectors. Our study suggests a detoxification mechanism protecting the INM from excess lipid unsaturation.

Keywords: Mga2/Ole1; endoplasmic reticulum; inner nuclear membrane; lipid biosensors; lipid droplets; lipid metabolism; nuclear envelope; phosphatidic acid; seipin; unsaturated fatty acids.


Conflict of interest statement

Declaration of interests The authors declare no competing interests.

Figures

None
Graphical abstract
Figure 1
Figure 1
The INM dynamically responds to exogenous FAs with various degree of saturation (A) Model of the OLE1 pathway. Homodimers of Mga2 and Spt23 (not shown) are embedded in the ER as inactive precursors (p120). Transmembrane helices (TM) sense lipid saturation/unsaturation by a conformational change. When lipid saturation decreases, Mga2 becomes ubiquitinated by the E3 Rsp5, partially processed by the proteasome and is mobilized by Cdc48 (not shown). The soluble transcription factor (p90) is imported into the nucleus, where OLE1 transcription is activated. (B) Domain organization of wild-type Mga2 and the lipid saturation (LipSat) sensors. p120 (120 kDa) designates unprocessed Mga2, p90 (90 kDa) the processed form. LipSat sensors lack the transcriptional AD and carry an N-terminal mGFP. The full-length and processed versions of the LipSat sensors are termed p120 and p90, respectively. The NLS of the INM-resident transmembrane protein Heh2 was appended to the INM LipSat sensor for nuclear import by lateral membrane diffusion. In contrast, the endogenous NLS of Mga2 promotes import of the soluble, processed p90 fragment. IPT, immunoglobulin-like/plexins/transcription factors domain required for dimerization; ANK, ankyrin repeats; TM, transmembrane domain. Triangle indicates Rsp5-binding site, asterisk depicts multiple ubiquitination sites. (C) LipSat sensing is based on the Mga2 mechanism. A conserved tryptophane (W1042) transduces the membrane’s saturation state into an inward or outward rotational movement of the transmembrane helices. When saturated lipids increase, the sensor is activated and released from the membrane (ON). In contrast, unsaturated membranes do not trigger processing, resulting in membrane-bound LipSat sensors (OFF). Note that the E3 ligase Rsp5, the unfoldase Cdc48 and the 26S proteasome are present in both cytoplasm and nucleus allowing sensor processing in both compartments. (D) Cartoon of predicted LipSat sensor localizations. Dashed green line beneath plasma membrane depicts peripheral ER. (E) Live imaging of mga2Δ cells expressing the plasmid-based INM LipSat sensor supplemented with the indicated fatty acids (16 mM). Sensor fluorescence intensity was quantified across a line spanning the nucleus. For comparison the FU value 1 is marked with a horizontal dashed line. Cell contours are marked by a dashed white line. Arbitrary fluorescence units, FU; nucleus, N; nuclear envelope, NE; nucleoplasmic localization, NP loc; nuclear envelope localization, NE loc. Scale bar, 2 μm. (F) Quantification of INM LipSat sensor localization in (E). Phenotypes were classified as membrane bound or nucleoplasmic LipSat sensor. Mean value and standard deviation are depicted. n = number of analyzed cells for each condition from 3 biological replicates. (G) Immunoblotting analysis of INM LipSat sensor processing. Samples were taken from cell cultures used in (E). Heh2-p120 is membrane bound, Heh2-p90 is processed and soluble. Note that the GFP-tagged Heh2-p120/p90 fragments have a higher molecular weight than p120/p90. Pgk1 (3-phosphoglycerate kinase) serves as a loading control. (H) Quantification of INM LipSat sensor processing in (G). The percentage of Heh2-p120 and Heh2-p90 relative to total amount of sensor was quantified. The mean value and standard deviation from 3 biological replicates are depicted. (I) Live imaging of mga2Δ cells expressing the wild-type or mutant INM LipSat sensors. The conserved P1044 (aa position refers to full-length Mga2) is thought to provide conformational flexibility to the transmembrane helices during their relative rotations and facilitates the intimate interaction of two conserved W1042 residues in the dimer interface (see Figure 1C). Sensor fluorescence intensity was quantified across a line spanning the nucleus. For comparison the FU value 1 is marked with a horizontal dashed line. Arbitrary fluorescence units, FU; nucleus, N; nuclear envelope, NE; nucleoplasmic localization, NP loc; nuclear envelope localization, NE loc. Scale bar, 2 μm. (J) Immunoblotting analysis of INM LipSat sensor processing in (I). Pgk1 serves as a loading control. (K) Quantification of INM LipSat sensor processing in (J). The percentage of Heh2-p120 and Heh2-p90 relative to total amount of sensor was quantified. The mean value and standard deviation from 3 biological replicates are depicted.
Figure 2
Figure 2
Ole1 overexpression increases UFA but not PA levels at the INM (A) Live imaging of cells expressing the INM LipSat sensor together with Ole1-mCherry (bottom panel) or an empty vector (top panel). Ole1-mCherry was expressed from the strong GPD (TDH3) promoter. Plasmids were transformed into mga2Δ cells. Sensor fluorescence intensity was quantified across a line spanning the nucleus. For comparison the FU value 1 is marked with a horizontal dashed line. Arbitrary fluorescence units, FU; nucleus, N; peripheral endoplasmic reticulum, pER; nuclear envelope, NE; nucleoplasmic localization, NP loc; nuclear envelope localization, NE loc. Scale bar, 2 μm. (B) Quantification of INM LipSat sensor localization in (A). Phenotypes were classified as membrane bound or nucleoplasmic. Mean value and standard deviation depicted. n = number of analyzed cells for each condition from 3 biological replicates. (C) Immunoblotting analysis of INM LipSat sensor processing in (A). Note that the GFP-tagged Heh2-p120/p90 fragments have a higher molecular weight than p120/p90. Pgk1 serves as a loading control. (D) Quantification of INM LipSat sensor processing in (C). The percentage of Heh2-p120 and Heh2-p90 relative to total amount of sensor was quantified. The mean value and standard deviation from 3 biological replicates are depicted. (E) Live imaging of genomically integrated NLS-PA-mCherry sensor expressed in wild-type cells, which were supplemented with the indicated fatty acids (each 16 mM dissolved in 1.5% Brij L23 solution). The NLS-PA-mCherry sensor contains the Q2 domain of the S. cerevisiae transcription factor Opi1 that specifically recognizes phosphatidic acid (PA). LDs are stained with the BODIPY dye. Nucleus, N; inner nuclear membrane, INM; nuclear lipid droplet, nLD; cytoplasmic lipid droplet, cLD. Scale bar, 2 μm. (F) Quantification of NLS-PA-mCherry localization as observed in (E). Additional fatty acid concentrations were also quantified. n = number of analyzed cells from 3 biological replicates are depicted. Using t test, a statistically significant difference for the percentage of nLDs was verified between 16 mM oleic and 16 mM linoleic acid; and between 3 and 8 mM oleic acid. 8 and 16 mM oleic acid were not significantly different. (G) Quantification of total LD volume per cell in (E). Additional fatty acid concentrations were also quantified. LD volumes were measured as described in STAR Methods. n = number of analyzed cells from at least 3 biological replicates. Using t test, no statistically significant difference of LD volume per cell between 16 mM oleic and 16 mM linoleic acid, or between 8 mM oleic acid and 8 mM linoleic acid was found. (H) Live imaging of the indicated strains expressing genomically integrated NLS-PA-mCherry sensor. LDs are stained with the BODIPY dye. Genomically integrated BFP-tagged Ole1 was overexpressed from the GPD promoter. Nucleus, N; nuclear lipid droplet, nLD; cytoplasmic lipid droplet, cLD. Scale bar, 2 μm. (I) Quantification of NLS-PA-mCherry sensor localization as observed in (H). n = number of analyzed cells from 3 biological replicates.
Figure 3
Figure 3
Mga2 selectively promotes cytoplasmic lipid droplet production (A) Live imaging of mga2Δ cells expressing plasmid-based, full-length Mga2-mCherry or Mga2-mCherry lacking the transmembrane helix (Mga2ΔTM). Mga2 variants were expressed from the endogenous MGA2 or the strong GPD promoter (see also Figures S2L and S2M). LDs are stained with BODIPY. Nucleus, N; peripheral ER, pER; nuclear envelope, NE. Scale bar, 2 μm. (B) Live imaging of the INM LipSat sensor co-expressed with Mga2ΔTM-mCherry or an empty vector. Genomically integrated Mga2ΔTM-mCherry was expressed from the strong GPD promoter in mga2Δ cells. Sensor fluorescence intensity was quantified across a line spanning the nucleus. For comparison the FU value 1 is marked with a horizontal dashed line. Arbitrary fluorescence units, FU; nucleus, N; nuclear envelope, NE; nucleoplasmic localization, NP loc; nuclear envelope localization, NE loc. Scale bar, 2 μm. (C) Quantification of INM LipSat sensor localization in (B). Phenotypes were classified as membrane bound or nucleoplasmic. Mean value and standard deviation are depicted. n = number of analyzed cells for each condition from 3 biological replicates. (D) Immunoblotting analysis of INM LipSat sensor processing in (B). Note that the GFP-tagged Heh2-p120/p90 fragments have a higher molecular weight than p120/p90. Pgk1 serves as a loading control. (E) Quantification of INM LipSat sensor processing in (D). The percentage of Heh2-p120 and Heh2-p90 relative to total amount of sensor was quantified. The mean value and standard deviation from 3 biological replicates are depicted. (F) Quantification of total LD volume per cell in the indicated strains. n = number of analyzed cells from 3 biological replicates. Mean value and standard deviation are depicted. (G) Ultrastructural analysis of ino4Δ and Mga2ΔTM cells by TEM. Plasmid-based Mga2ΔTM was expressed from the strong GPD promoter in mga2Δ cells (see also Figure S3I). The red asterisk marks NE evaginations, which are a common feature of ino4Δ cells. Cytoplasmic lipid droplet, cLD; nuclear lipid droplet, nLD; nucleus, N. Scale bar, 1 μm. (H) Quantification of nLDs and NE evaginations in (G). n = number of analyzed cells.
Figure 4
Figure 4
Transcriptome signatures of compartment-specific LD synthesis (A) Cluster diagram of genes with significantly altered mRNA levels (>1.5-fold) in the indicated strains. Changes in mRNA levels were compared with the wild-type strain and are depicted in red (up), green (down), or black (no change). See also Figure S4A. (B) Simplified scheme of lipid metabolism in yeast. Major pathways are color coded, and key lipid intermediates/end products are depicted. Differentially transcribed enzymes in the mutant strains are shown and marked with a green dot (down), red dot (up). See also Figure S4B for the additional mutants shown in Figure 4A. Asterisk indicates the Kennedy pathway, which uses exogenous choline and ethanolamine together with DAG to form PE and PC. (C) Live imaging of NLS-PA-mCherry sensor expressed genomically in the indicated strains (see also Figure S4E). BODIPY stains LDs. Nucleus, N; inner nuclear membrane, INM; nuclear lipid droplet, nLD; cytoplasmic lipid droplet, cLD. Scale bar, 2 μm. (D) Comparison of PA distribution in the nucleus and cytoplasm. Live imaging of the PA-mCherry sensor (cytoplasm) or NLS-PA-mCherry sensor (nucleus) expressed in ino4Δ and Mga2ΔTM cells. Genomically integrated Mga2ΔTM was overexpressed from the GPD promoter. BODIPY stains LDs. Nucleus, N; plasma membrane, PM; cytoplasmic lipid droplet, cLD; nuclear lipid droplet, nLD. Scale bar, 2 μm. (E) Live imaging of NLS-PA-mCherry sensor in the indicated strains (see also Figures S4H and S4I). BODIPY stains LDs. Nucleus, N; nuclear lipid droplet, nLD. Scale bar, 2 μm.
Figure 5
Figure 5
Lipid unsaturation is highly toxic if not buffered by cLDs (A) Growth analysis of wild-type or 4Δ (dga1Δ lro1Δ are1Δ are2Δ) cells transformed with the indicated plasmids. Ole1 and Mga2ΔTM were overexpressed from the galactose-inducible GAL1 promoter. Growth was followed on SDC-URA (repressed) and SGC-URA (induced) plates. Cells were spotted onto plates in 10-fold serial dilutions and incubated at 30°C. (B) Analysis of TAG fatty acid saturation levels in LDs purified from the indicated strains from 3 biological replicates. Mean value and standard deviation are shown. TAG contains three fatty acyl chains; hence, the number of double bonds can range from 0 to 3. (C) Analysis of TAG fatty acid chain length in LDs purified from the indicated strains from 3 biological replicates. Mean value and standard deviation are depicted. (D) Live imaging of BODIPY-stained 4Δ cells expressing Mga2ΔTM from the inducible GAL1 promoter or an empty plasmid. 4Δ cells are deficient in LDs and BODIPY labels endomembranes instead. Endoplasmic reticulum, ER. Asterisk marks abnormal membrane structure. Scale bar, 2 μm. (E and F) TEM analysis of representative examples of cells overexpressing Mga2ΔTM from the inducible GAL1 promoter or an empty vector (see also Figure S5). Red asterisk marks membrane stacks/whorls; red arrowhead indicates NE defects including NE expansions and alterations of the perinuclear space. Insets show a magnified view of the marked areas. Nucleus, N. Scale bar, 1 μm.
Figure 6
Figure 6
Targeting seipin to the INM is sufficient to produce nLDs (A) Live imaging of sei1Δ cells expressing the NLS-PA-mCherry sensor and the indicated SEI1 constructs or an empty vector (see also Figure S6B). SEI1 constructs were expressed from the endogenous SEI1 promoter. nLDs have a BODIPY-positive core surrounded by a PA-rich shell. Nucleus, N; nuclear lipid droplet, nLD. Asterisk marks PA-positive foci. Scale bar, 2 μm. (B) Quantification of NLS-PA-mCherry sensor localization as observed in (A). n = number of analyzed cells obtained from 3 biological replicates. (C) Cartoon of the engineered Sei1 structure with the Heh2-NLS attached. Putative membrane topology is based on cryo-EM models. (D) TEM analysis of a representative example of Heh2-Sei1-expressing cells. Plasmid-based Heh2-Sei1 was expressed from the SEI1 promoter in a sei1Δ strain (see Figures S7A–S7F for a gallery). Nucleus, N; nuclear envelope, NE; nuclear lipid droplet, nLD. Asterisk marks a widened perinuclear space beneath an nLD. Scale bar, 1 μm. (E) Quantification of nLD numbers in (D). n = number of analyzed cells. (F) Live imaging of NLS-PA-mCherry sensor in the indicated strains as a readout for nLD production. nLDs have a BODIPY-positive core surrounded by a PA-rich shell. Nucleus, N; nuclear lipid droplet, nLD. Scale bar, 2 μm. (G) Quantification of NLS-PA-mCherry sensor localization in (F). n = number of analyzed cells obtained from 3 biological replicates. (H) TEM analysis of Heh2-Sei1 expression in Mga2ΔTM cells (see also Figures S7G–S7K for a gallery). Nucleus, N; nuclear envelope, NE; nuclear lipid droplet, nLD. Scale bar, 1 μm. (I) Quantification of nLD numbers in (H). n = number of analyzed cells. (J) Live imaging of an mCherry-tagged INM LipSat sensor in cells that overexpress genomically integrated Ole1-BFP (GPD promoter) and contain Sei1 or Heh2-Sei1 constructs. Constructs were transformed into a sei1Δ mga2Δ strain. BODIPY stains LDs. Nuclear envelope, NE; nuclear lipid droplet, nLD; cytoplasmic lipid droplet, cLD. Scale bar, 2 μm. (K) Quantification of INM LipSat sensor localization in (J). Phenotypes were classified as membrane bound or nucleoplasmic. Mean value and standard deviation are depicted. n = number of analyzed cells for each condition from 3 biological replicates. (L) Live imaging of an mCherry-tagged INM LipSat sensor co-expressed with Sei1 or Heh2-Sei1 constructs in cells supplemented with the indicated concentration of linoleic acid (dissolved in 1.5% Brij L23 solution). Constructs were transformed into a sei1Δ mga2Δ strain. BODIPY stains LDs. Nucleus, N; inner nuclear membrane, INM; nuclear lipid droplet, nLD; cytoplasmic lipid droplet, cLD. Scale bar, 2μm. (M) Phenotypic analysis of the indicated strains. Genomically integrated Ole1-BFP was overexpressed from a GPD promoter. Growth was followed on SDC-LEU plates with DMSO or supplemented with 100 μg/mL Terbinafine and DMSO. Cells were spotted onto plates in 10-fold serial dilutions and incubated at 30°C.
Figure 7
Figure 7
Reprogramming LD biogenesis from the INM to the ONM Model describes how two distinct transcriptional circuits, together with seipin and PA distribution across the NE, collectively regulate the balance of nLD/cLD production in response to UFAs and nutrients. Inhibition of Ino2/4 by Opi1 stimulates both cLD and nLD formation and correlates with high PA levels at the INM and ONM/ER. This pathway globally determines whether cells invest into lipid storage or membrane proliferation. In contrast, the Mga2-Ole1 circuit preferentially induces cLDs, while nLD biogenesis is inhibited, possibly through low PA levels and decreased seipin activity at the INM (transparent icon). The reprogramming of LD biogenesis from the INM to the ONM may protect the nucleus from UFA-induced lipotoxicity.

Comment in

  • Nuclear detox of unsaturated fat.
    Mannino PJ, Lusk CP. Mannino PJ, et al. Dev Cell. 2021 Sep 27;56(18):2539-2541. doi: 10.1016/j.devcel.2021.09.002. Dev Cell. 2021. PMID: 34582769

References

    1. Anders S., Pyl P.T., Huber W. HTSeq--a Python framework to work with high-throughput sequencing data. Bioinformatics. 2015;31:166–169. - PMC - PubMed
    1. Barbosa A.D., Lim K., Mari M., Edgar J.R., Gal L., Sterk P., Jenkins B.J., Koulman A., Savage D.B., Schuldiner M. Compartmentalized synthesis of triacylglycerol at the inner nuclear membrane regulates nuclear organization. Dev. Cell. 2019;50:755–766.e6. - PMC - PubMed
    1. Bigay J., Antonny B. Curvature, lipid packing, and electrostatics of membrane organelles: defining cellular territories in determining specificity. Dev. Cell. 2012;23:886–895. - PubMed
    1. Black P.N., DiRusso C.C. Yeast acyl-CoA synthetases at the crossroads of fatty acid metabolism and regulation. Biochimica et Biophysica Acta (BBA) - Molecular. and. Cell. Biology. of. Lipids. 2007;1771:286–298. - PubMed
    1. Carman G.M., Han G.S. Regulation of phospholipid synthesis in the yeast Saccharomyces cerevisiae. Annu. Rev. Biochem. 2011;80:859–883. - PMC - PubMed

Publication types

MeSH terms